| Param | Original file | Final file |
|---|---|---|
| Filename | modeM0/AS1A05_062T01_9000003132_21174cztM0_level2.evt | modeM0/AS1A05_062T01_9000003132_21174cztM0_level2_quad_clean.evt |
| Size (bytes) | 400,377,600 | 67,570,560 |
| Size | 381.8 MB | 64.4 MB |
| Events in quadrant A | 2,427,716 | 440,007 |
| Events in quadrant B | 2,619,721 | 441,731 |
| Events in quadrant C | 2,368,729 | 419,570 |
| Events in quadrant D | 4,380,171 | 404,694 |
| Mode SS | |||
|---|---|---|---|
| Quadrant | BADHDUFLAG | Total packets | Discarded packets |
| A | 0 | 100 | 0 |
| B | 0 | 100 | 0 |
| C | 0 | 100 | 0 |
| D | 0 | 100 | 0 |
| Mode M9 | |||
|---|---|---|---|
| Quadrant | BADHDUFLAG | Total packets | Discarded packets |
| A | 0 | 12 | 0 |
| B | 0 | 12 | 0 |
| C | 0 | 12 | 0 |
| D | 0 | 12 | 0 |
| Mode M0 | |||
|---|---|---|---|
| Quadrant | BADHDUFLAG | Total packets | Discarded packets |
| A | 0 | 10460 | 1 |
| B | 0 | 10961 | 1 |
| C | 0 | 10226 | 1 |
| D | 0 | 16328 | 1 |
| Quadrant | Total seconds | Saturated seconds | Saturation percentage |
|---|---|---|---|
| A | 4841 | 45 | 0.929560% |
| B | 4841 | 63 | 1.301384% |
| C | 4841 | 67 | 1.384012% |
| D | 4841 | 230 | 4.751084% |
Noise dominated data is calculated using 1-second bins in cleaned event files. If a bin has >2000 counts, and if more than 50% of those come from <1% of pixels, then it is considered to be noise-dominated and hence unusable.
| Quadrant | # 1 sec bins | Bins with >0 counts | Bins with >2000 counts | High rate bins dominated by noise | Noise dominated (total time) | Noise dominated (detector-on time) | Marked lightcurve |
|---|---|---|---|---|---|---|---|
| A | 6066 | 4842 | 1 | 1 | 0.02% | 0.02% |  |
| B | 6066 | 4842 | 13 | 13 | 0.21% | 0.27% | 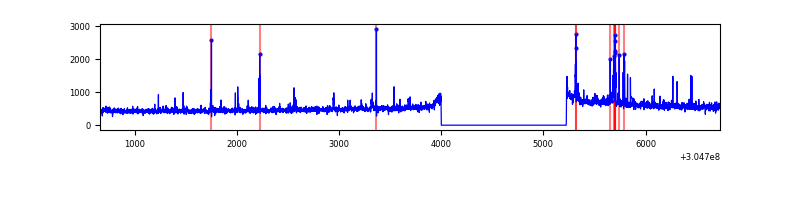 |
| C | 6066 | 4842 | 0 | 0 | 0.00% | 0.00% | 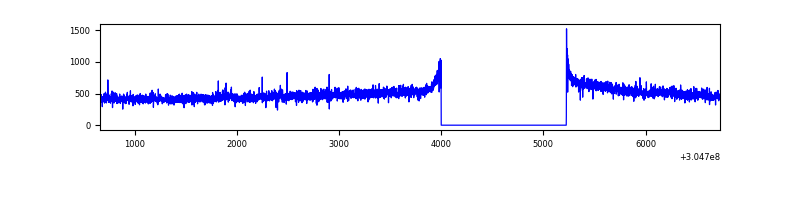 |
| D | 6066 | 4842 | 194 | 194 | 3.20% | 4.01% |  |
Top three noisy pixels from each quadrant. If the there are fewer than three noisy pixels in the level2.evt file, extra rows are filled as -1
| Pixel properties | Quadrant properties | ||||||
|---|---|---|---|---|---|---|---|
| Quadrant | DetID | PixID | Counts | Sigma | Mean | Median | Sigma |
| A | 10 | 229 | 49089 | 393.76 | 614 | 602 | 123.1 |
| A | 8 | 6 | 6329 | 46.51 | 614 | 602 | 123.1 |
| A | 13 | 254 | 6005 | 43.88 | 614 | 602 | 123.1 |
| B | 3 | 64 | 35041 | 293.56 | 612 | 598 | 117.3 |
| B | 0 | 230 | 31498 | 263.36 | 612 | 598 | 117.3 |
| B | 0 | 182 | 29358 | 245.12 | 612 | 598 | 117.3 |
| C | 14 | 238 | 93139 | 684.58 | 577 | 580 | 135.2 |
| C | 3 | 233 | 17047 | 121.79 | 577 | 580 | 135.2 |
| C | 10 | 222 | 4603 | 29.75 | 577 | 580 | 135.2 |
| D | 1 | 20 | 1779264 | 12687.09 | 578 | 561 | 140.2 |
| D | 14 | 34 | 155045 | 1101.9 | 578 | 561 | 140.2 |
| D | 13 | 153 | 113418 | 804.98 | 578 | 561 | 140.2 |
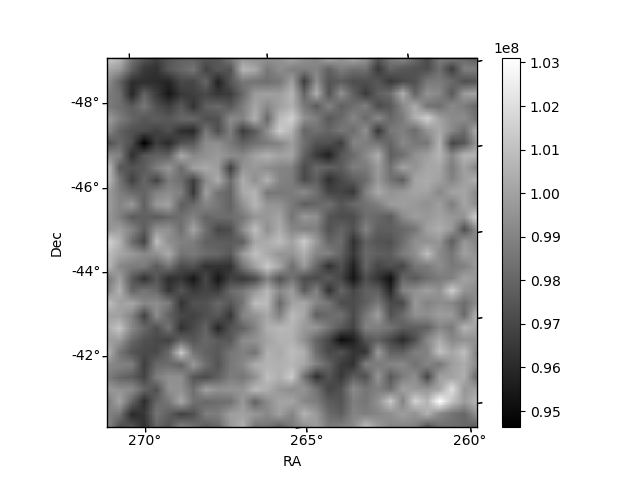
Histogram calculated using DETX and DETY for each event in the final _common_clean file
| Quadrant A | 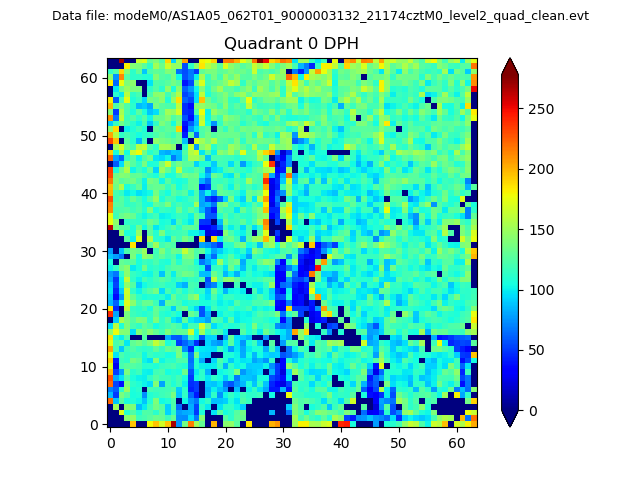 |
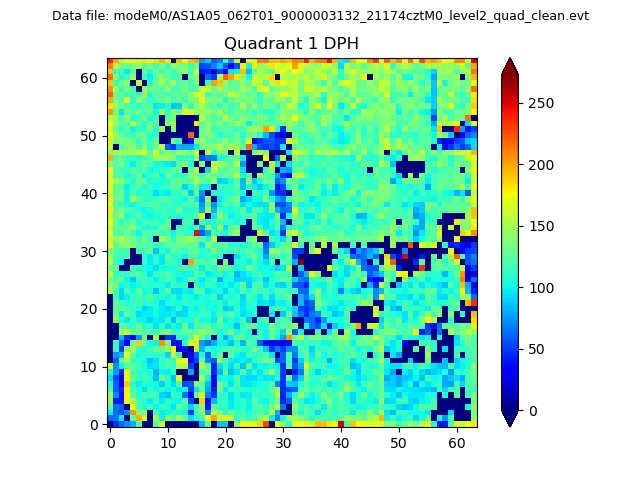 |
Quadrant B |
|---|---|---|---|
| Quadrant D | 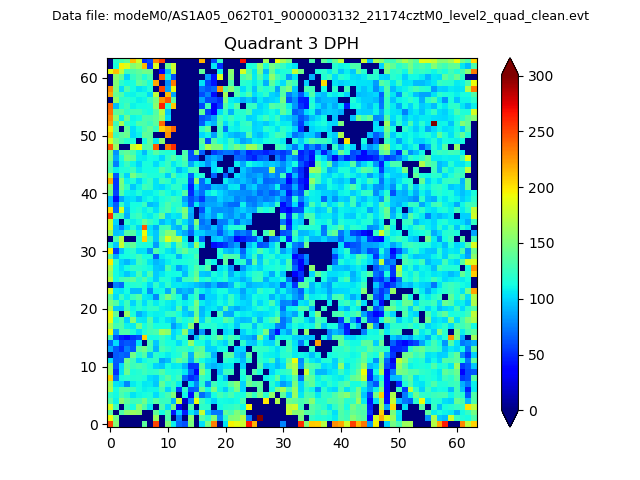 |
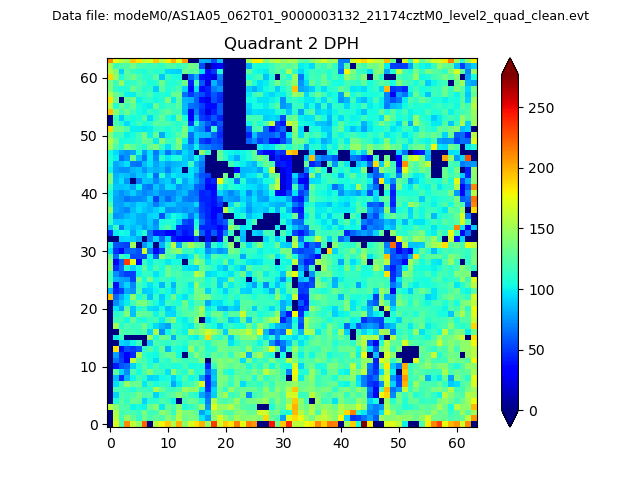 |
Quadrant C |
| Plot type | Count rate plots | Images |
|---|---|---|
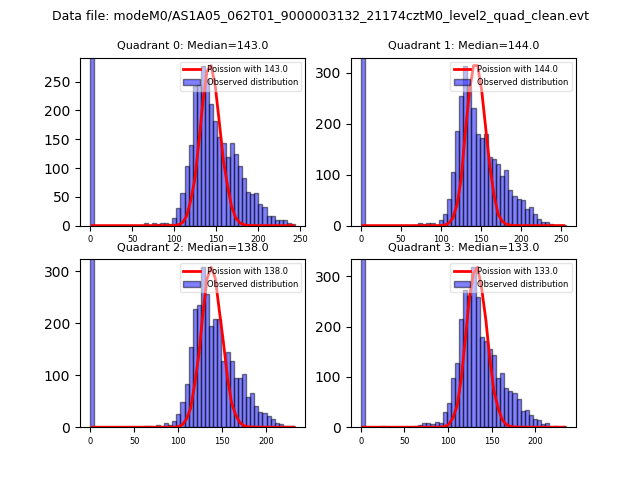
| Comparison with Poisson distribution Blue bars denote a histogram of data divided into 1 sec bins. Red curve is a Poisson curve with rate = median count rate of data. |
 |
 |
| Quadrant-wise count rates Data is divided into 100 sec bins |
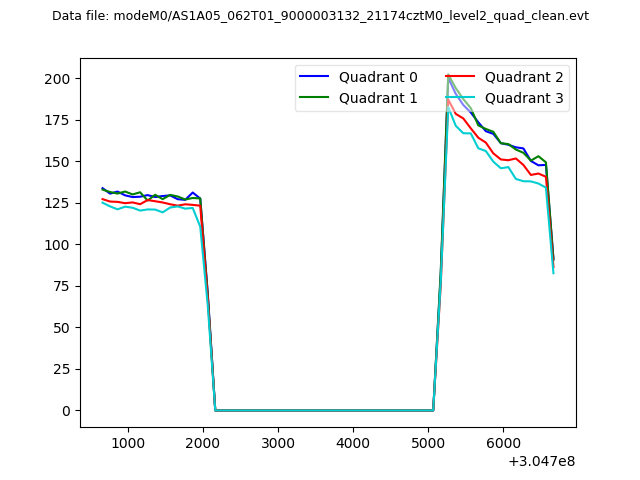 |
|
| Module-wise count rates for Quadrant A Data is divided into 100 sec bins |
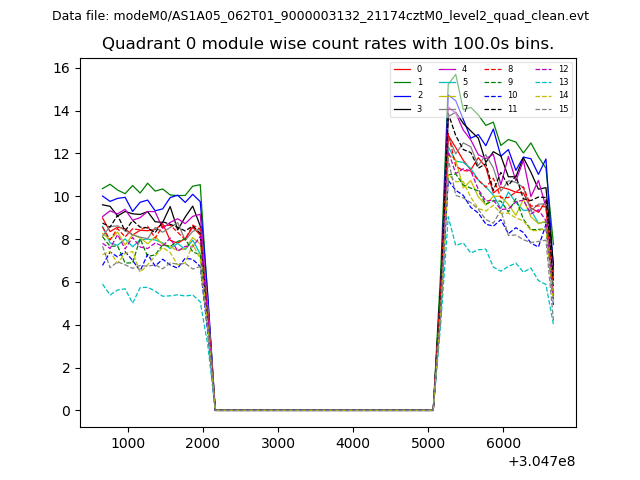 |
 |
| Module-wise count rates for Quadrant B Data is divided into 100 sec bins |
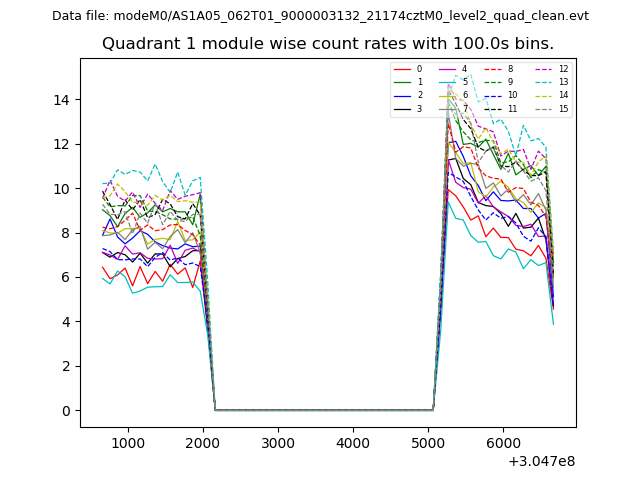 |
 |
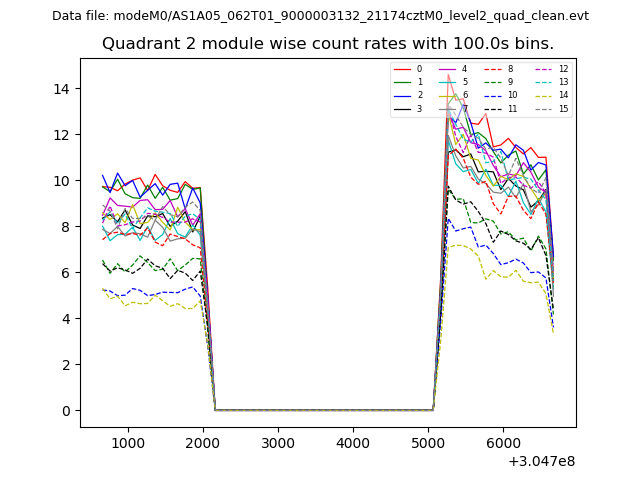
| Module-wise count rates for Quadrant C Data is divided into 100 sec bins |
 |
 |
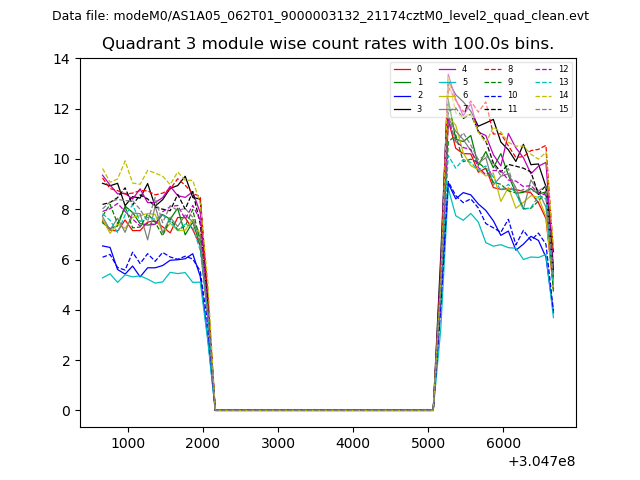
| Module-wise count rates for Quadrant D Data is divided into 100 sec bins |
 |
 |
| Parameter | Plot |
|---|---|
| CZT HV Monitor | 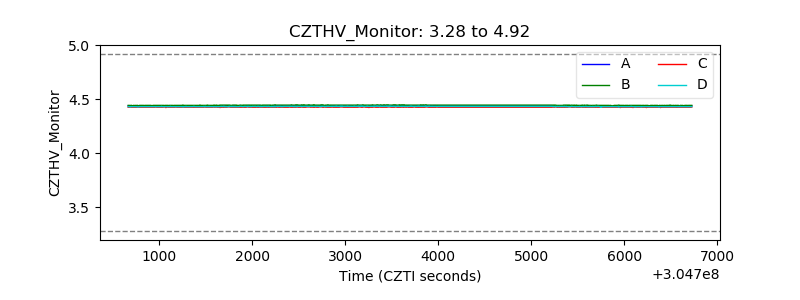 |
| D_VDD | 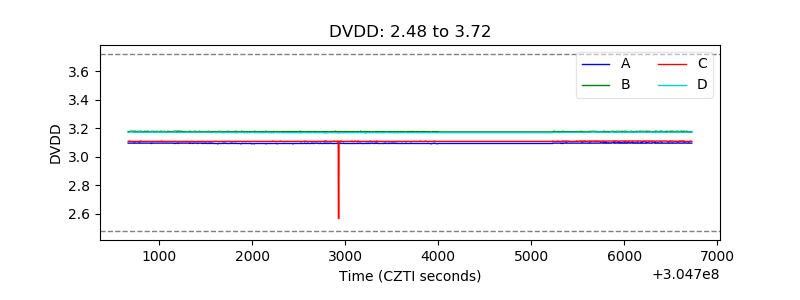 |
| Temperature 1 | 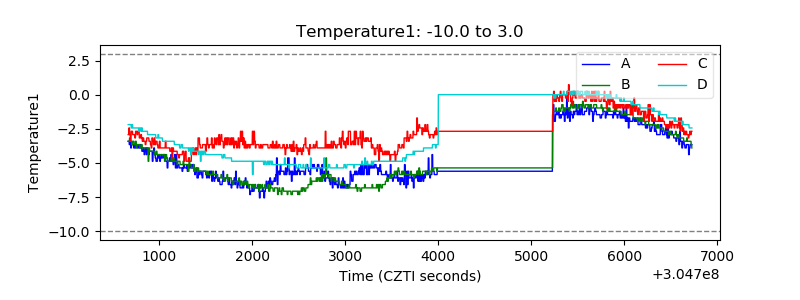 |
| Veto HV Monitor | 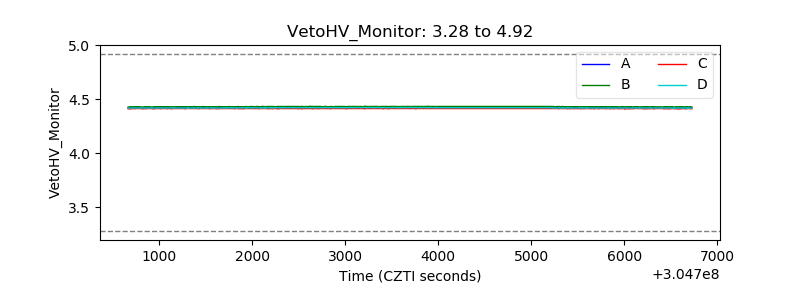 |
| Veto LLD | 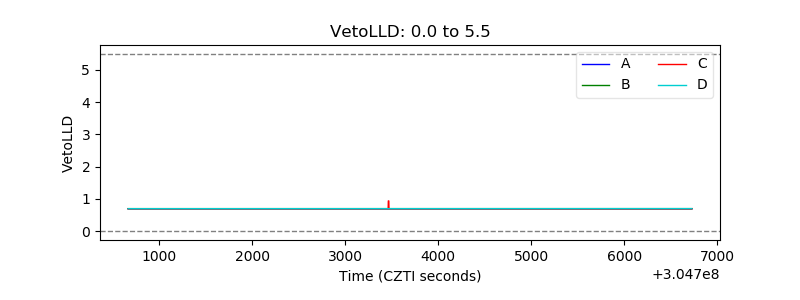 |
| Alpha Counter | 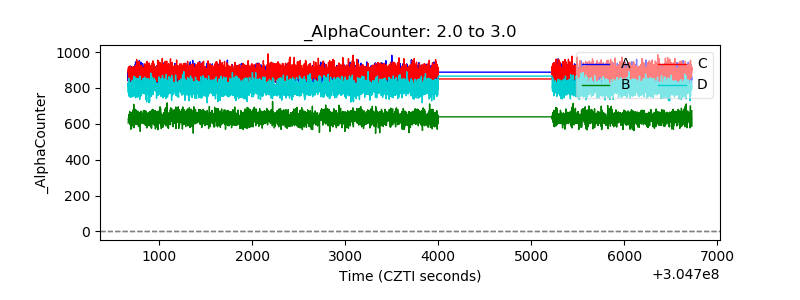 |
| _CPM_Rate | 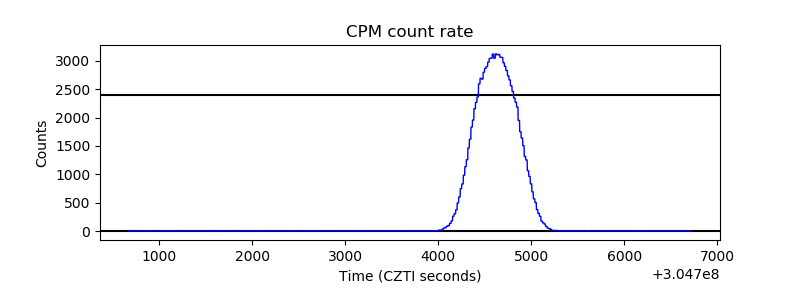 |
| CZT Counter | 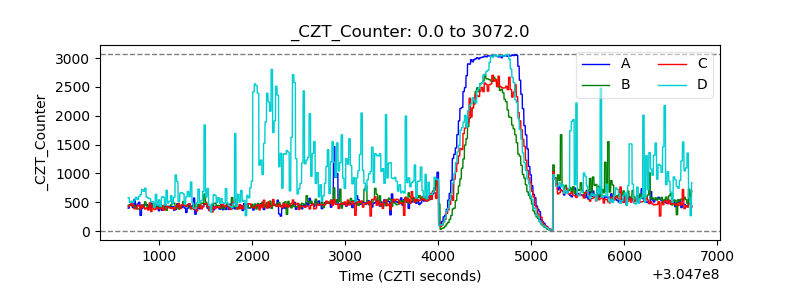 |
| +2.5 Volts monitor |  |
| +5 Volts monitor |  |
| _ROLL_ROT | 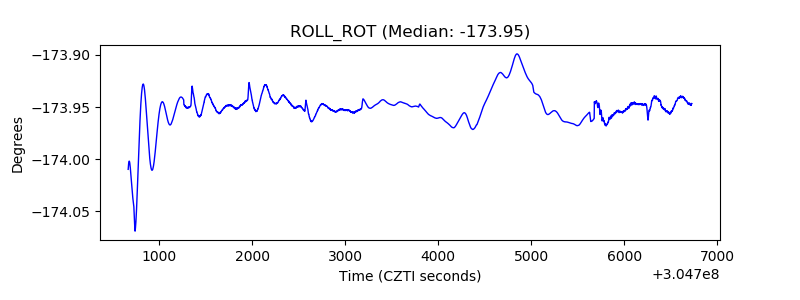 |
| _Roll_DEC | 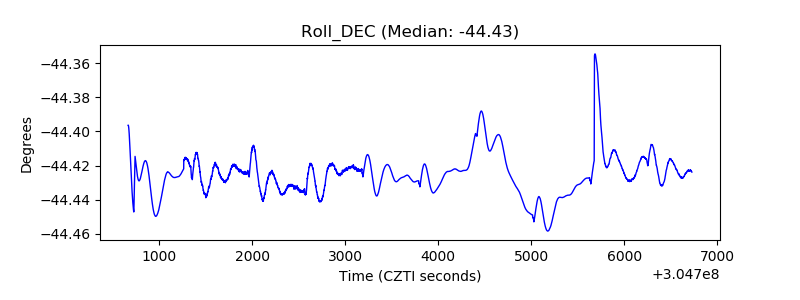 |
| _Roll_RA | 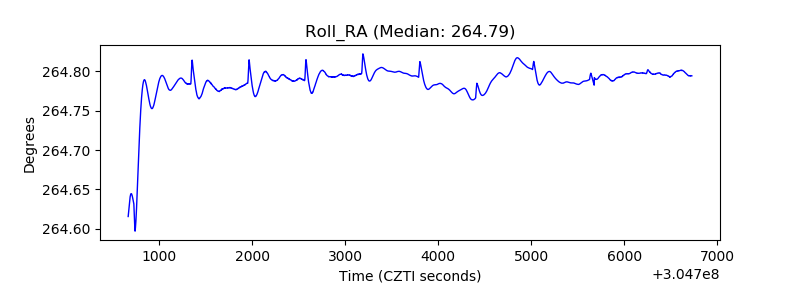 |
| Veto Counter | 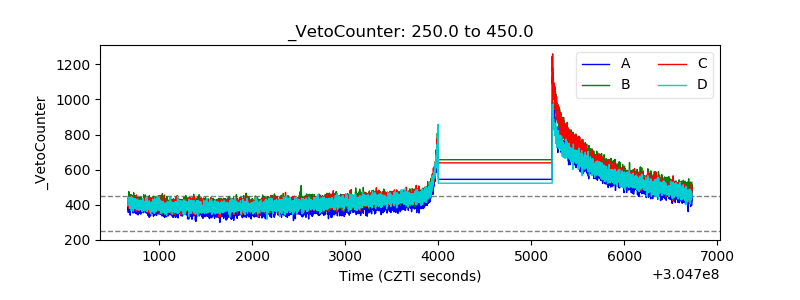 |