| Param | Original file | Final file |
|---|---|---|
| Filename | modeM0/AS1A05_062T01_9000003132_21175cztM0_level2.evt | modeM0/AS1A05_062T01_9000003132_21175cztM0_level2_quad_clean.evt |
| Size (bytes) | 476,890,560 | 97,018,560 |
| Size | 454.8 MB | 92.5 MB |
| Events in quadrant A | 3,160,349 | 648,633 |
| Events in quadrant B | 3,596,297 | 652,731 |
| Events in quadrant C | 3,112,278 | 618,514 |
| Events in quadrant D | 4,156,243 | 588,683 |
| Mode SS | |||
|---|---|---|---|
| Quadrant | BADHDUFLAG | Total packets | Discarded packets |
| A | 0 | 124 | 0 |
| B | 0 | 124 | 0 |
| C | 0 | 124 | 0 |
| D | 0 | 124 | 0 |
| Mode M9 | |||
|---|---|---|---|
| Quadrant | BADHDUFLAG | Total packets | Discarded packets |
| A | 0 | 13 | 0 |
| B | 0 | 13 | 0 |
| C | 0 | 13 | 0 |
| D | 0 | 13 | 0 |
| Mode M0 | |||
|---|---|---|---|
| Quadrant | BADHDUFLAG | Total packets | Discarded packets |
| A | 0 | 13354 | 1 |
| B | 0 | 14656 | 1 |
| C | 0 | 13123 | 1 |
| D | 0 | 16368 | 1 |
| Quadrant | Total seconds | Saturated seconds | Saturation percentage |
|---|---|---|---|
| A | 6156 | 40 | 0.649773% |
| B | 6157 | 103 | 1.672893% |
| C | 6157 | 62 | 1.006984% |
| D | 6157 | 147 | 2.387526% |
Noise dominated data is calculated using 1-second bins in cleaned event files. If a bin has >2000 counts, and if more than 50% of those come from <1% of pixels, then it is considered to be noise-dominated and hence unusable.
| Quadrant | # 1 sec bins | Bins with >0 counts | Bins with >2000 counts | High rate bins dominated by noise | Noise dominated (total time) | Noise dominated (detector-on time) | Marked lightcurve |
|---|---|---|---|---|---|---|---|
| A | 7486 | 6157 | 0 | 0 | 0.00% | 0.00% | 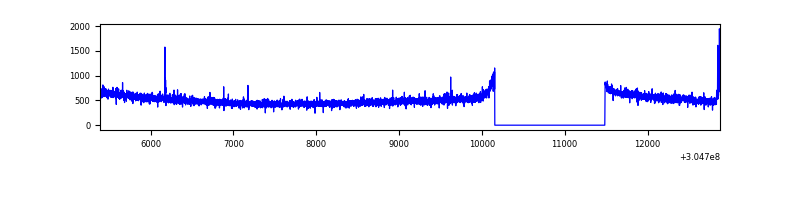 |
| B | 7487 | 6158 | 49 | 49 | 0.65% | 0.80% | 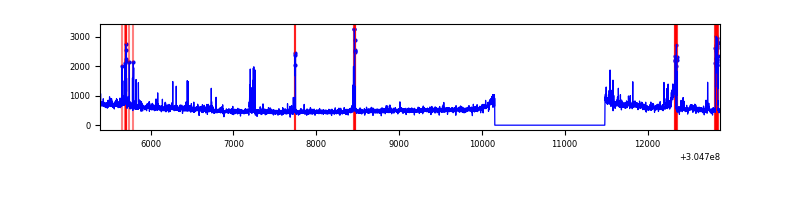 |
| C | 7487 | 6158 | 1 | 1 | 0.01% | 0.02% | 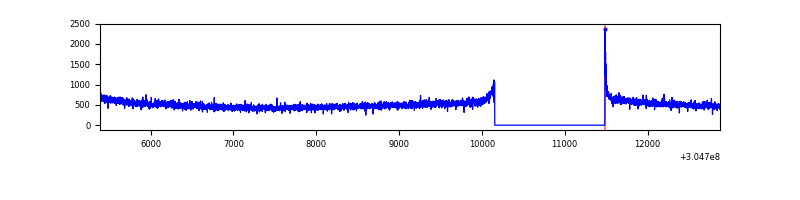 |
| D | 7487 | 6158 | 110 | 110 | 1.47% | 1.79% | 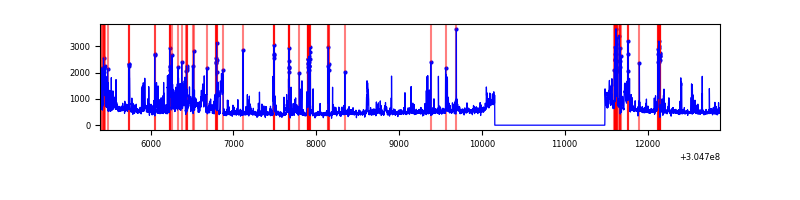 |
Top three noisy pixels from each quadrant. If the there are fewer than three noisy pixels in the level2.evt file, extra rows are filled as -1
| Pixel properties | Quadrant properties | ||||||
|---|---|---|---|---|---|---|---|
| Quadrant | DetID | PixID | Counts | Sigma | Mean | Median | Sigma |
| A | 10 | 229 | 24187 | 144.23 | 810 | 795 | 162.2 |
| A | 8 | 6 | 13123 | 76.01 | 810 | 795 | 162.2 |
| A | 13 | 254 | 9020 | 50.72 | 810 | 795 | 162.2 |
| B | 3 | 64 | 148194 | 974.97 | 806 | 789 | 151.2 |
| B | 0 | 182 | 84585 | 554.25 | 806 | 789 | 151.2 |
| B | 0 | 244 | 39191 | 254.0 | 806 | 789 | 151.2 |
| C | 14 | 238 | 121026 | 683.16 | 758 | 764 | 176.0 |
| C | 3 | 233 | 20257 | 110.73 | 758 | 764 | 176.0 |
| C | 0 | 10 | 9399 | 49.05 | 758 | 764 | 176.0 |
| D | 1 | 20 | 790377 | 4300.56 | 763 | 740 | 183.6 |
| D | 13 | 153 | 165564 | 897.67 | 763 | 740 | 183.6 |
| D | 1 | 52 | 115255 | 623.68 | 763 | 740 | 183.6 |
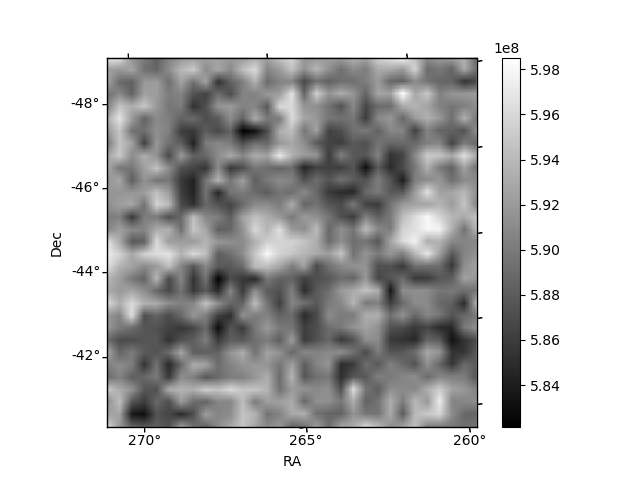
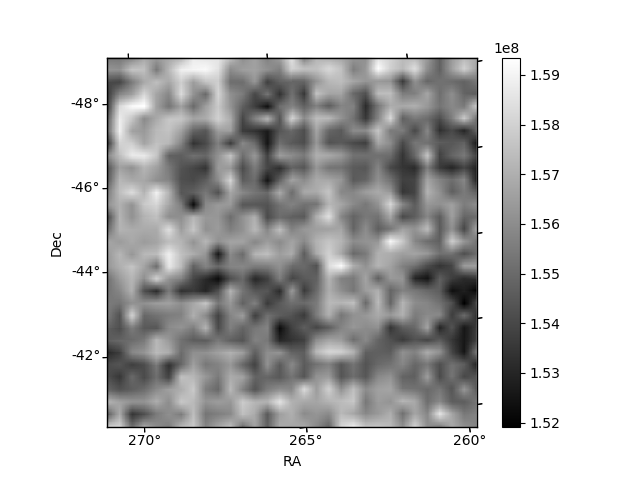
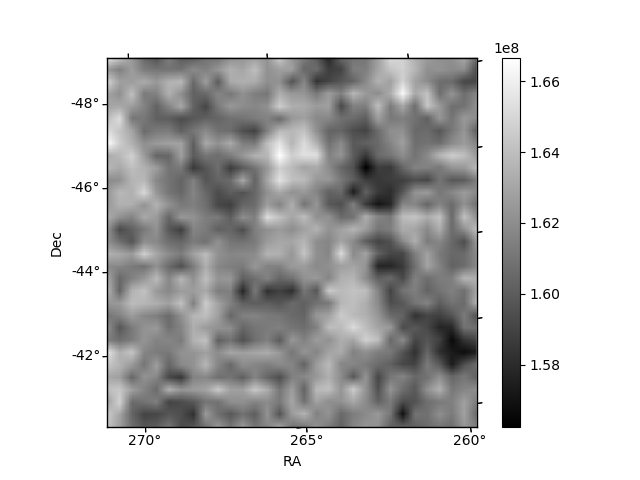
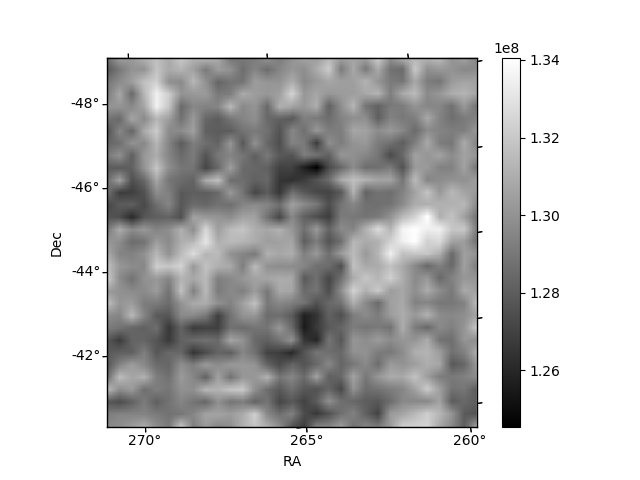
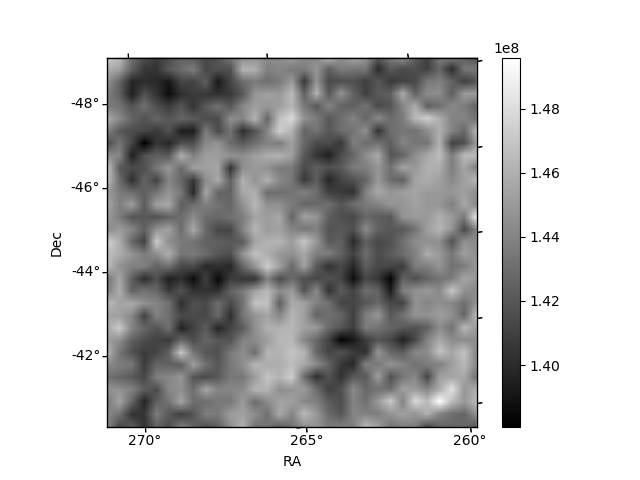
Histogram calculated using DETX and DETY for each event in the final _common_clean file
| Quadrant A | 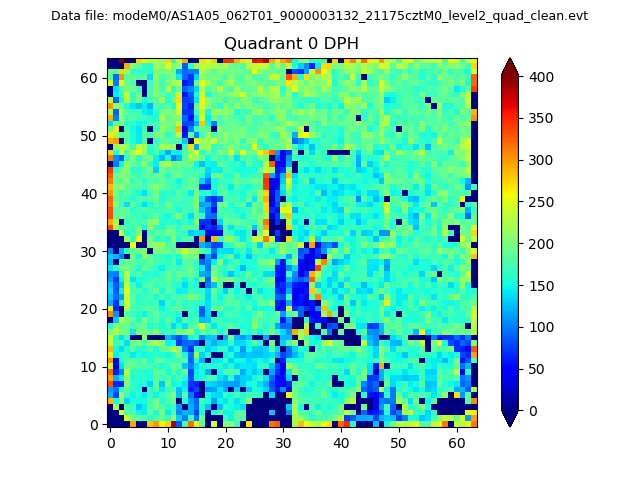 |
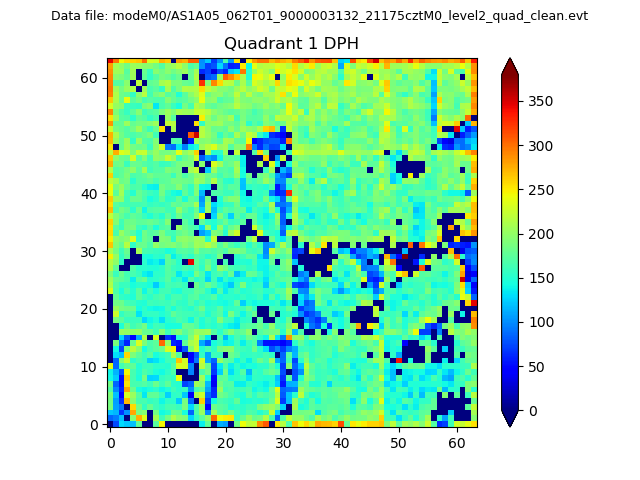 |
Quadrant B |
|---|---|---|---|
| Quadrant D | 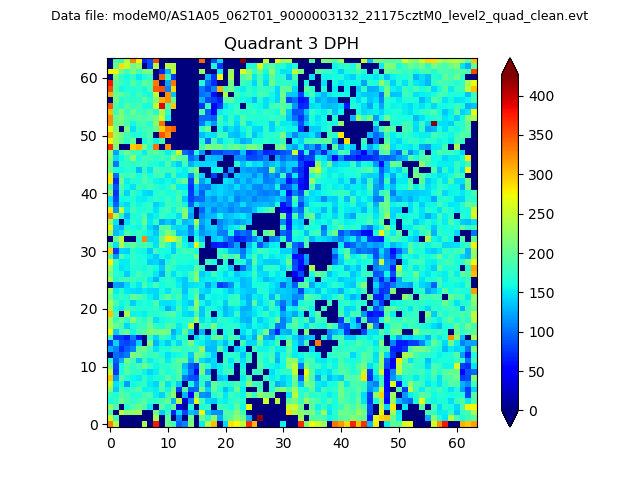 |
 |
Quadrant C |
| Plot type | Count rate plots | Images |
|---|---|---|
| Comparison with Poisson distribution Blue bars denote a histogram of data divided into 1 sec bins. Red curve is a Poisson curve with rate = median count rate of data. |
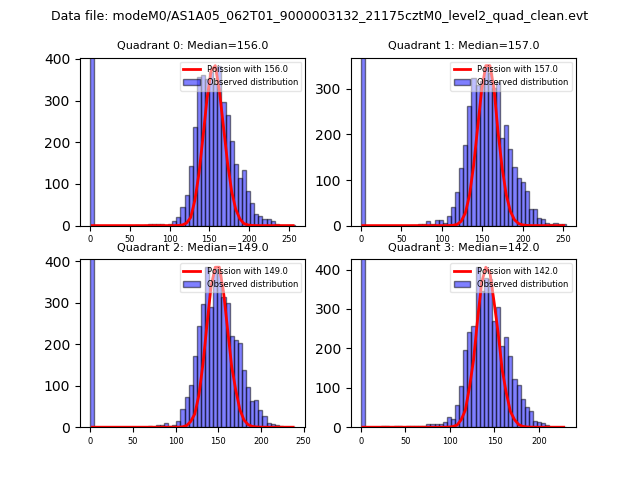 |
 |
| Quadrant-wise count rates Data is divided into 100 sec bins |
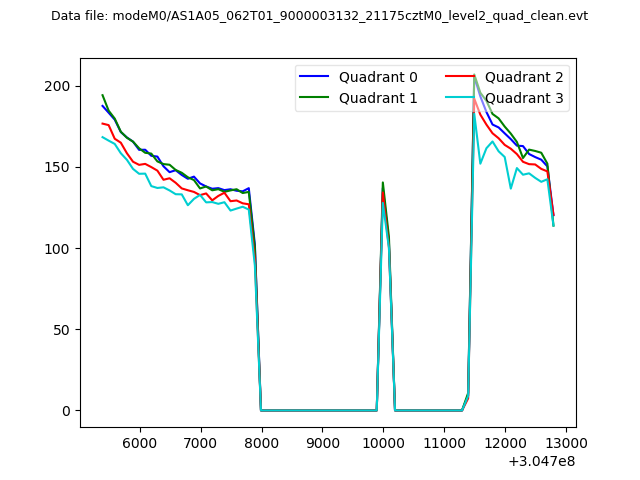 |
|
| Module-wise count rates for Quadrant A Data is divided into 100 sec bins |
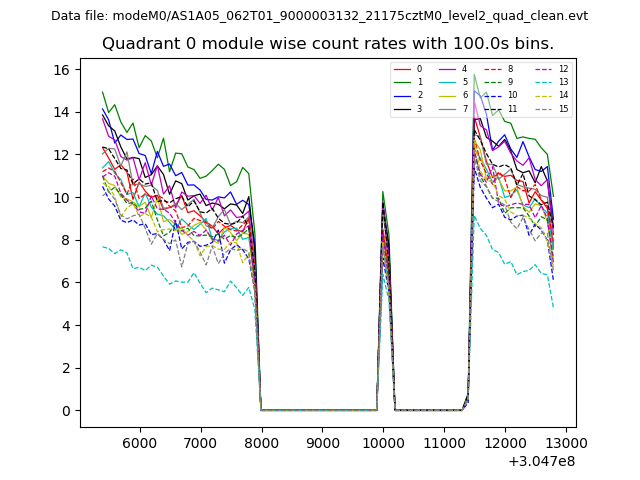 |
 |
| Module-wise count rates for Quadrant B Data is divided into 100 sec bins |
 |
 |
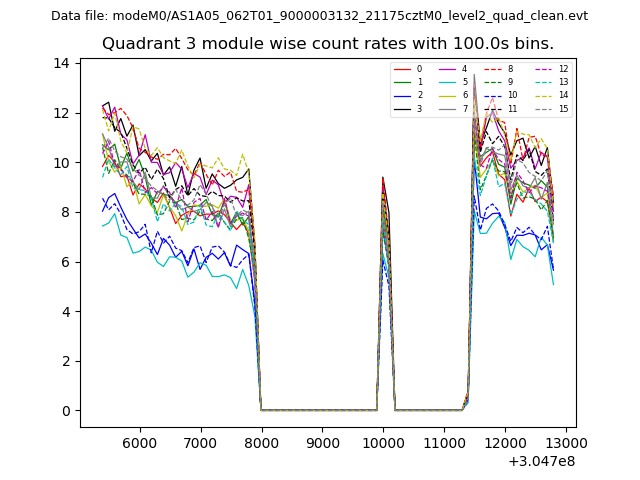
| Module-wise count rates for Quadrant C Data is divided into 100 sec bins |
 |
 |
| Module-wise count rates for Quadrant D Data is divided into 100 sec bins |
 |
 |
| Parameter | Plot |
|---|---|
| CZT HV Monitor | 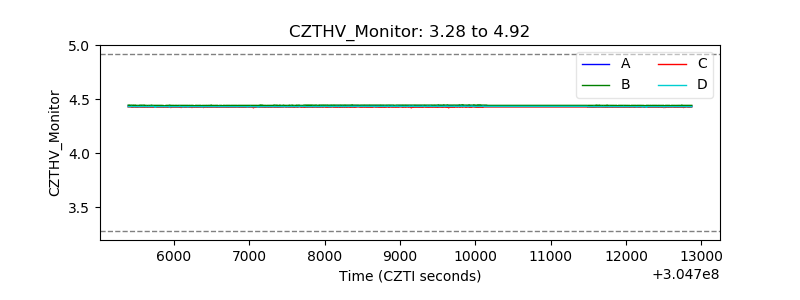 |
| D_VDD | 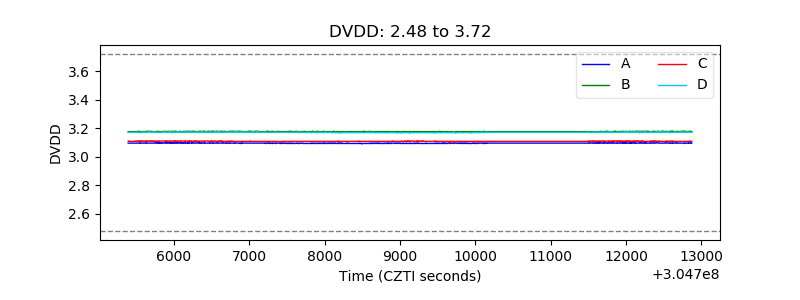 |
| Temperature 1 | 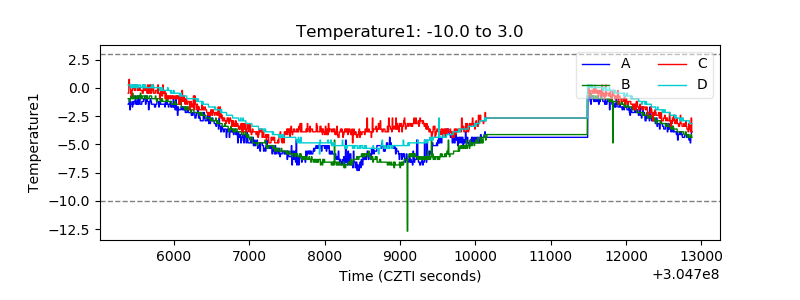 |
| Veto HV Monitor | 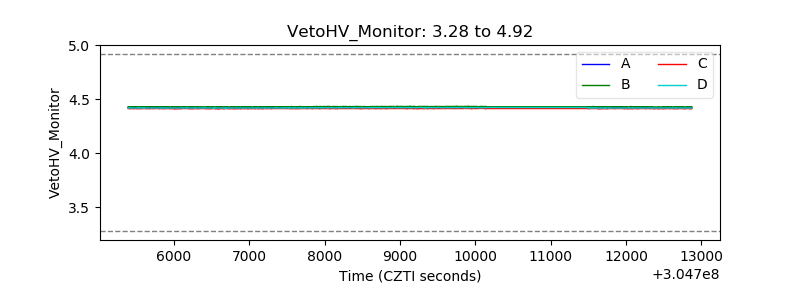 |
| Veto LLD | 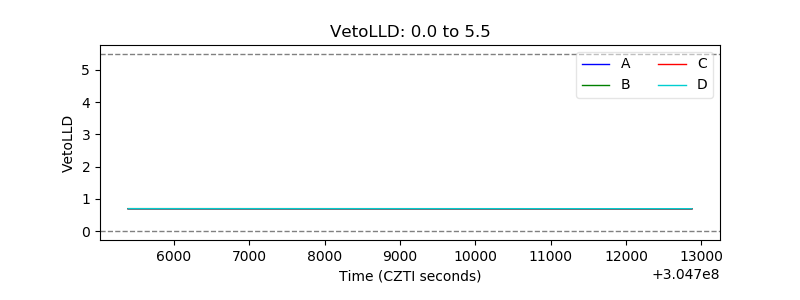 |
| Alpha Counter | 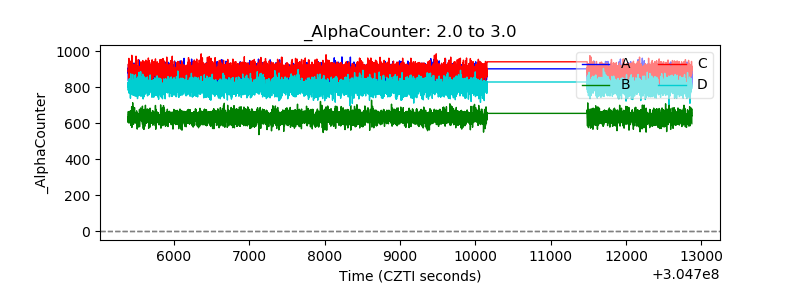 |
| _CPM_Rate | 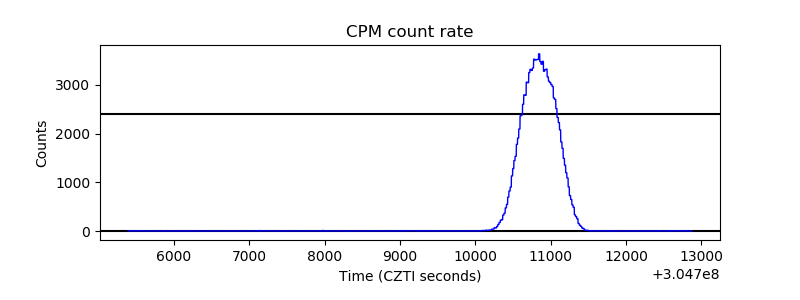 |
| CZT Counter |  |
| +2.5 Volts monitor | 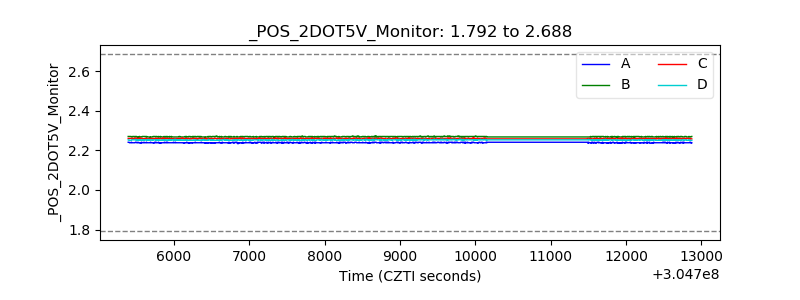 |
| +5 Volts monitor | 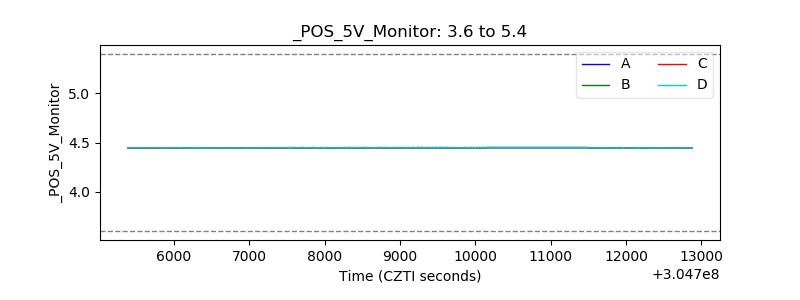 |
| _ROLL_ROT | 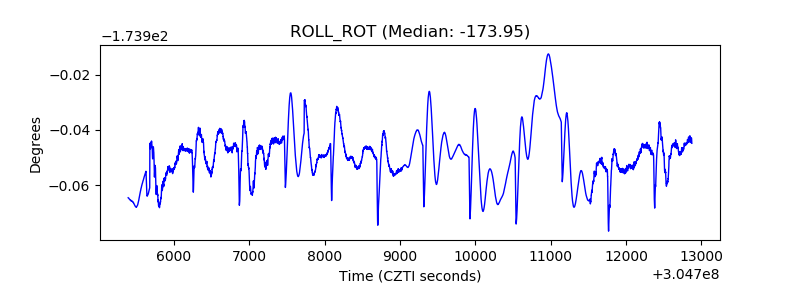 |
| _Roll_DEC | 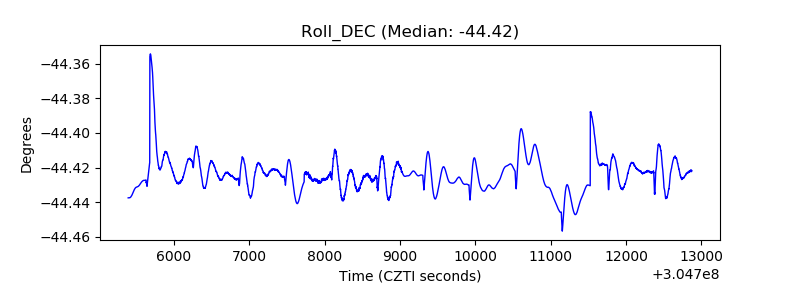 |
| _Roll_RA |  |
| Veto Counter | 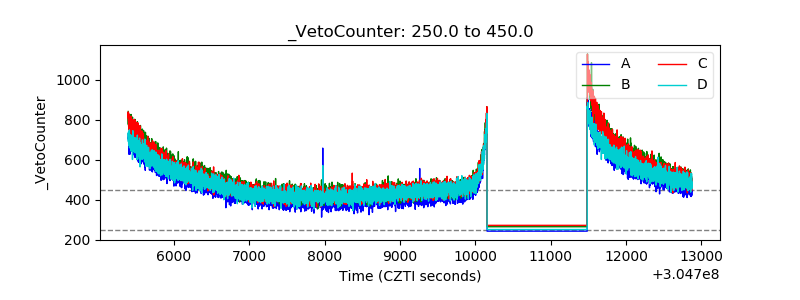 |