| Param | Original file | Final file |
|---|---|---|
| Filename | modeM0/AS1A05_062T01_9000003132_21178cztM0_level2.evt | modeM0/AS1A05_062T01_9000003132_21178cztM0_level2_quad_clean.evt |
| Size (bytes) | 543,375,360 | 90,184,320 |
| Size | 518.2 MB | 86.0 MB |
| Events in quadrant A | 3,063,026 | 583,496 |
| Events in quadrant B | 3,376,148 | 599,939 |
| Events in quadrant C | 3,201,535 | 577,478 |
| Events in quadrant D | 6,382,876 | 524,734 |
| Mode SS | |||
|---|---|---|---|
| Quadrant | BADHDUFLAG | Total packets | Discarded packets |
| A | 0 | 128 | 0 |
| B | 0 | 128 | 0 |
| C | 0 | 128 | 0 |
| D | 0 | 128 | 0 |
| Mode M9 | |||
|---|---|---|---|
| Quadrant | BADHDUFLAG | Total packets | Discarded packets |
| A | 0 | 20 | 0 |
| B | 0 | 21 | 0 |
| C | 0 | 21 | 0 |
| D | 0 | 21 | 0 |
| Mode M0 | |||
|---|---|---|---|
| Quadrant | BADHDUFLAG | Total packets | Discarded packets |
| A | 0 | 13292 | 2 |
| B | 0 | 14103 | 2 |
| C | 0 | 13468 | 2 |
| D | 0 | 23309 | 2 |
| Quadrant | Total seconds | Saturated seconds | Saturation percentage |
|---|---|---|---|
| A | 6388 | 21 | 0.328741% |
| B | 6388 | 54 | 0.845335% |
| C | 6388 | 69 | 1.080150% |
| D | 6387 | 540 | 8.454674% |
Noise dominated data is calculated using 1-second bins in cleaned event files. If a bin has >2000 counts, and if more than 50% of those come from <1% of pixels, then it is considered to be noise-dominated and hence unusable.
| Quadrant | # 1 sec bins | Bins with >0 counts | Bins with >2000 counts | High rate bins dominated by noise | Noise dominated (total time) | Noise dominated (detector-on time) | Marked lightcurve |
|---|---|---|---|---|---|---|---|
| A | 7558 | 6389 | 1 | 1 | 0.01% | 0.02% | 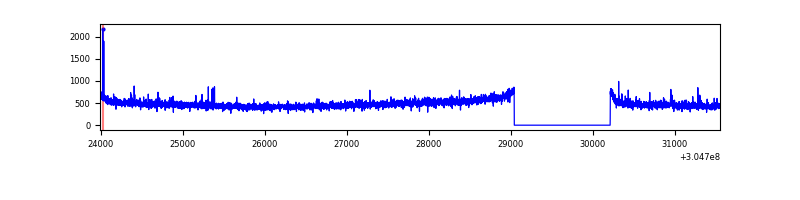 |
| B | 7558 | 6389 | 13 | 13 | 0.17% | 0.20% | 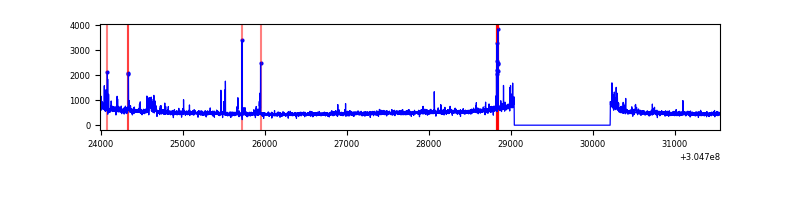 |
| C | 7558 | 6389 | 9 | 9 | 0.12% | 0.14% | 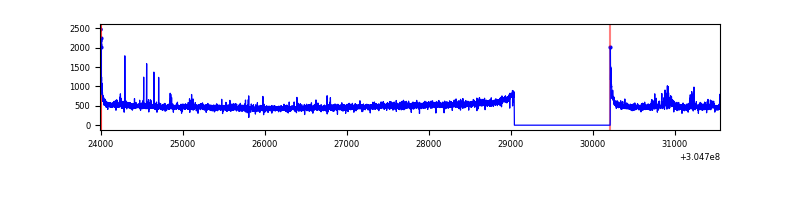 |
| D | 7557 | 6388 | 530 | 530 | 7.01% | 8.30% | 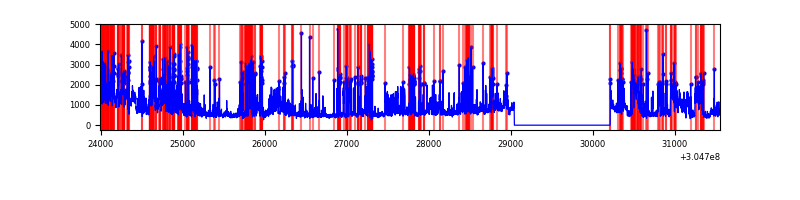 |
Top three noisy pixels from each quadrant. If the there are fewer than three noisy pixels in the level2.evt file, extra rows are filled as -1
| Pixel properties | Quadrant properties | ||||||
|---|---|---|---|---|---|---|---|
| Quadrant | DetID | PixID | Counts | Sigma | Mean | Median | Sigma |
| A | 5 | 16 | 12388 | 73.83 | 789 | 773 | 157.3 |
| A | 13 | 254 | 10127 | 59.46 | 789 | 773 | 157.3 |
| A | 0 | 226 | 6954 | 39.29 | 789 | 773 | 157.3 |
| B | 0 | 182 | 80429 | 530.74 | 794 | 777 | 150.1 |
| B | 0 | 190 | 41065 | 268.45 | 794 | 777 | 150.1 |
| B | 15 | 35 | 31107 | 202.09 | 794 | 777 | 150.1 |
| C | 14 | 238 | 121041 | 682.42 | 758 | 763 | 176.3 |
| C | 3 | 233 | 86230 | 484.91 | 758 | 763 | 176.3 |
| C | 0 | 10 | 41644 | 231.95 | 758 | 763 | 176.3 |
| D | 1 | 52 | 1922314 | 10793.46 | 735 | 715 | 178.0 |
| D | 7 | 238 | 744268 | 4176.48 | 735 | 715 | 178.0 |
| D | 1 | 20 | 377932 | 2118.8 | 735 | 715 | 178.0 |
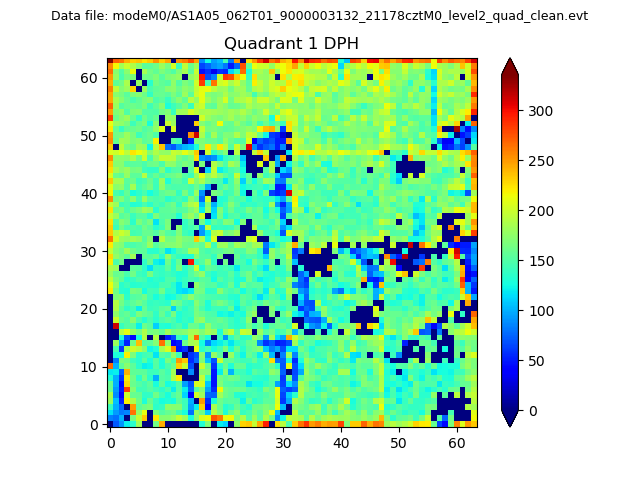
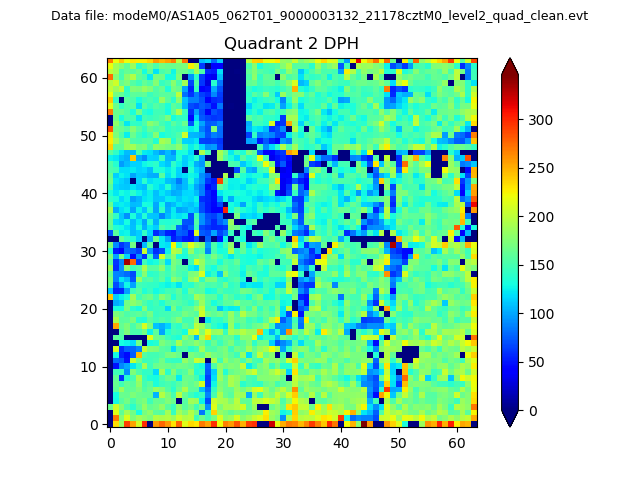
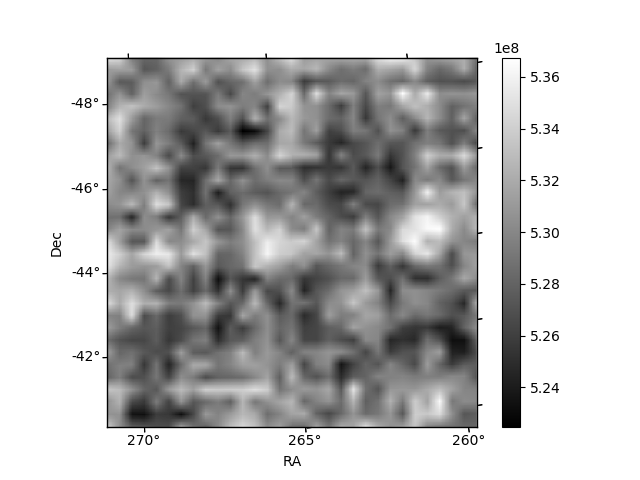
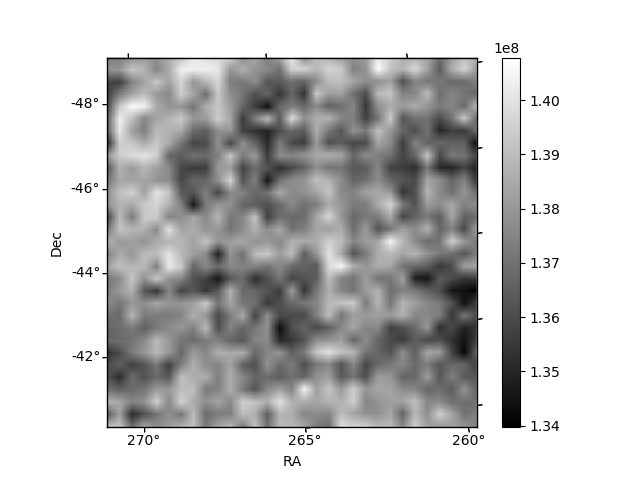
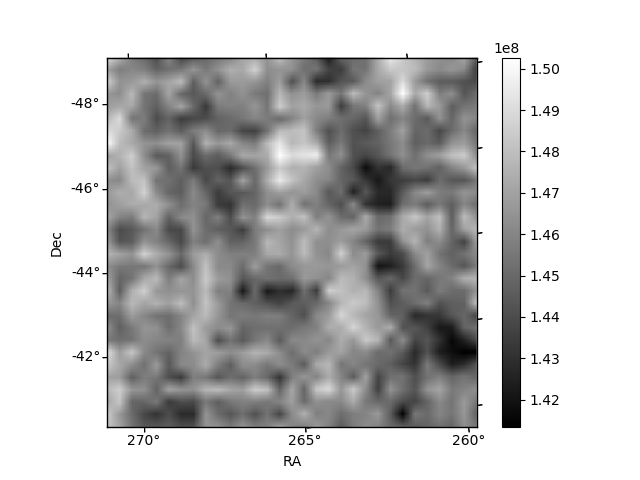
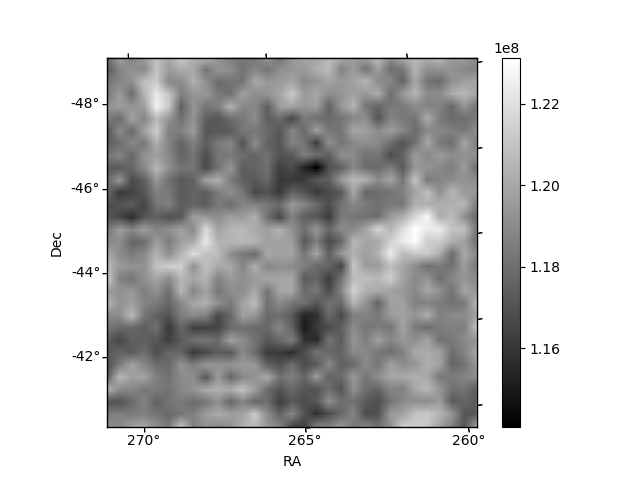
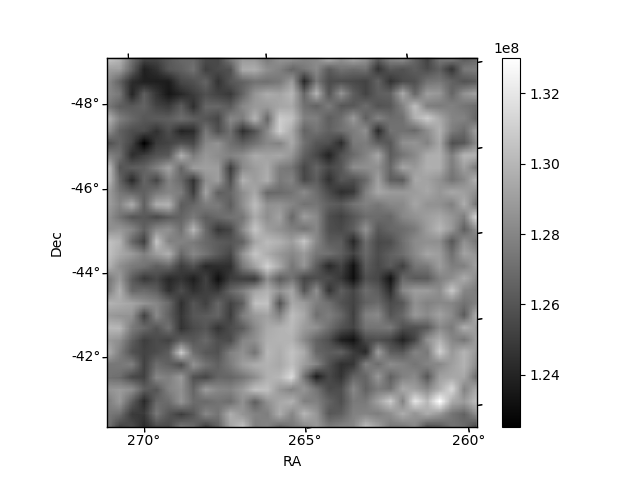
Histogram calculated using DETX and DETY for each event in the final _common_clean file
| Quadrant A |  |
 |
Quadrant B |
|---|---|---|---|
| Quadrant D | 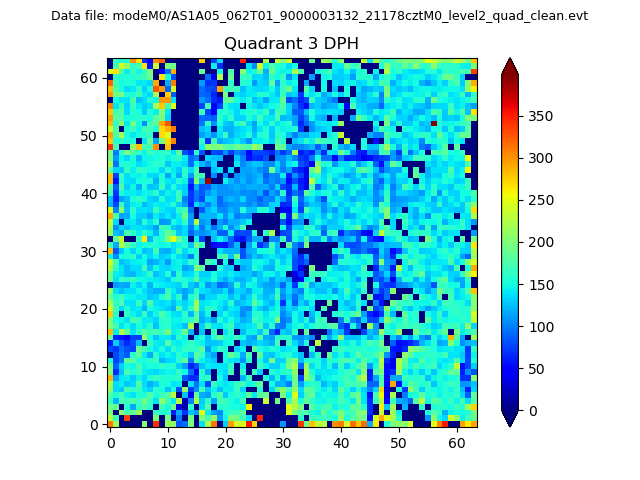 |
 |
Quadrant C |
| Plot type | Count rate plots | Images |
|---|---|---|
| Comparison with Poisson distribution Blue bars denote a histogram of data divided into 1 sec bins. Red curve is a Poisson curve with rate = median count rate of data. |
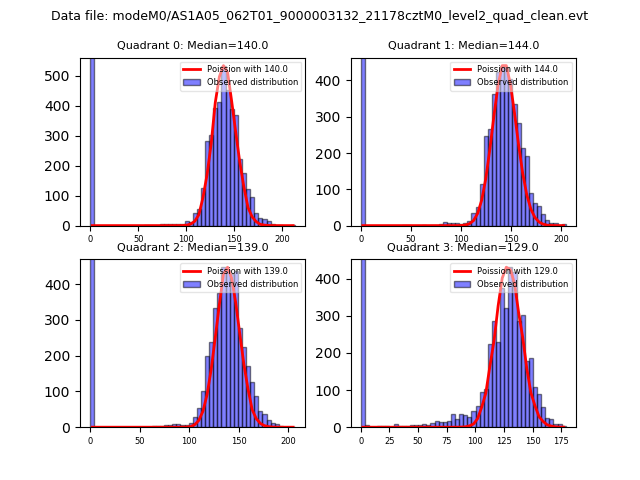 |
 |
| Quadrant-wise count rates Data is divided into 100 sec bins |
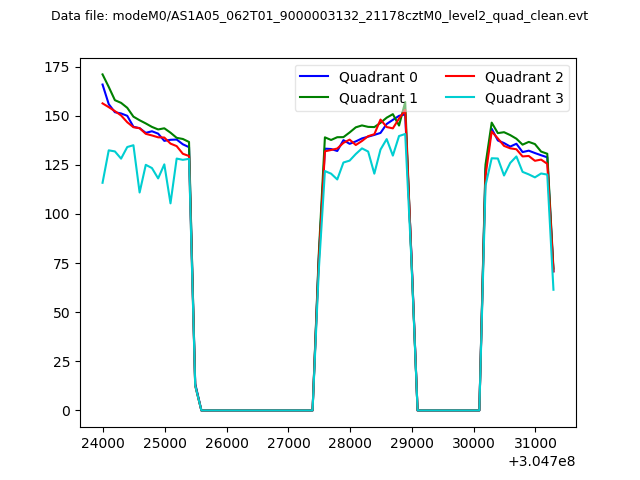 |
|
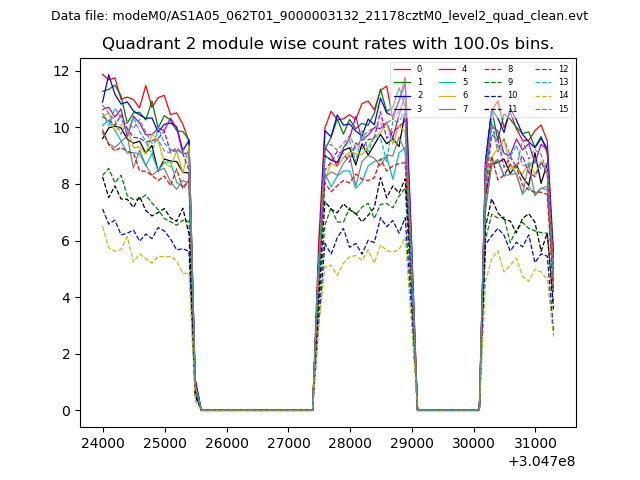
| Module-wise count rates for Quadrant A Data is divided into 100 sec bins |
 |
 |
| Module-wise count rates for Quadrant B Data is divided into 100 sec bins |
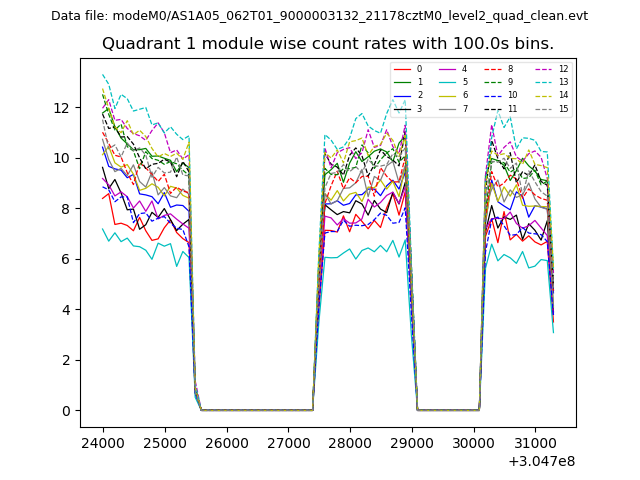 |
 |
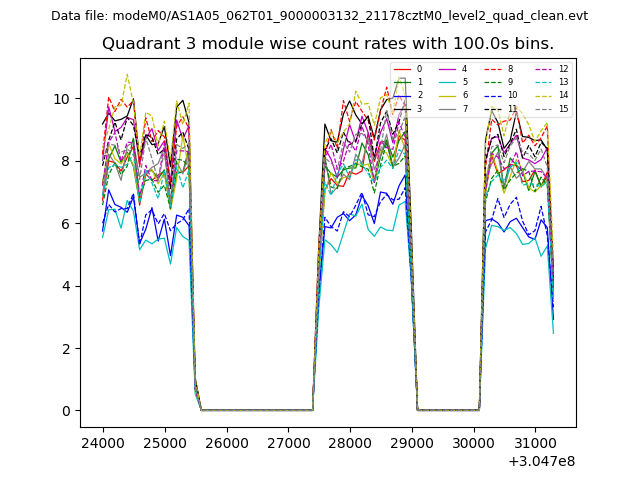
| Module-wise count rates for Quadrant C Data is divided into 100 sec bins |
 |
 |
| Module-wise count rates for Quadrant D Data is divided into 100 sec bins |
 |
 |
| Parameter | Plot |
|---|---|
| CZT HV Monitor | 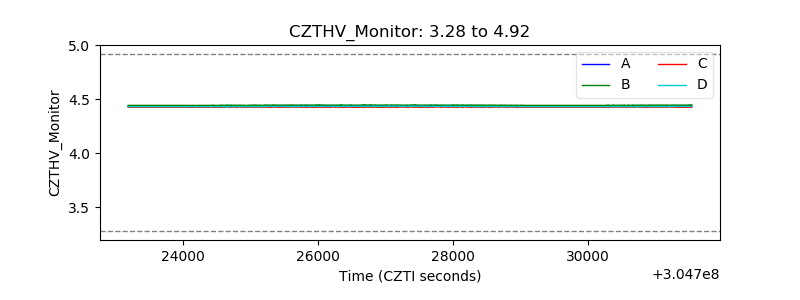 |
| D_VDD | 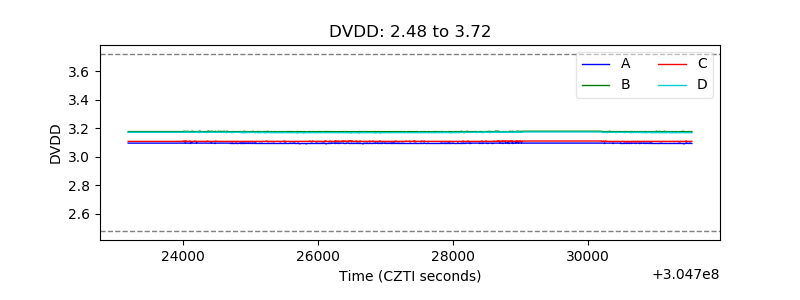 |
| Temperature 1 | 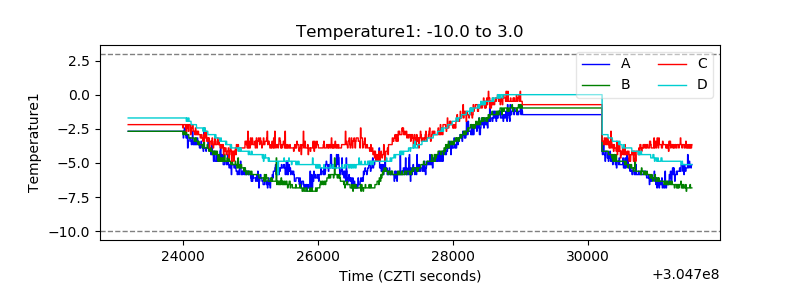 |
| Veto HV Monitor | 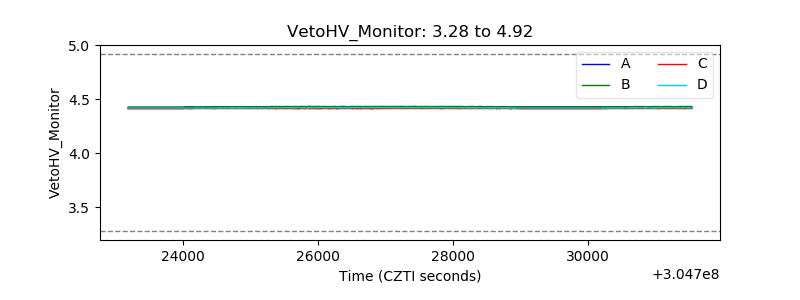 |
| Veto LLD | 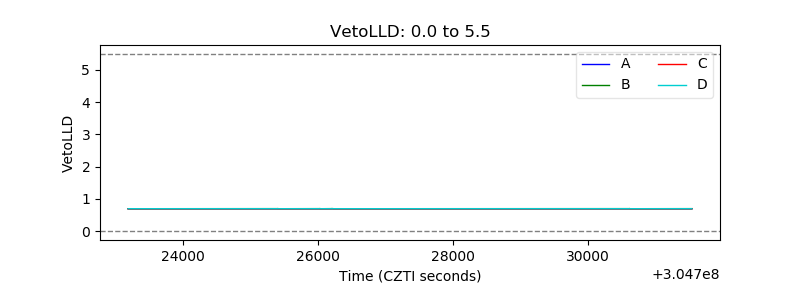 |
| Alpha Counter | 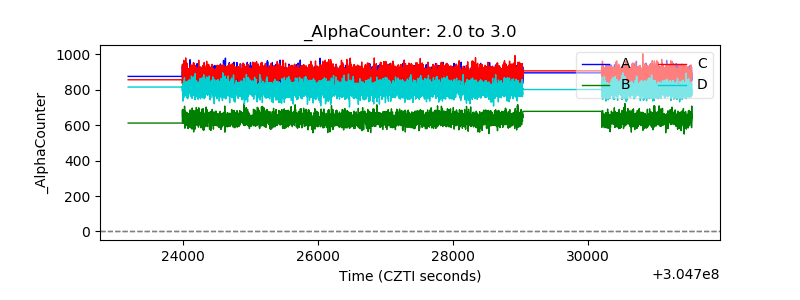 |
| _CPM_Rate | 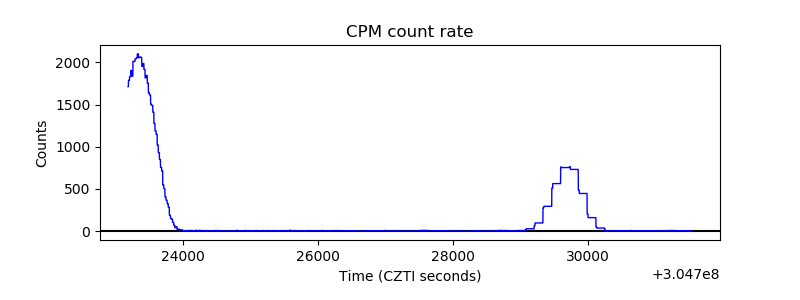 |
| CZT Counter | 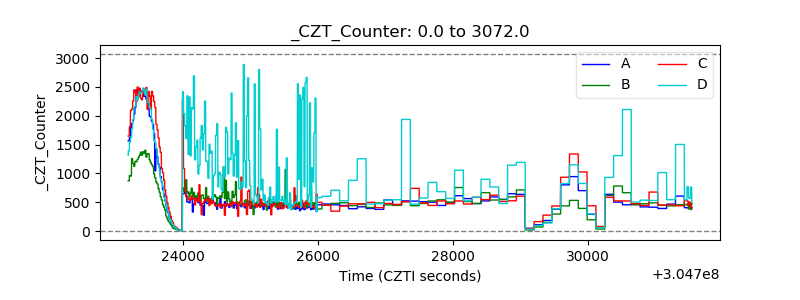 |
| +2.5 Volts monitor |  |
| +5 Volts monitor | 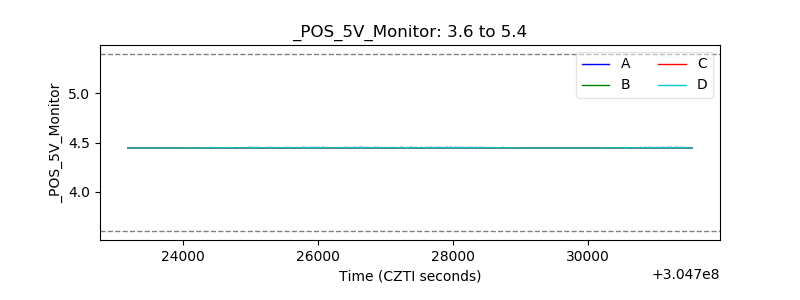 |
| _ROLL_ROT | 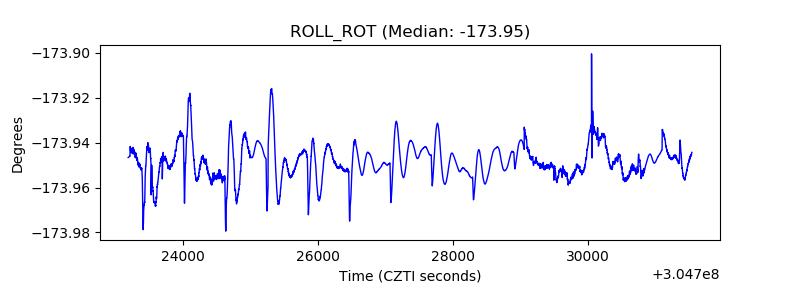 |
| _Roll_DEC | 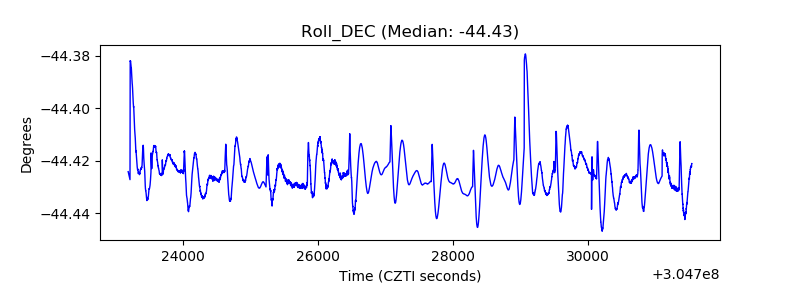 |
| _Roll_RA | 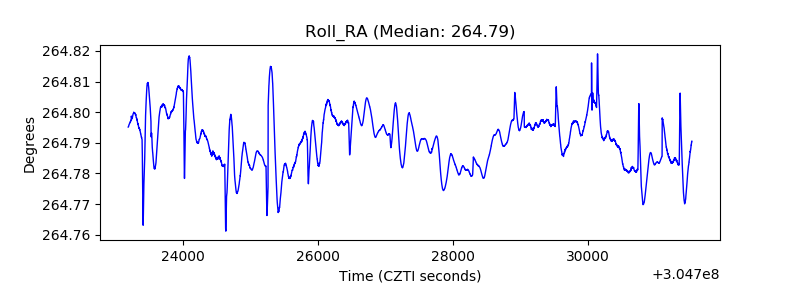 |
| Veto Counter | 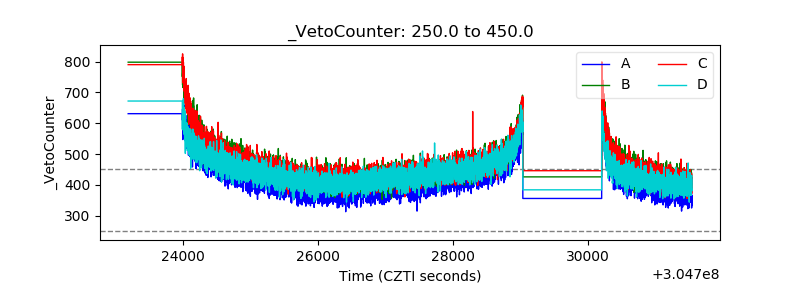 |