| Param | Original file | Final file |
|---|---|---|
| Filename | modeM0/AS1A05_062T01_9000003132_21179cztM0_level2.evt | modeM0/AS1A05_062T01_9000003132_21179cztM0_level2_quad_clean.evt |
| Size (bytes) | 540,397,440 | 91,319,040 |
| Size | 515.4 MB | 87.1 MB |
| Events in quadrant A | 3,547,590 | 574,926 |
| Events in quadrant B | 3,612,344 | 591,072 |
| Events in quadrant C | 3,410,993 | 574,213 |
| Events in quadrant D | 5,323,308 | 540,453 |
| Mode SS | |||
|---|---|---|---|
| Quadrant | BADHDUFLAG | Total packets | Discarded packets |
| A | 0 | 144 | 0 |
| B | 0 | 144 | 0 |
| C | 0 | 144 | 0 |
| D | 0 | 144 | 0 |
| Mode M9 | |||
|---|---|---|---|
| Quadrant | BADHDUFLAG | Total packets | Discarded packets |
| A | 0 | 20 | 0 |
| B | 0 | 20 | 0 |
| C | 0 | 20 | 0 |
| D | 0 | 20 | 0 |
| Mode M0 | |||
|---|---|---|---|
| Quadrant | BADHDUFLAG | Total packets | Discarded packets |
| A | 0 | 15220 | 2 |
| B | 0 | 15158 | 2 |
| C | 0 | 14515 | 2 |
| D | 0 | 20451 | 2 |
| Quadrant | Total seconds | Saturated seconds | Saturation percentage |
|---|---|---|---|
| A | 6955 | 149 | 2.142344% |
| B | 6955 | 80 | 1.150252% |
| C | 6955 | 76 | 1.092739% |
| D | 6955 | 253 | 3.637671% |
Noise dominated data is calculated using 1-second bins in cleaned event files. If a bin has >2000 counts, and if more than 50% of those come from <1% of pixels, then it is considered to be noise-dominated and hence unusable.
| Quadrant | # 1 sec bins | Bins with >0 counts | Bins with >2000 counts | High rate bins dominated by noise | Noise dominated (total time) | Noise dominated (detector-on time) | Marked lightcurve |
|---|---|---|---|---|---|---|---|
| A | 8910 | 6957 | 65 | 65 | 0.73% | 0.93% | 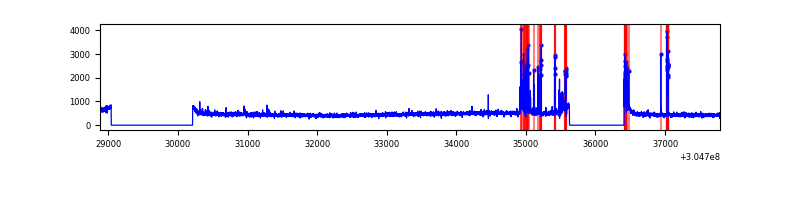 |
| B | 8910 | 6957 | 1 | 1 | 0.01% | 0.01% | 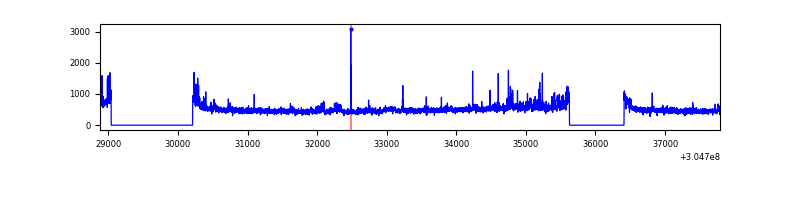 |
| C | 8910 | 6957 | 1 | 1 | 0.01% | 0.01% | 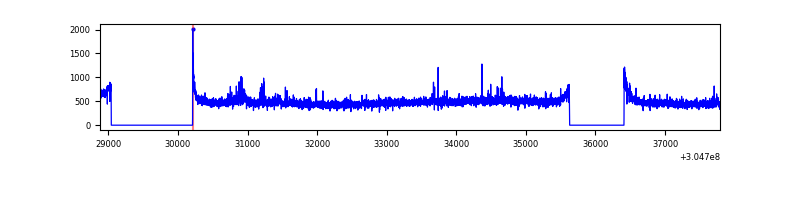 |
| D | 8910 | 6957 | 228 | 228 | 2.56% | 3.28% | 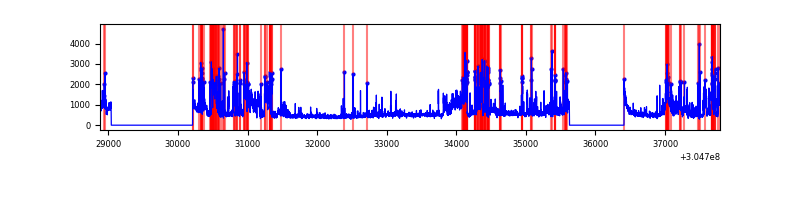 |
Top three noisy pixels from each quadrant. If the there are fewer than three noisy pixels in the level2.evt file, extra rows are filled as -1
| Pixel properties | Quadrant properties | ||||||
|---|---|---|---|---|---|---|---|
| Quadrant | DetID | PixID | Counts | Sigma | Mean | Median | Sigma |
| A | 5 | 16 | 309474 | 1819.73 | 837 | 820 | 169.6 |
| A | 13 | 254 | 11635 | 63.76 | 837 | 820 | 169.6 |
| A | 0 | 226 | 7336 | 38.42 | 837 | 820 | 169.6 |
| B | 0 | 182 | 79328 | 482.96 | 849 | 831 | 162.5 |
| B | 0 | 230 | 42792 | 258.17 | 849 | 831 | 162.5 |
| B | 0 | 190 | 42630 | 257.17 | 849 | 831 | 162.5 |
| C | 14 | 238 | 126825 | 670.06 | 812 | 815 | 188.1 |
| C | 3 | 233 | 99156 | 522.93 | 812 | 815 | 188.1 |
| C | 0 | 10 | 13894 | 69.55 | 812 | 815 | 188.1 |
| D | 1 | 52 | 518301 | 2643.2 | 807 | 784 | 195.8 |
| D | 1 | 20 | 455629 | 2323.11 | 807 | 784 | 195.8 |
| D | 7 | 238 | 339226 | 1728.58 | 807 | 784 | 195.8 |
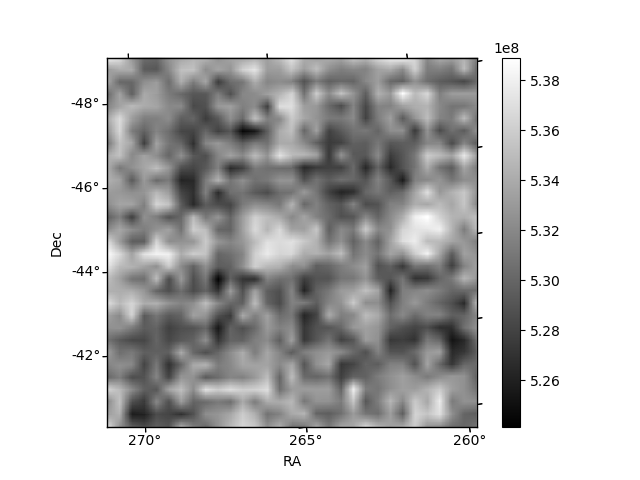
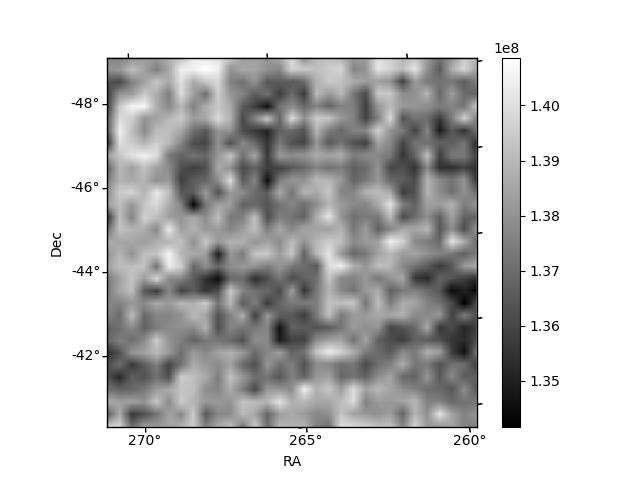
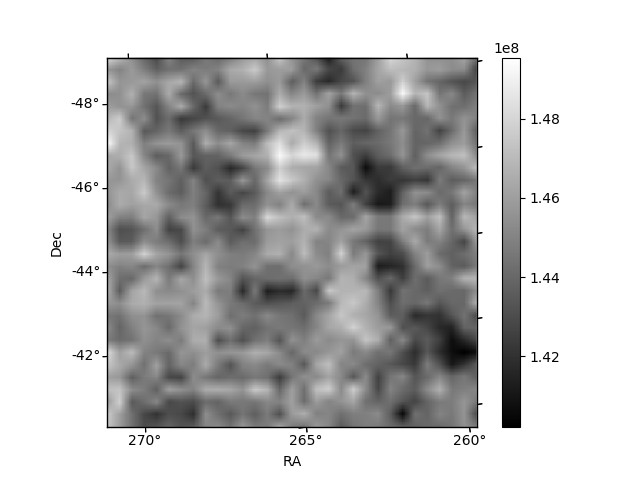
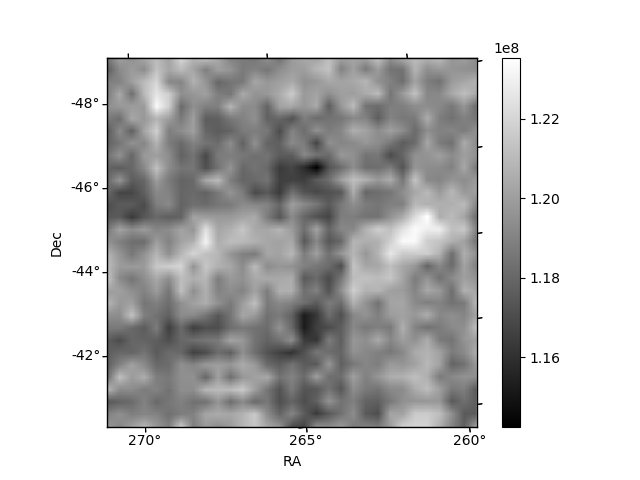
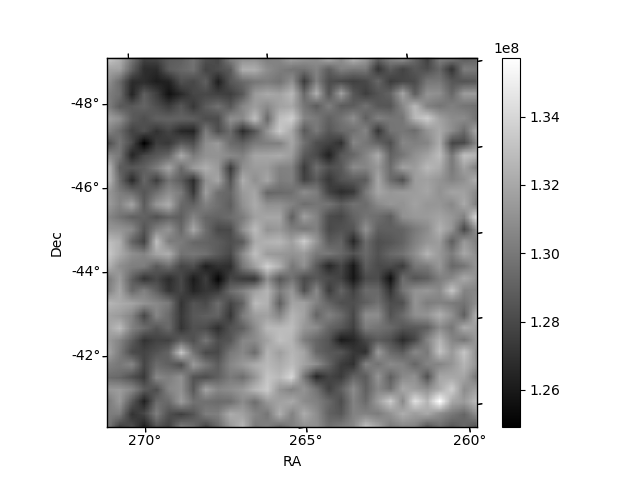
Histogram calculated using DETX and DETY for each event in the final _common_clean file
| Quadrant A | 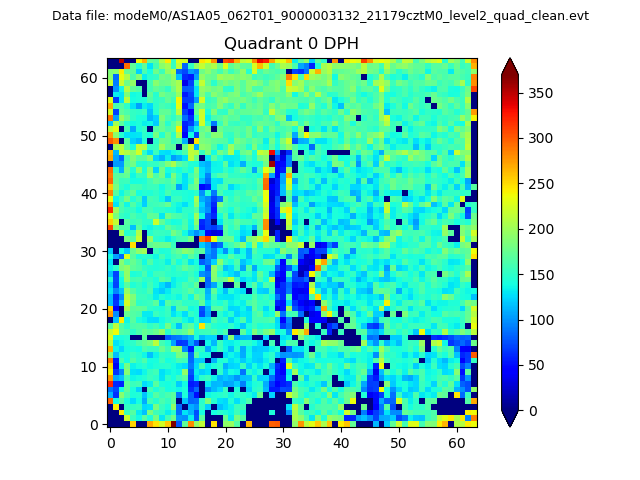 |
 |
Quadrant B |
|---|---|---|---|
| Quadrant D | 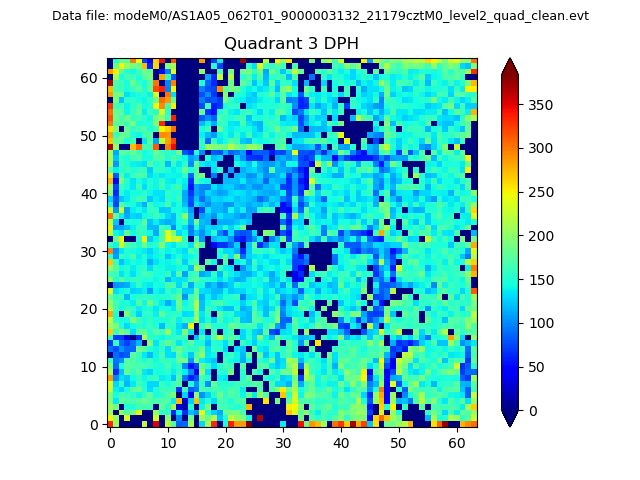 |
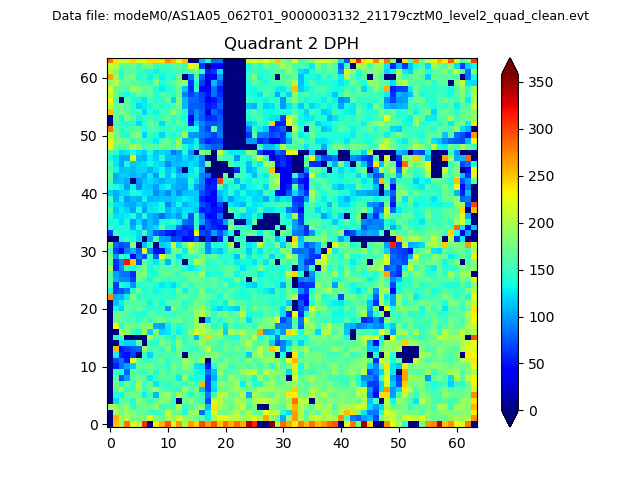 |
Quadrant C |
| Plot type | Count rate plots | Images |
|---|---|---|
| Comparison with Poisson distribution Blue bars denote a histogram of data divided into 1 sec bins. Red curve is a Poisson curve with rate = median count rate of data. |
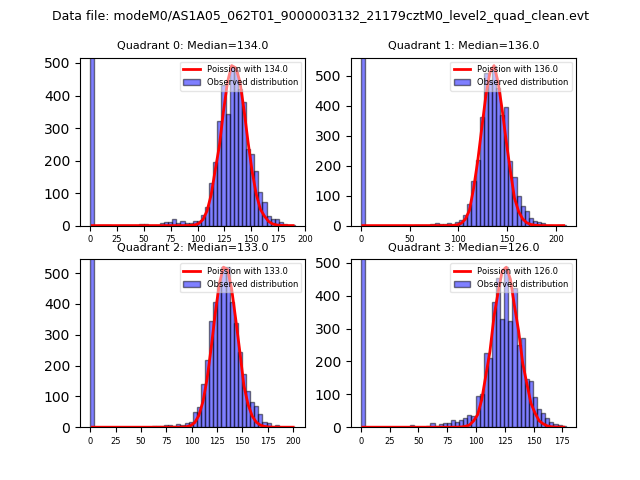 |
 |
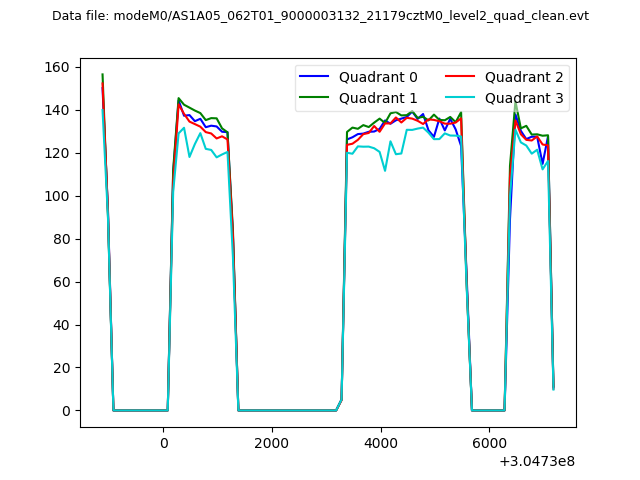
| Quadrant-wise count rates Data is divided into 100 sec bins |
 |
|
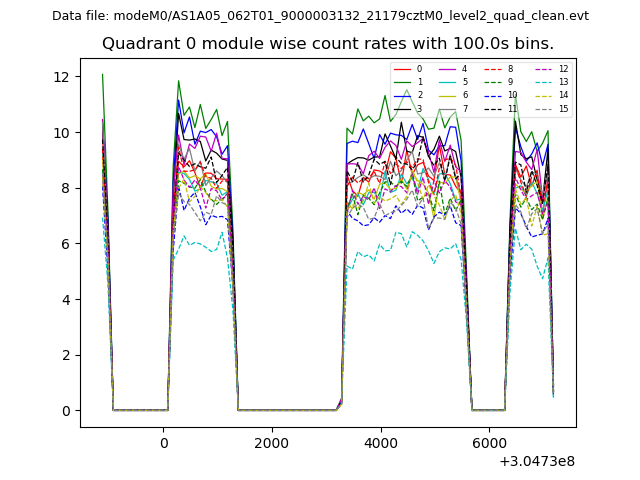
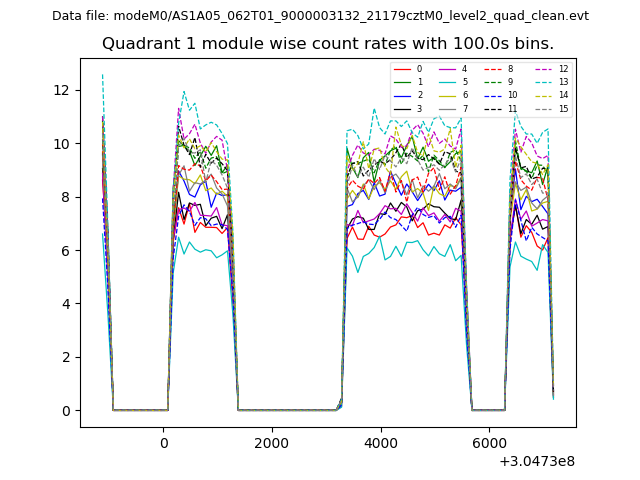
| Module-wise count rates for Quadrant A Data is divided into 100 sec bins |
 |
 |
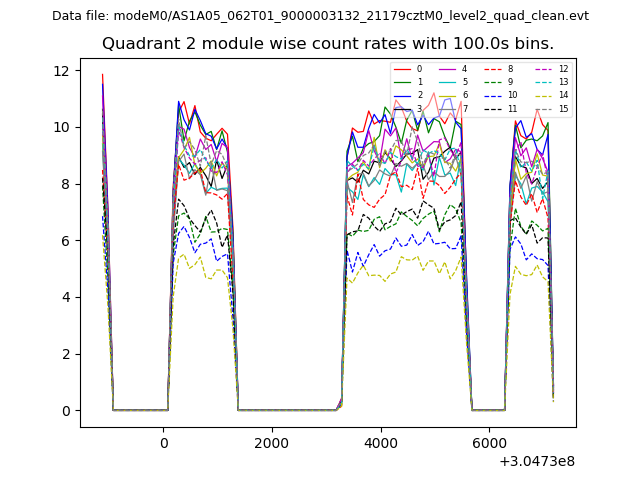
| Module-wise count rates for Quadrant B Data is divided into 100 sec bins |
 |
 |
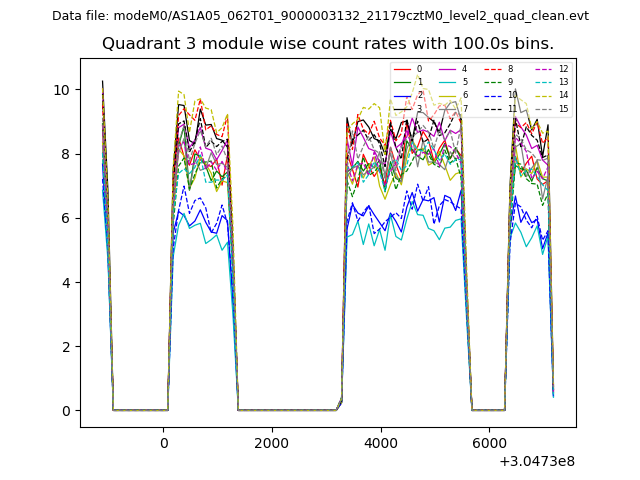
| Module-wise count rates for Quadrant C Data is divided into 100 sec bins |
 |
 |
| Module-wise count rates for Quadrant D Data is divided into 100 sec bins |
 |
 |
| Parameter | Plot |
|---|---|
| CZT HV Monitor | 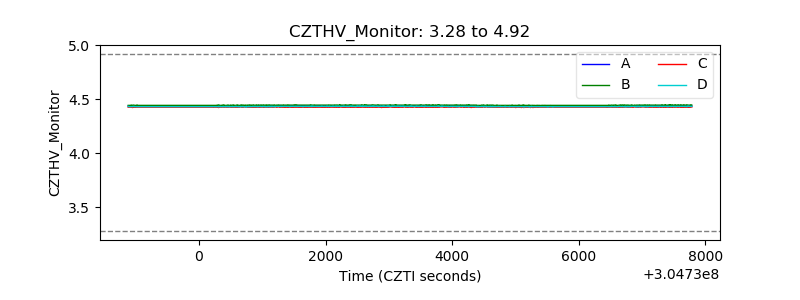 |
| D_VDD |  |
| Temperature 1 | 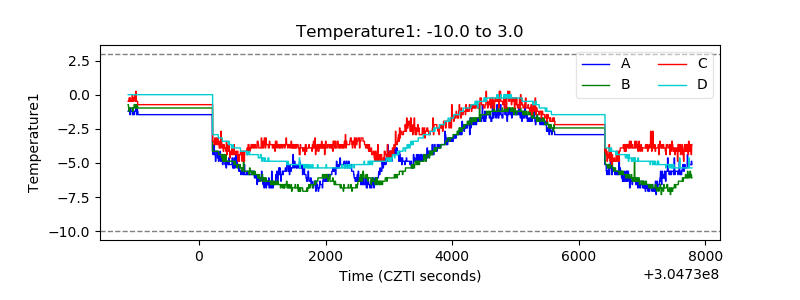 |
| Veto HV Monitor | 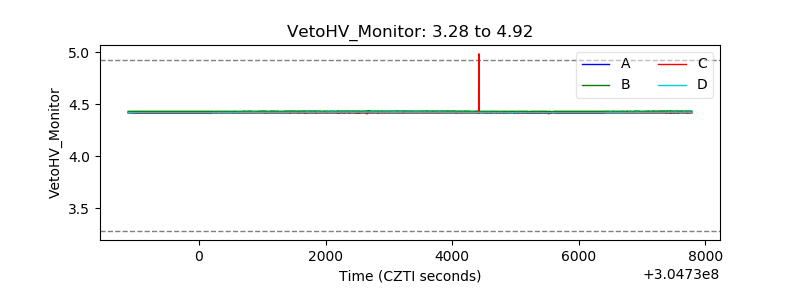 |
| Veto LLD | 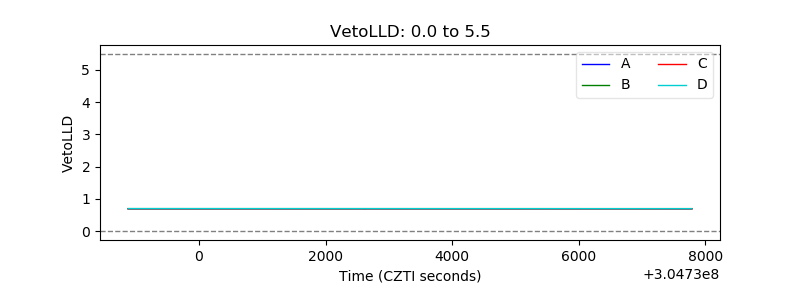 |
| Alpha Counter | 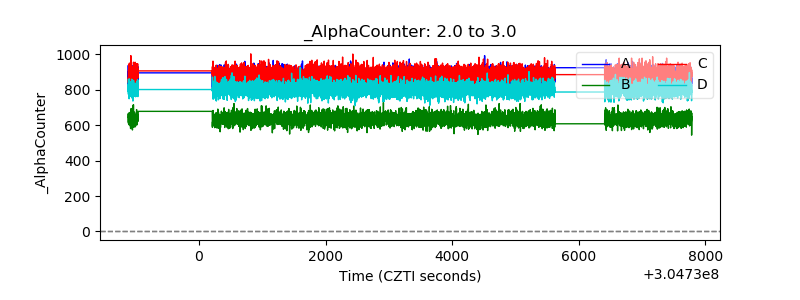 |
| _CPM_Rate | 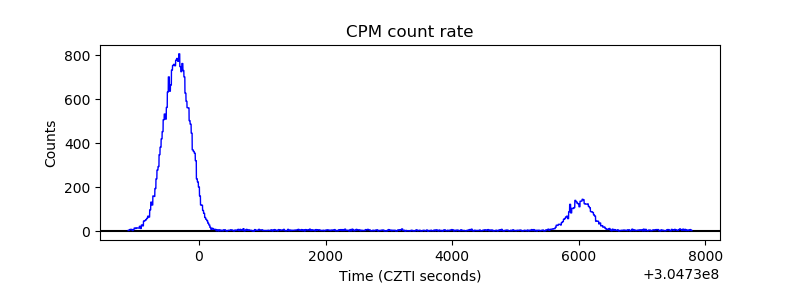 |
| CZT Counter | 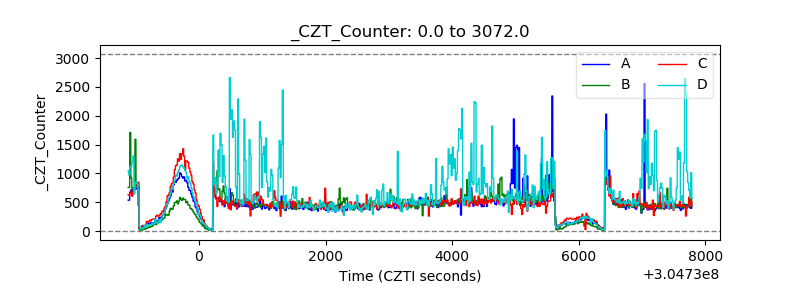 |
| +2.5 Volts monitor |  |
| +5 Volts monitor | 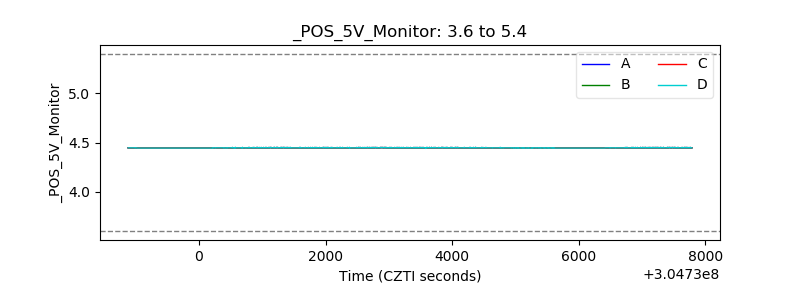 |
| _ROLL_ROT | 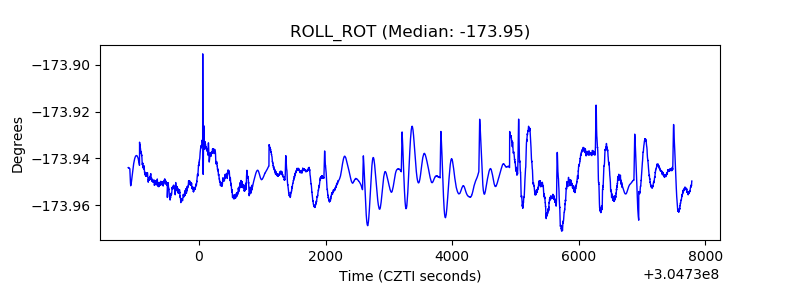 |
| _Roll_DEC | 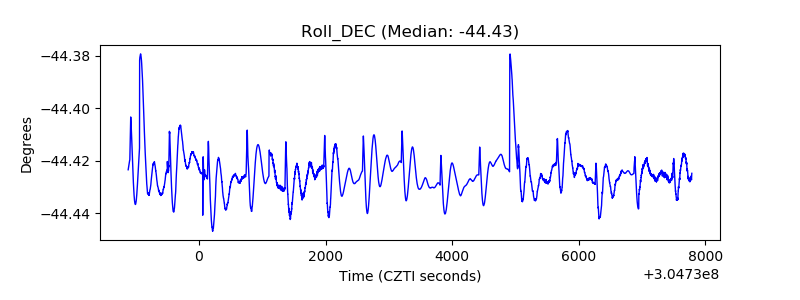 |
| _Roll_RA | 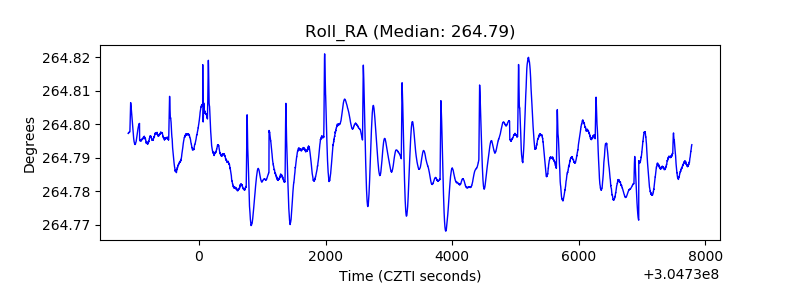 |
| Veto Counter |  |