| Param | Original file | Final file |
|---|---|---|
| Filename | modeM0/AS1A05_062T01_9000003132_21180cztM0_level2.evt | modeM0/AS1A05_062T01_9000003132_21180cztM0_level2_quad_clean.evt |
| Size (bytes) | 725,765,760 | 103,884,480 |
| Size | 692.1 MB | 99.1 MB |
| Events in quadrant A | 4,226,135 | 653,804 |
| Events in quadrant B | 4,244,776 | 671,126 |
| Events in quadrant C | 4,070,846 | 650,707 |
| Events in quadrant D | 8,870,353 | 586,827 |
| Mode SS | |||
|---|---|---|---|
| Quadrant | BADHDUFLAG | Total packets | Discarded packets |
| A | 0 | 170 | 0 |
| B | 0 | 170 | 0 |
| C | 0 | 170 | 0 |
| D | 0 | 170 | 0 |
| Mode M9 | |||
|---|---|---|---|
| Quadrant | BADHDUFLAG | Total packets | Discarded packets |
| A | 0 | 12 | 0 |
| B | 0 | 12 | 0 |
| C | 0 | 12 | 0 |
| D | 0 | 12 | 0 |
| Mode M0 | |||
|---|---|---|---|
| Quadrant | BADHDUFLAG | Total packets | Discarded packets |
| A | 0 | 18231 | 2 |
| B | 0 | 18072 | 2 |
| C | 0 | 17515 | 2 |
| D | 0 | 32211 | 3 |
| Quadrant | Total seconds | Saturated seconds | Saturation percentage |
|---|---|---|---|
| A | 8398 | 187 | 2.226721% |
| B | 8399 | 133 | 1.583522% |
| C | 8399 | 146 | 1.738302% |
| D | 8398 | 934 | 11.121696% |
Noise dominated data is calculated using 1-second bins in cleaned event files. If a bin has >2000 counts, and if more than 50% of those come from <1% of pixels, then it is considered to be noise-dominated and hence unusable.
| Quadrant | # 1 sec bins | Bins with >0 counts | Bins with >2000 counts | High rate bins dominated by noise | Noise dominated (total time) | Noise dominated (detector-on time) | Marked lightcurve |
|---|---|---|---|---|---|---|---|
| A | 9538 | 8400 | 65 | 65 | 0.68% | 0.77% | 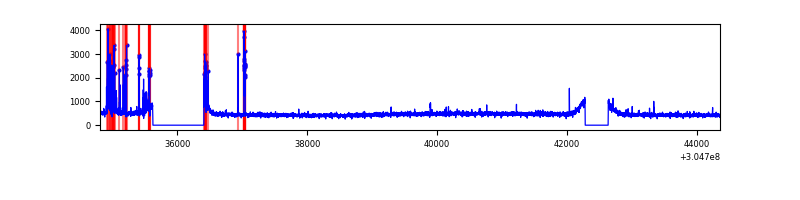 |
| B | 9539 | 8401 | 2 | 2 | 0.02% | 0.02% | 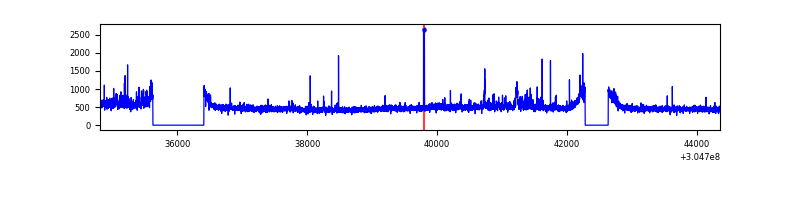 |
| C | 9539 | 8400 | 3 | 3 | 0.03% | 0.04% | 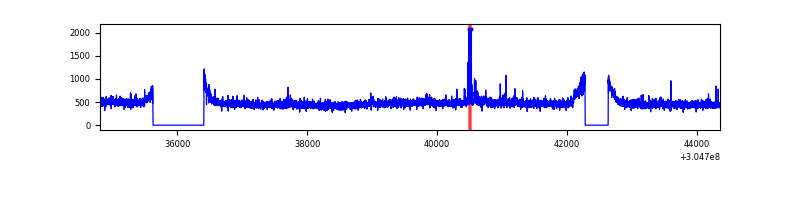 |
| D | 9538 | 8400 | 770 | 770 | 8.07% | 9.17% | 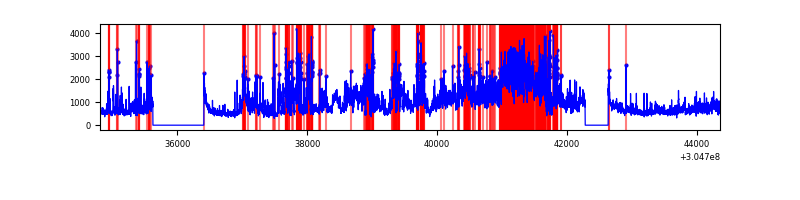 |
Top three noisy pixels from each quadrant. If the there are fewer than three noisy pixels in the level2.evt file, extra rows are filled as -1
| Pixel properties | Quadrant properties | ||||||
|---|---|---|---|---|---|---|---|
| Quadrant | DetID | PixID | Counts | Sigma | Mean | Median | Sigma |
| A | 5 | 16 | 313237 | 1524.19 | 1009 | 985 | 204.9 |
| A | 13 | 254 | 13001 | 58.65 | 1009 | 985 | 204.9 |
| A | 10 | 229 | 11206 | 49.89 | 1009 | 985 | 204.9 |
| B | 0 | 182 | 85546 | 434.09 | 1019 | 994 | 194.8 |
| B | 0 | 190 | 58715 | 296.34 | 1019 | 994 | 194.8 |
| B | 0 | 229 | 29335 | 145.5 | 1019 | 994 | 194.8 |
| C | 14 | 238 | 151033 | 654.06 | 975 | 980 | 229.4 |
| C | 3 | 233 | 96660 | 417.06 | 975 | 980 | 229.4 |
| C | 8 | 128 | 12788 | 51.47 | 975 | 980 | 229.4 |
| D | 7 | 238 | 2679532 | 11533.93 | 952 | 924 | 232.2 |
| D | 1 | 239 | 1194441 | 5139.21 | 952 | 924 | 232.2 |
| D | 1 | 52 | 972584 | 4183.91 | 952 | 924 | 232.2 |
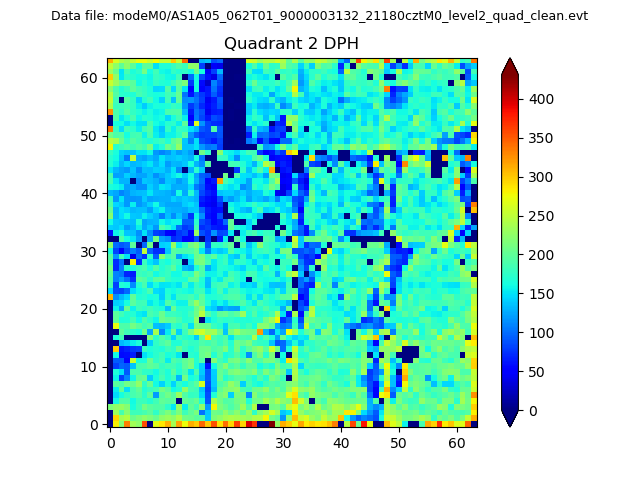
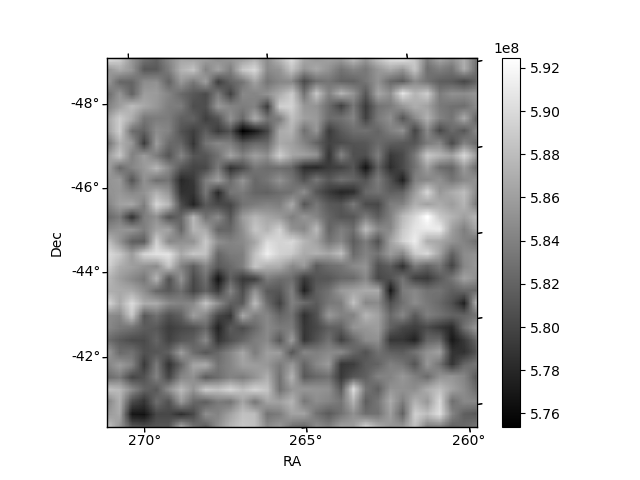
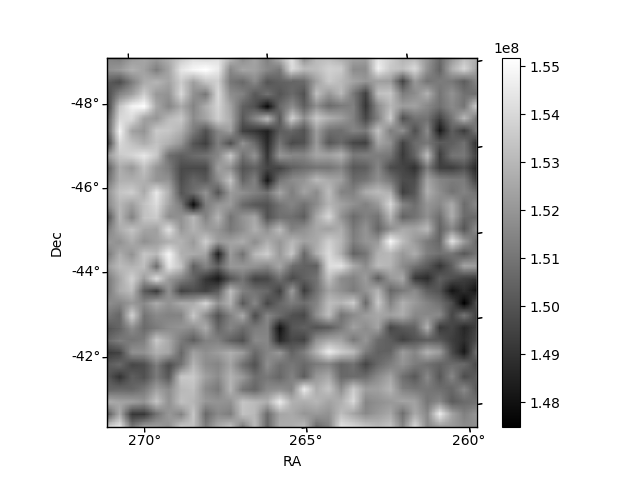
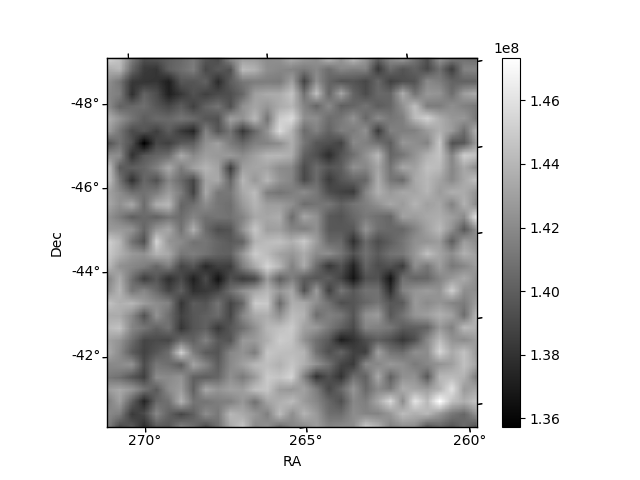
Histogram calculated using DETX and DETY for each event in the final _common_clean file
| Quadrant A | 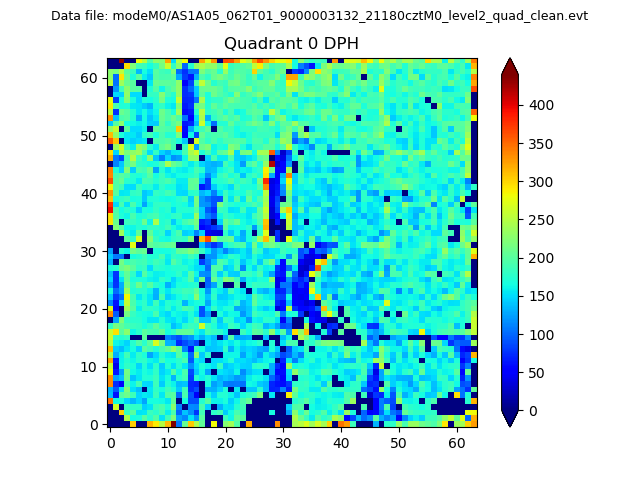 |
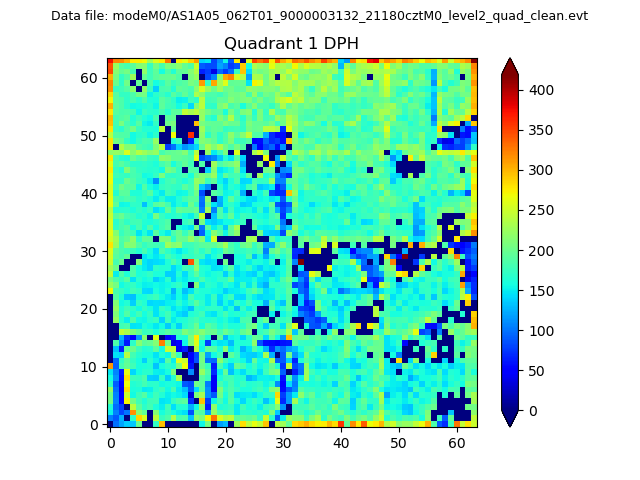 |
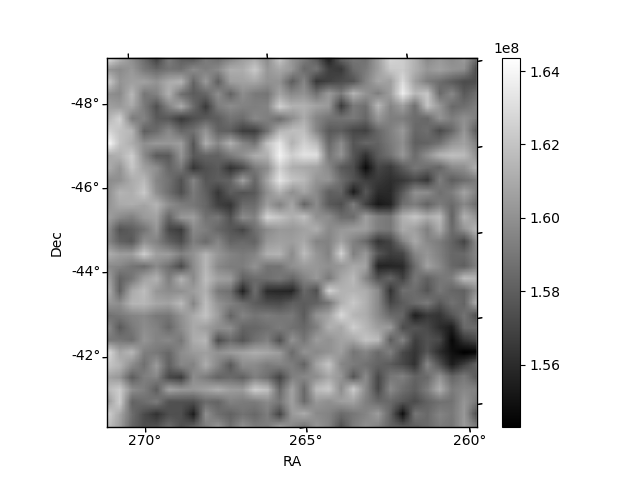
Quadrant B |
|---|---|---|---|
| Quadrant D | 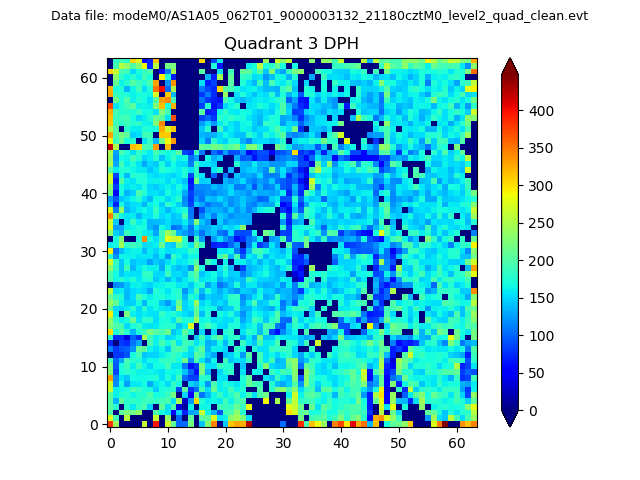 |
 |
Quadrant C |
| Plot type | Count rate plots | Images |
|---|---|---|
| Comparison with Poisson distribution Blue bars denote a histogram of data divided into 1 sec bins. Red curve is a Poisson curve with rate = median count rate of data. |
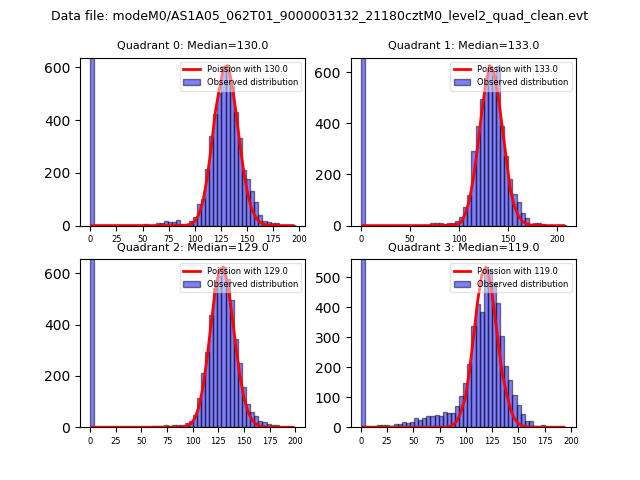 |
 |
| Quadrant-wise count rates Data is divided into 100 sec bins |
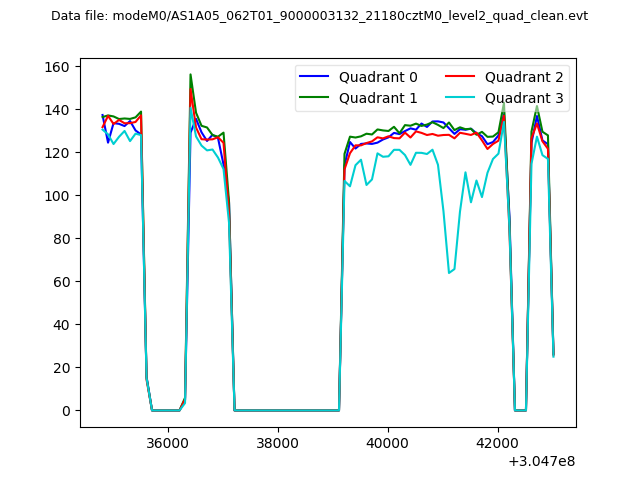 |
|
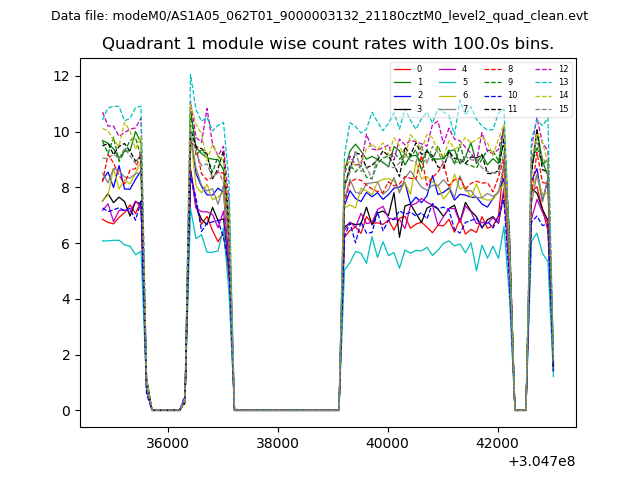
| Module-wise count rates for Quadrant A Data is divided into 100 sec bins |
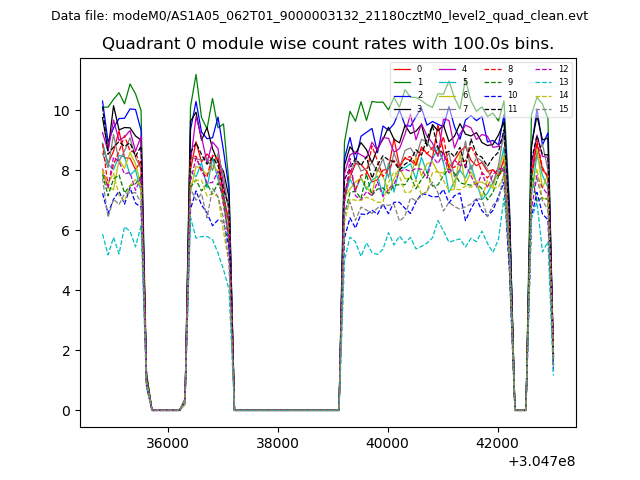 |
 |
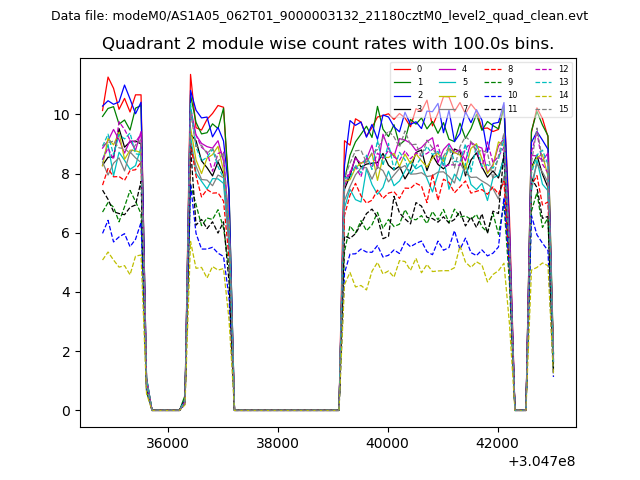
| Module-wise count rates for Quadrant B Data is divided into 100 sec bins |
 |
 |
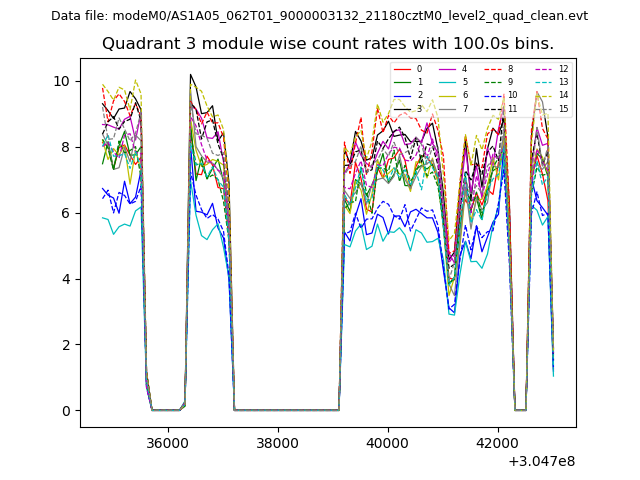
| Module-wise count rates for Quadrant C Data is divided into 100 sec bins |
 |
 |
| Module-wise count rates for Quadrant D Data is divided into 100 sec bins |
 |
 |
| Parameter | Plot |
|---|---|
| CZT HV Monitor | 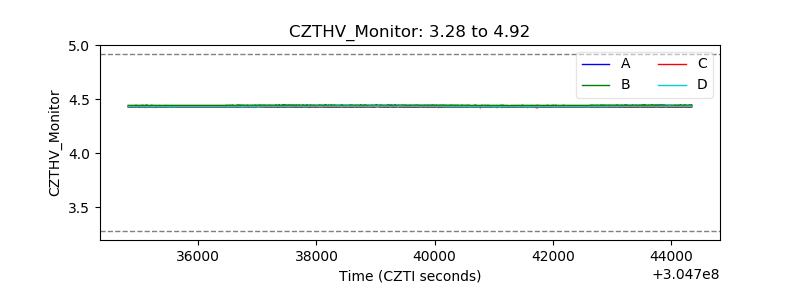 |
| D_VDD | 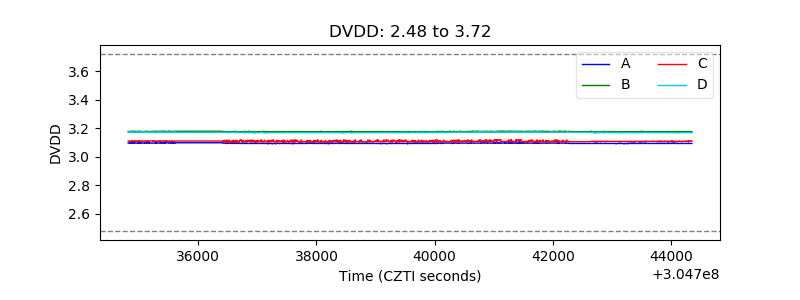 |
| Temperature 1 | 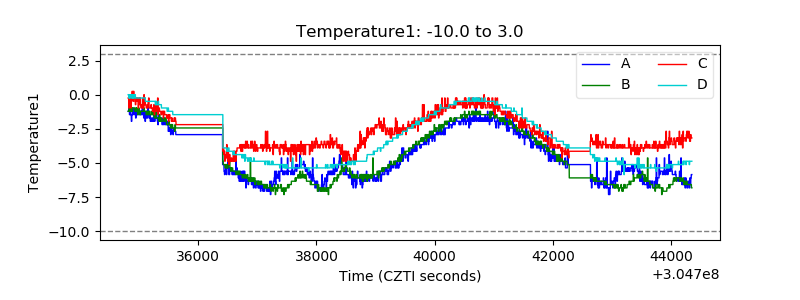 |
| Veto HV Monitor | 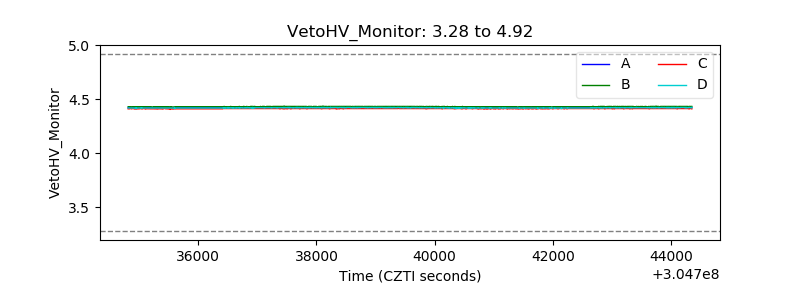 |
| Veto LLD | 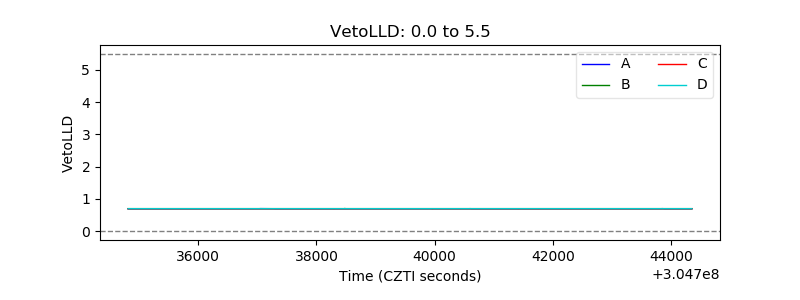 |
| Alpha Counter | 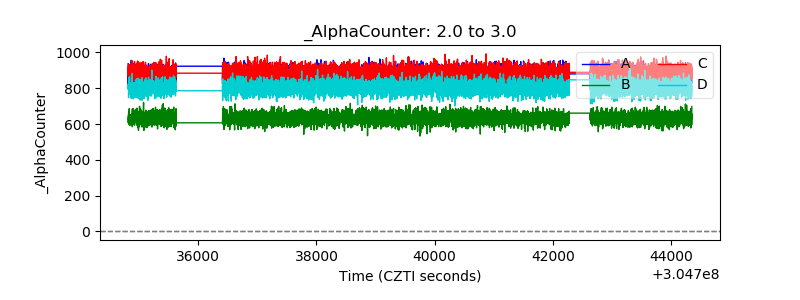 |
| _CPM_Rate | 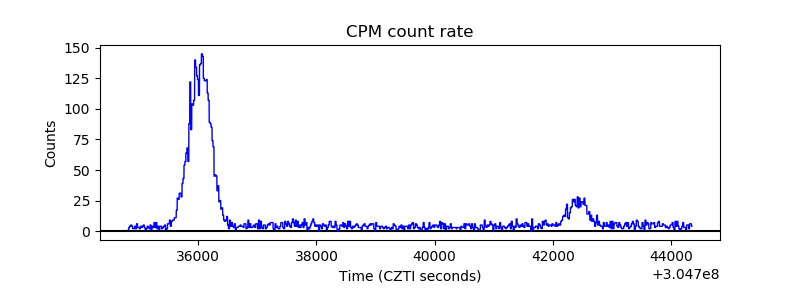 |
| CZT Counter | 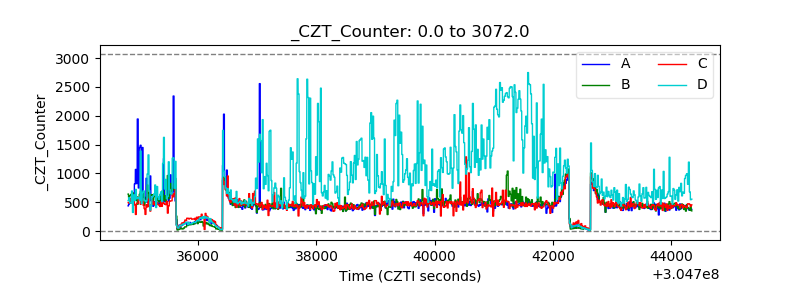 |
| +2.5 Volts monitor |  |
| +5 Volts monitor |  |
| _ROLL_ROT | 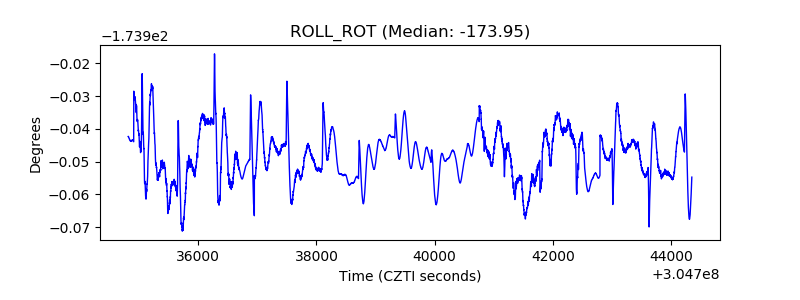 |
| _Roll_DEC | 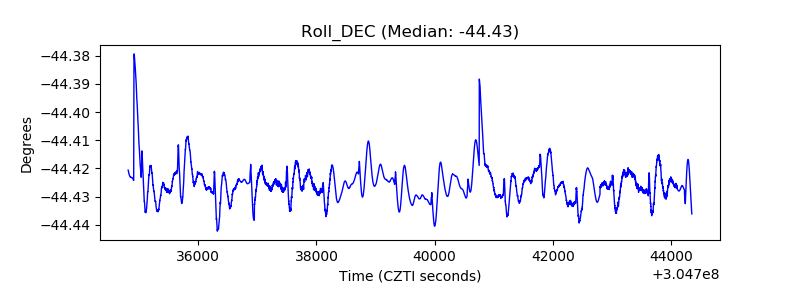 |
| _Roll_RA | 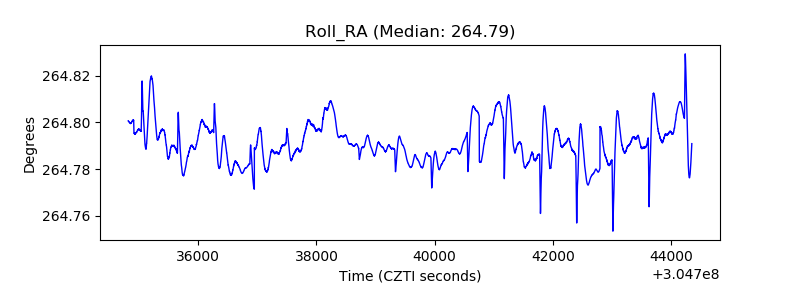 |
| Veto Counter | 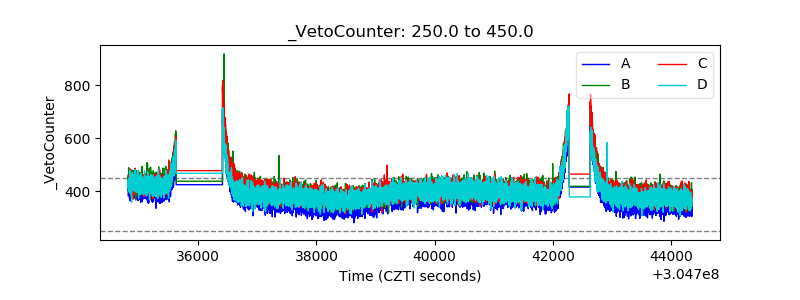 |