| Param | Original file | Final file |
|---|---|---|
| Filename | modeM0/AS1A05_062T01_9000003132_21181cztM0_level2.evt | modeM0/AS1A05_062T01_9000003132_21181cztM0_level2_quad_clean.evt |
| Size (bytes) | 743,947,200 | 97,390,080 |
| Size | 709.5 MB | 92.9 MB |
| Events in quadrant A | 4,117,935 | 610,930 |
| Events in quadrant B | 4,271,384 | 619,183 |
| Events in quadrant C | 4,166,884 | 600,230 |
| Events in quadrant D | 9,402,803 | 531,654 |
| Mode SS | |||
|---|---|---|---|
| Quadrant | BADHDUFLAG | Total packets | Discarded packets |
| A | 0 | 172 | 0 |
| B | 0 | 172 | 0 |
| C | 0 | 172 | 0 |
| D | 0 | 172 | 0 |
| Mode M9 | |||
|---|---|---|---|
| Quadrant | BADHDUFLAG | Total packets | Discarded packets |
| A | 0 | 5 | 0 |
| B | 0 | 5 | 0 |
| C | 0 | 5 | 0 |
| D | 0 | 5 | 0 |
| Mode M0 | |||
|---|---|---|---|
| Quadrant | BADHDUFLAG | Total packets | Discarded packets |
| A | 0 | 18005 | 3 |
| B | 0 | 18176 | 3 |
| C | 0 | 17894 | 3 |
| D | 0 | 33935 | 3 |
| Quadrant | Total seconds | Saturated seconds | Saturation percentage |
|---|---|---|---|
| A | 8448 | 267 | 3.160511% |
| B | 8449 | 323 | 3.822938% |
| C | 8448 | 366 | 4.332386% |
| D | 8448 | 1273 | 15.068655% |
Noise dominated data is calculated using 1-second bins in cleaned event files. If a bin has >2000 counts, and if more than 50% of those come from <1% of pixels, then it is considered to be noise-dominated and hence unusable.
| Quadrant | # 1 sec bins | Bins with >0 counts | Bins with >2000 counts | High rate bins dominated by noise | Noise dominated (total time) | Noise dominated (detector-on time) | Marked lightcurve |
|---|---|---|---|---|---|---|---|
| A | 8868 | 8451 | 0 | 0 | 0.00% | 0.00% | 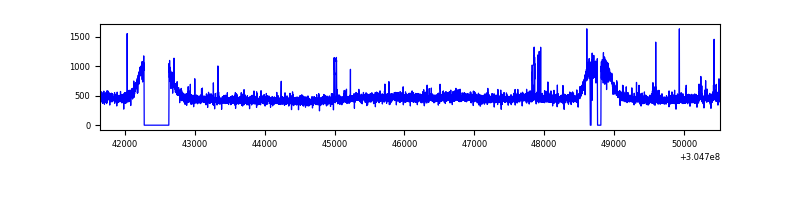 |
| B | 8869 | 8452 | 3 | 3 | 0.03% | 0.04% | 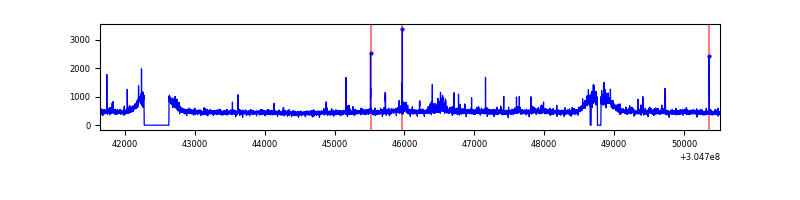 |
| C | 8868 | 8449 | 0 | 0 | 0.00% | 0.00% | 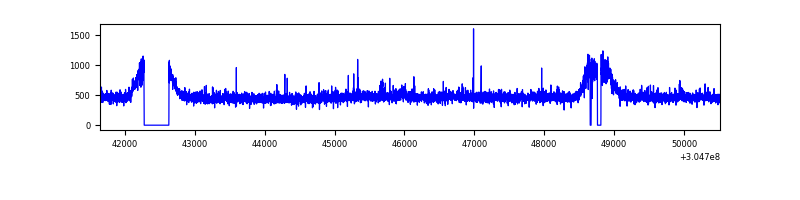 |
| D | 8868 | 8450 | 922 | 922 | 10.40% | 10.91% | 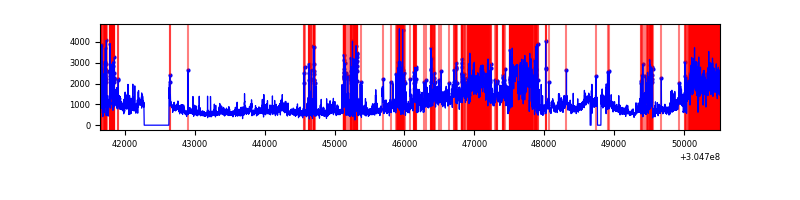 |
Top three noisy pixels from each quadrant. If the there are fewer than three noisy pixels in the level2.evt file, extra rows are filled as -1
| Pixel properties | Quadrant properties | ||||||
|---|---|---|---|---|---|---|---|
| Quadrant | DetID | PixID | Counts | Sigma | Mean | Median | Sigma |
| A | 10 | 229 | 40338 | 185.81 | 1045 | 1021 | 211.6 |
| A | 13 | 252 | 27714 | 126.15 | 1045 | 1021 | 211.6 |
| A | 5 | 16 | 15788 | 69.79 | 1045 | 1021 | 211.6 |
| B | 0 | 190 | 30850 | 145.49 | 1047 | 1019 | 205.0 |
| B | 0 | 230 | 30266 | 142.64 | 1047 | 1019 | 205.0 |
| B | 0 | 182 | 27254 | 127.95 | 1047 | 1019 | 205.0 |
| C | 14 | 238 | 152978 | 637.26 | 1006 | 1013 | 238.5 |
| C | 3 | 233 | 74199 | 306.9 | 1006 | 1013 | 238.5 |
| C | 10 | 91 | 18246 | 72.27 | 1006 | 1013 | 238.5 |
| D | 7 | 238 | 3217170 | 13613.75 | 971 | 942 | 236.2 |
| D | 1 | 52 | 1183622 | 5006.09 | 971 | 942 | 236.2 |
| D | 1 | 239 | 961189 | 4064.56 | 971 | 942 | 236.2 |
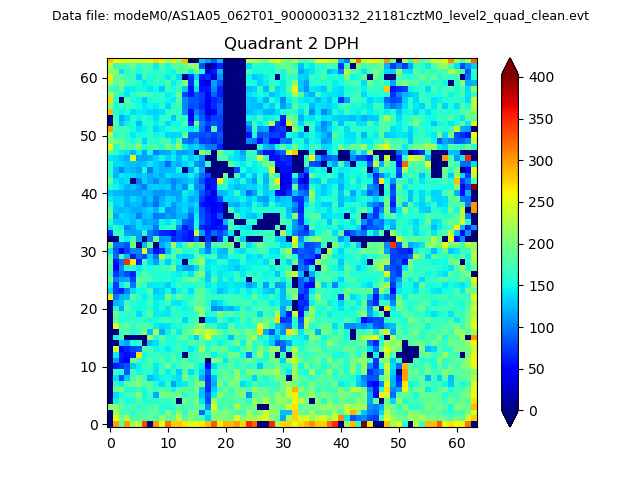
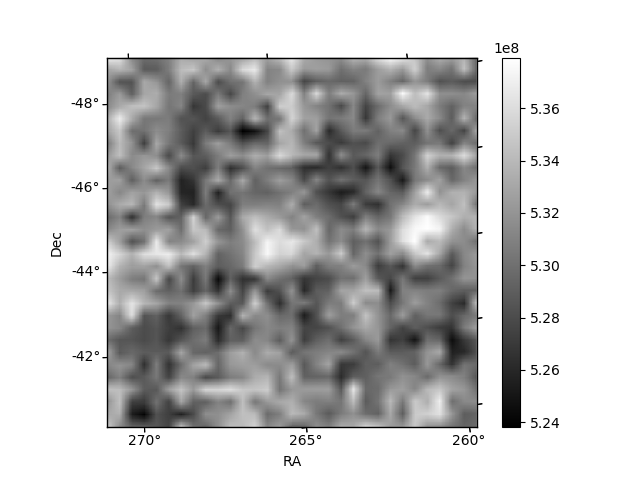
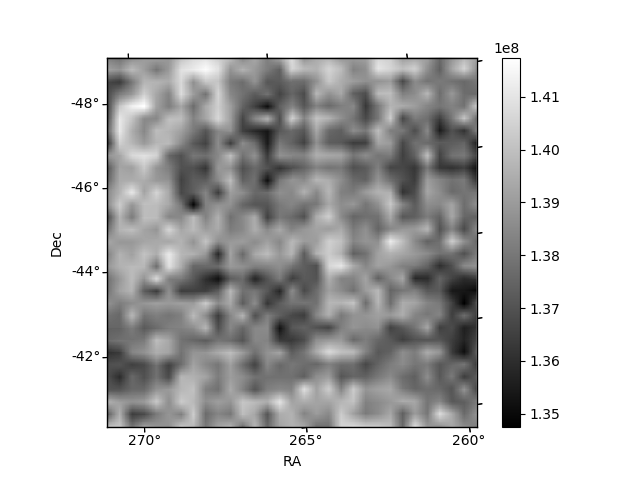
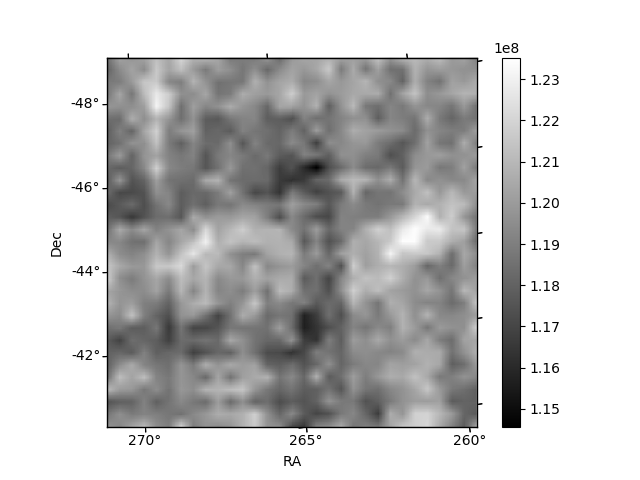
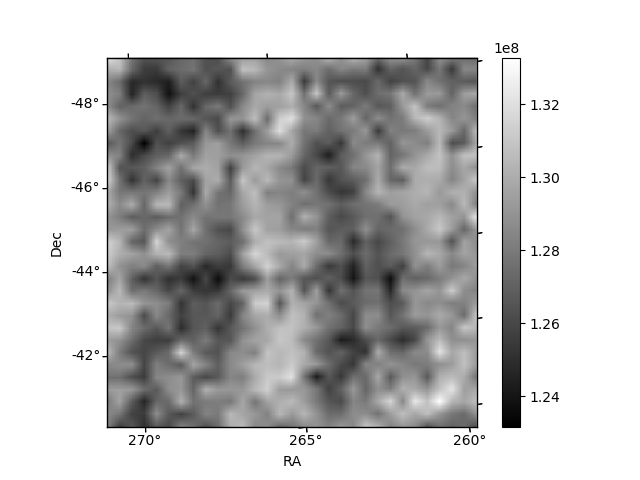
Histogram calculated using DETX and DETY for each event in the final _common_clean file
| Quadrant A | 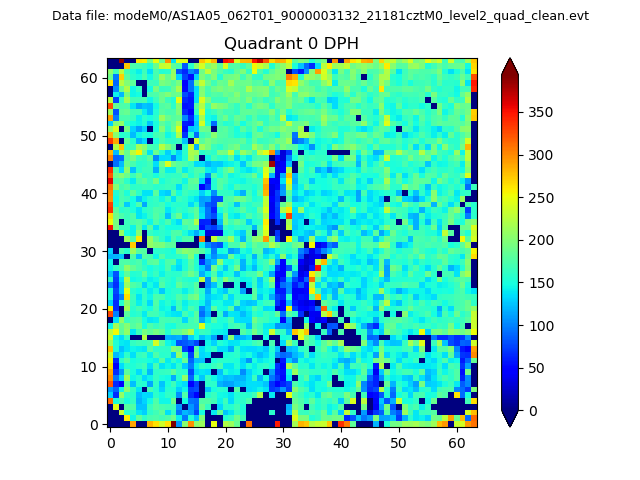 |
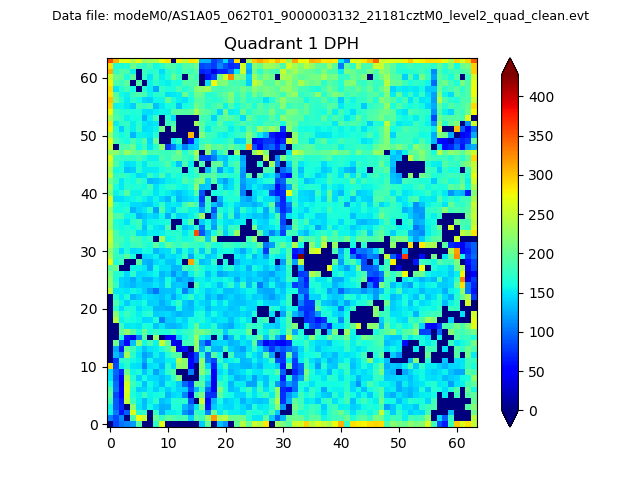 |
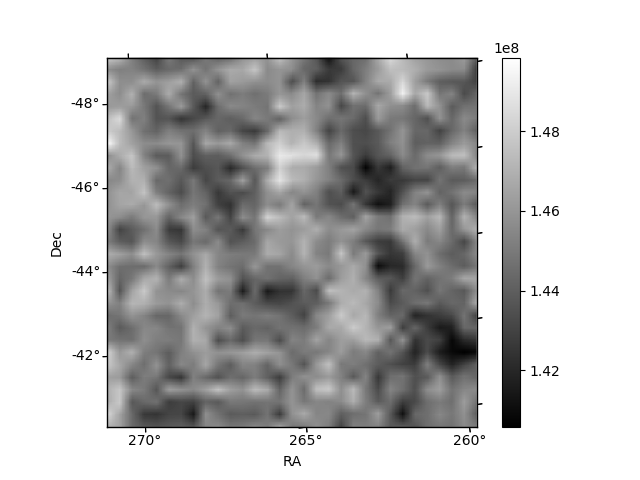
Quadrant B |
|---|---|---|---|
| Quadrant D | 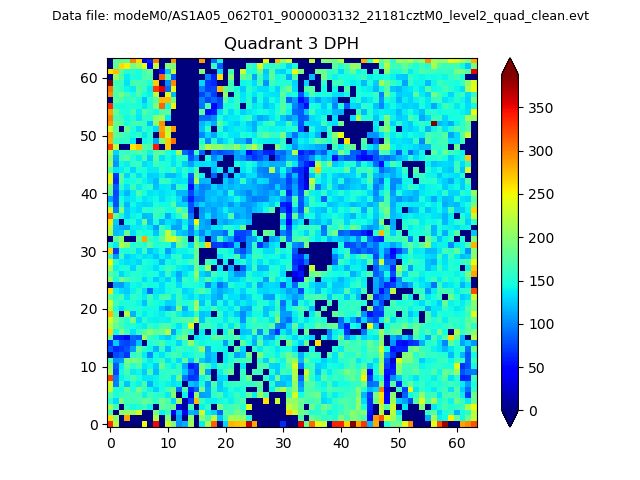 |
 |
Quadrant C |
| Plot type | Count rate plots | Images |
|---|---|---|
| Comparison with Poisson distribution Blue bars denote a histogram of data divided into 1 sec bins. Red curve is a Poisson curve with rate = median count rate of data. |
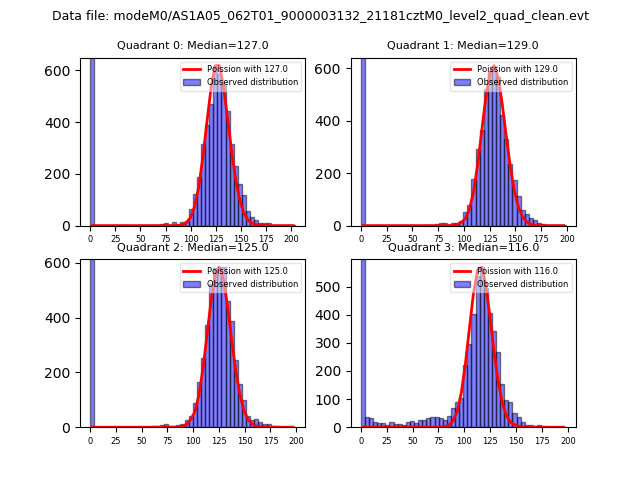 |
 |
| Quadrant-wise count rates Data is divided into 100 sec bins |
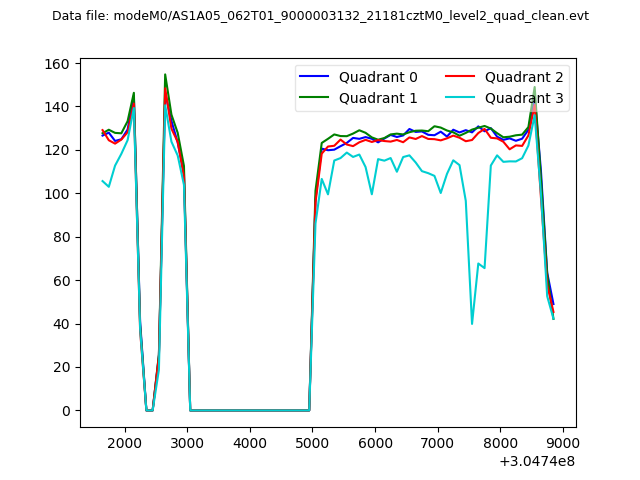 |
|
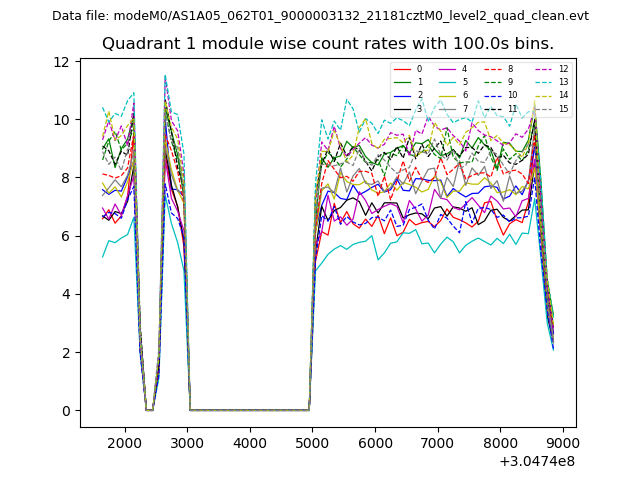
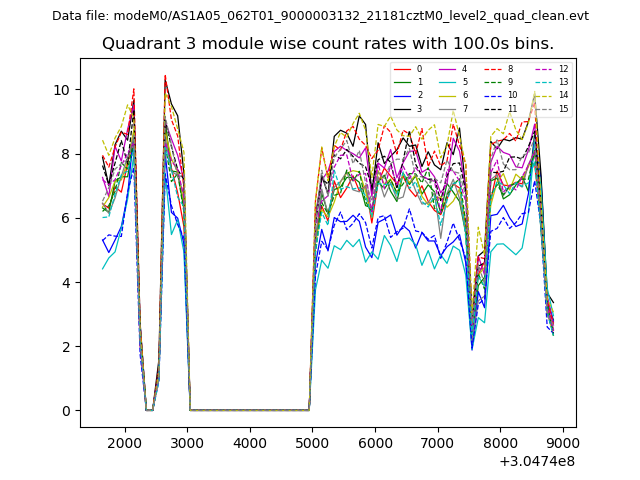
| Module-wise count rates for Quadrant A Data is divided into 100 sec bins |
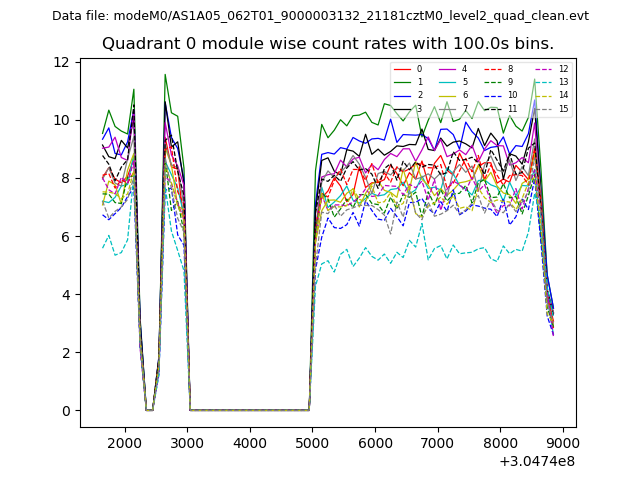 |
 |
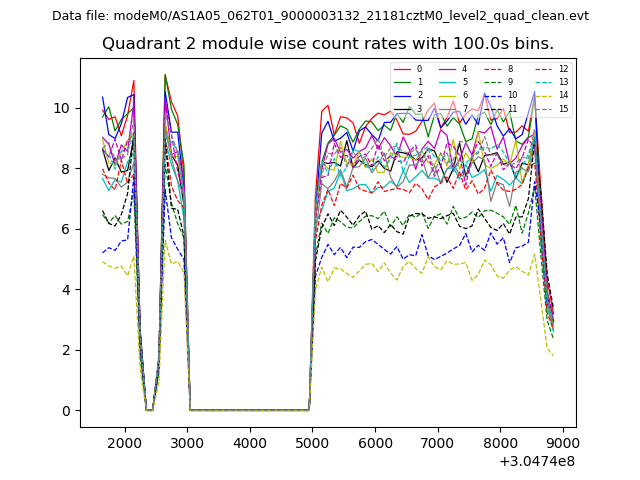
| Module-wise count rates for Quadrant B Data is divided into 100 sec bins |
 |
 |
| Module-wise count rates for Quadrant C Data is divided into 100 sec bins |
 |
 |
| Module-wise count rates for Quadrant D Data is divided into 100 sec bins |
 |
 |
| Parameter | Plot |
|---|---|
| CZT HV Monitor | 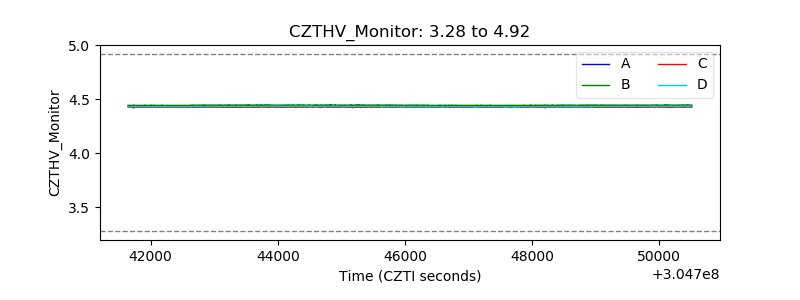 |
| D_VDD | 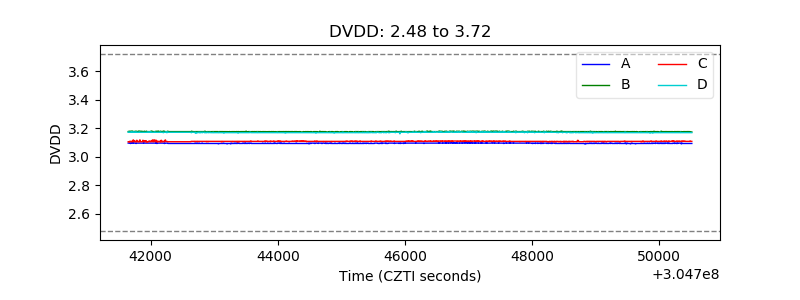 |
| Temperature 1 | 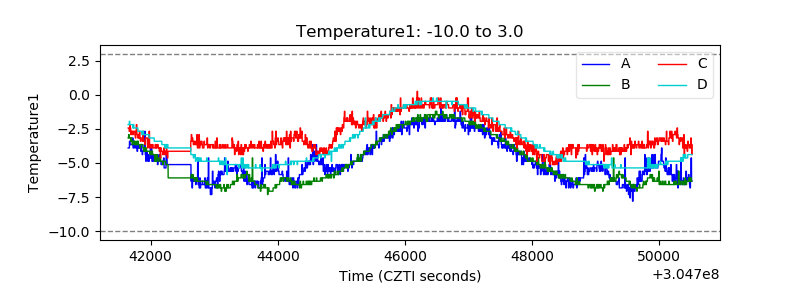 |
| Veto HV Monitor | 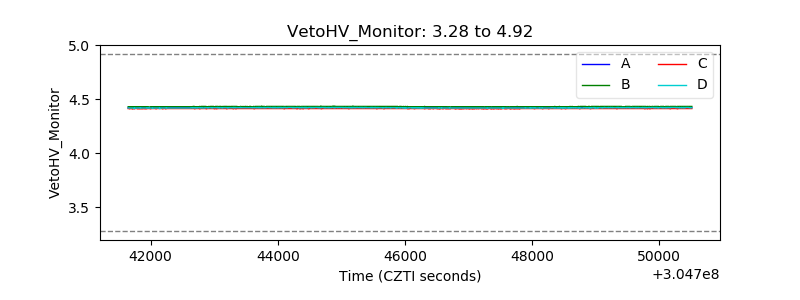 |
| Veto LLD | 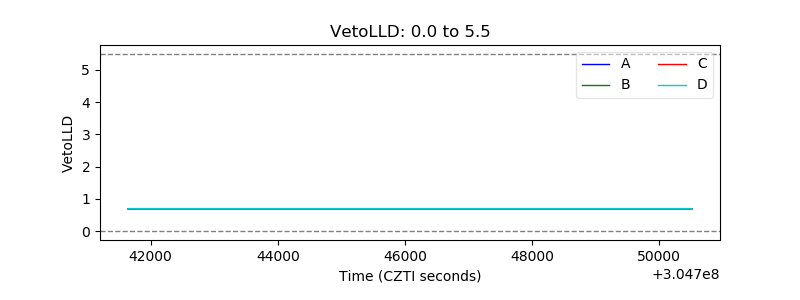 |
| Alpha Counter | 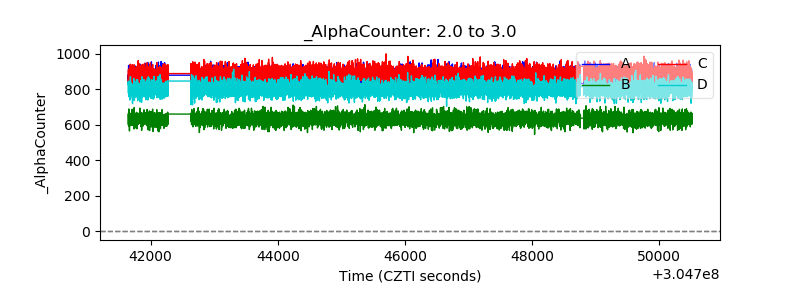 |
| _CPM_Rate | 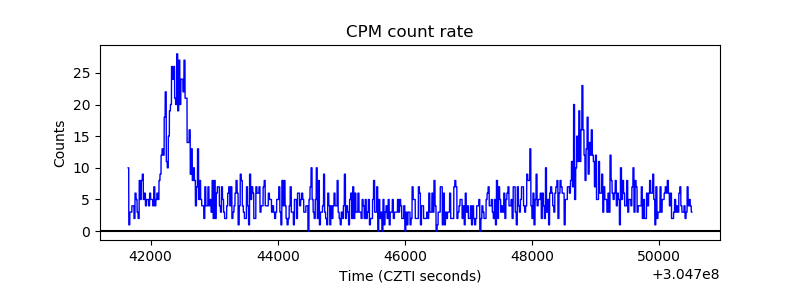 |
| CZT Counter | 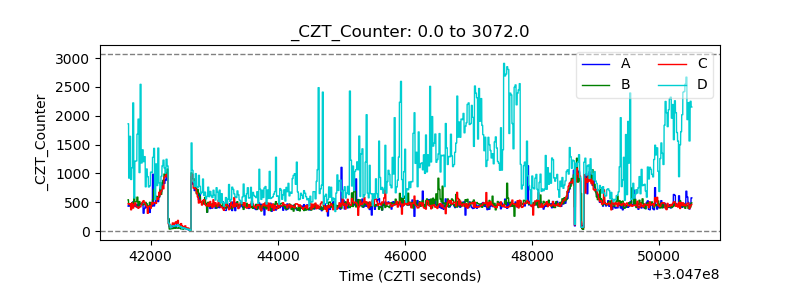 |
| +2.5 Volts monitor |  |
| +5 Volts monitor |  |
| _ROLL_ROT | 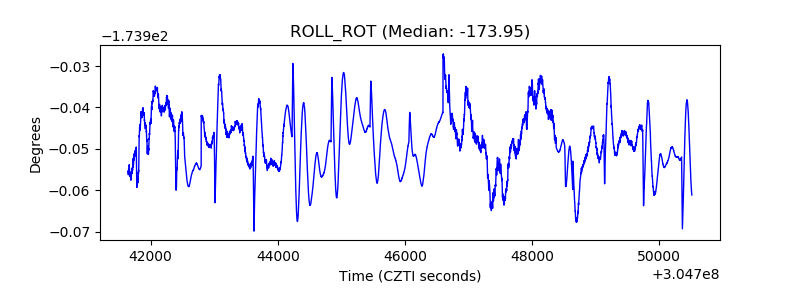 |
| _Roll_DEC | 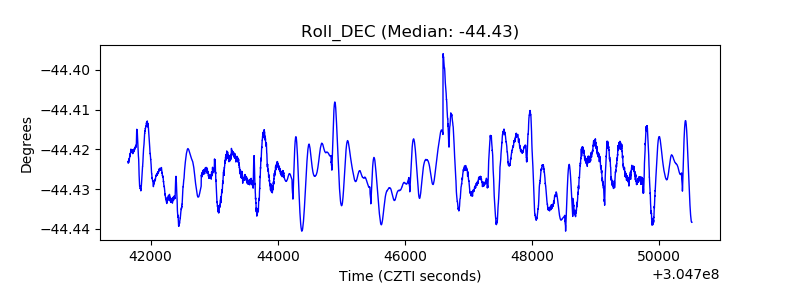 |
| _Roll_RA | 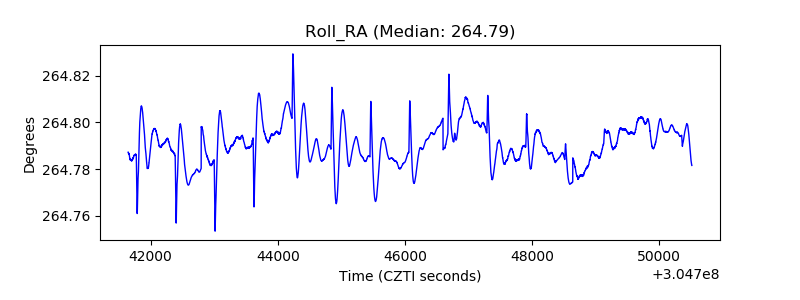 |
| Veto Counter | 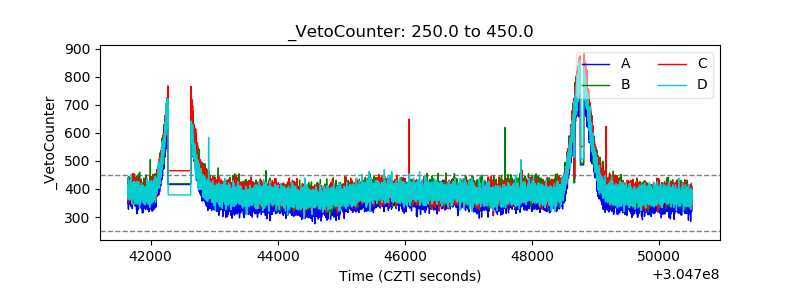 |