| Param | Original file | Final file |
|---|---|---|
| Filename | modeM0/AS1A05_062T01_9000003132_21182cztM0_level2.evt | modeM0/AS1A05_062T01_9000003132_21182cztM0_level2_quad_clean.evt |
| Size (bytes) | 415,097,280 | 55,791,360 |
| Size | 395.9 MB | 53.2 MB |
| Events in quadrant A | 2,318,737 | 343,635 |
| Events in quadrant B | 2,431,096 | 348,412 |
| Events in quadrant C | 2,351,611 | 338,697 |
| Events in quadrant D | 5,142,195 | 320,165 |
| Mode SS | |||
|---|---|---|---|
| Quadrant | BADHDUFLAG | Total packets | Discarded packets |
| A | 0 | 96 | 0 |
| B | 0 | 96 | 0 |
| C | 0 | 96 | 0 |
| D | 0 | 96 | 0 |
| Mode M9 | |||
|---|---|---|---|
| Quadrant | BADHDUFLAG | Total packets | Discarded packets |
| A | 0 | 1 | 0 |
| B | 0 | 1 | 0 |
| C | 0 | 1 | 0 |
| D | 0 | 1 | 0 |
| Mode M0 | |||
|---|---|---|---|
| Quadrant | BADHDUFLAG | Total packets | Discarded packets |
| A | 0 | 10175 | 1 |
| B | 0 | 10337 | 1 |
| C | 0 | 10130 | 1 |
| D | 0 | 18626 | 1 |
| Quadrant | Total seconds | Saturated seconds | Saturation percentage |
|---|---|---|---|
| A | 4824 | 161 | 3.337479% |
| B | 4825 | 191 | 3.958549% |
| C | 4825 | 194 | 4.020725% |
| D | 4825 | 657 | 13.616580% |
Noise dominated data is calculated using 1-second bins in cleaned event files. If a bin has >2000 counts, and if more than 50% of those come from <1% of pixels, then it is considered to be noise-dominated and hence unusable.
| Quadrant | # 1 sec bins | Bins with >0 counts | Bins with >2000 counts | High rate bins dominated by noise | Noise dominated (total time) | Noise dominated (detector-on time) | Marked lightcurve |
|---|---|---|---|---|---|---|---|
| A | 4874 | 4825 | 0 | 0 | 0.00% | 0.00% | 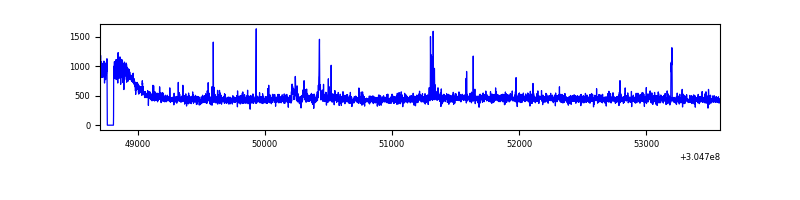 |
| B | 4875 | 4826 | 8 | 8 | 0.16% | 0.17% | 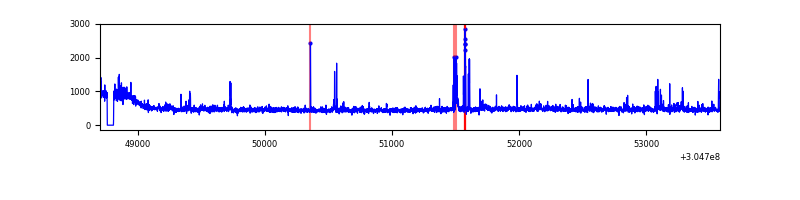 |
| C | 4875 | 4825 | 0 | 0 | 0.00% | 0.00% | 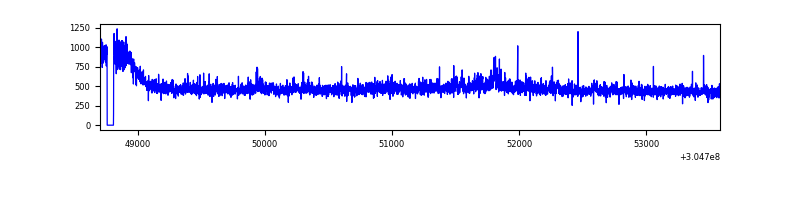 |
| D | 4875 | 4825 | 478 | 478 | 9.81% | 9.91% | 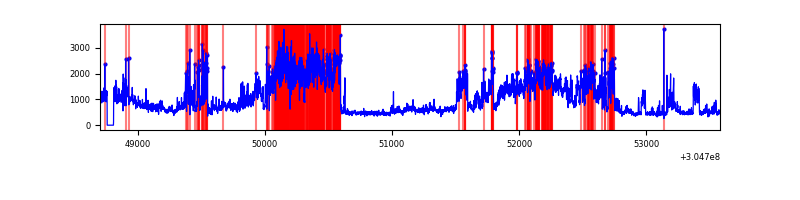 |
Top three noisy pixels from each quadrant. If the there are fewer than three noisy pixels in the level2.evt file, extra rows are filled as -1
| Pixel properties | Quadrant properties | ||||||
|---|---|---|---|---|---|---|---|
| Quadrant | DetID | PixID | Counts | Sigma | Mean | Median | Sigma |
| A | 13 | 252 | 29456 | 239.65 | 583 | 570 | 120.5 |
| A | 5 | 16 | 25589 | 207.57 | 583 | 570 | 120.5 |
| A | 10 | 229 | 11122 | 87.54 | 583 | 570 | 120.5 |
| B | 3 | 64 | 57806 | 501.3 | 580 | 565 | 114.2 |
| B | 0 | 230 | 35598 | 306.81 | 580 | 565 | 114.2 |
| B | 0 | 190 | 16403 | 138.7 | 580 | 565 | 114.2 |
| C | 14 | 238 | 85395 | 639.31 | 558 | 562 | 132.7 |
| C | 3 | 233 | 82757 | 619.43 | 558 | 562 | 132.7 |
| C | 0 | 236 | 4365 | 28.66 | 558 | 562 | 132.7 |
| D | 7 | 238 | 1989594 | 14648.35 | 551 | 534 | 135.8 |
| D | 1 | 239 | 456304 | 3356.5 | 551 | 534 | 135.8 |
| D | 1 | 52 | 368164 | 2707.4 | 551 | 534 | 135.8 |
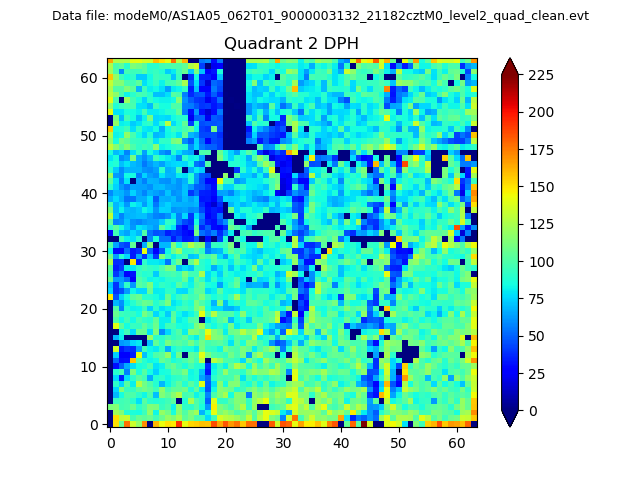
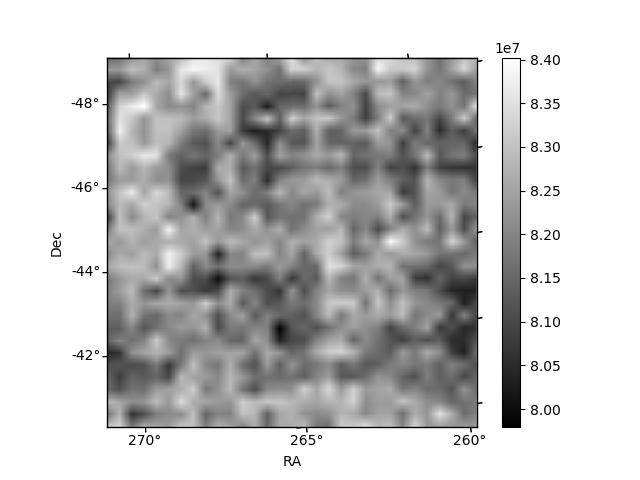
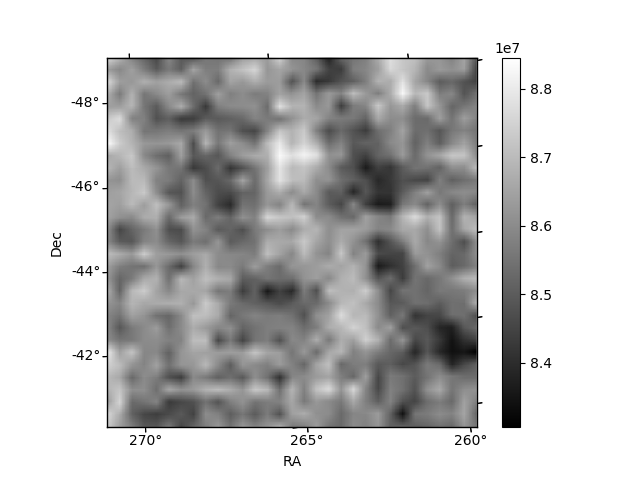
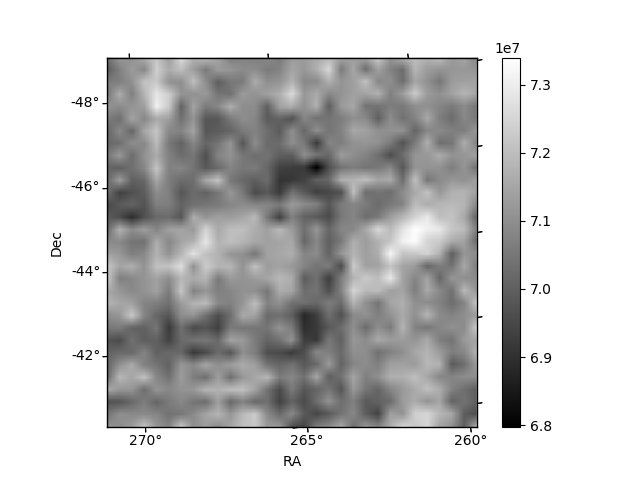
Histogram calculated using DETX and DETY for each event in the final _common_clean file
| Quadrant A | 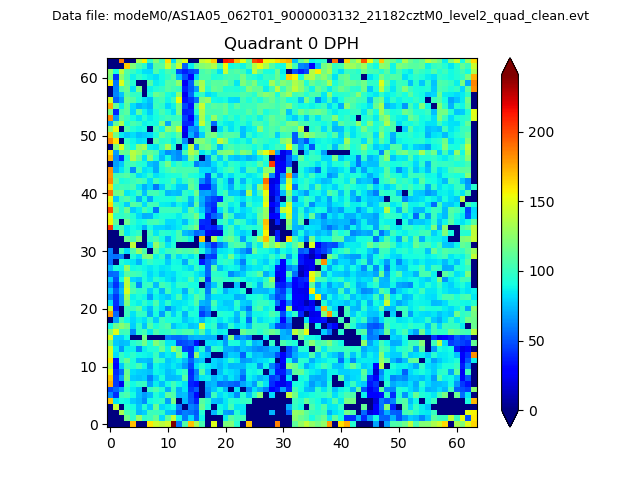 |
 |
Quadrant B |
|---|---|---|---|
| Quadrant D |  |
 |
Quadrant C |
| Plot type | Count rate plots | Images |
|---|---|---|
| Comparison with Poisson distribution Blue bars denote a histogram of data divided into 1 sec bins. Red curve is a Poisson curve with rate = median count rate of data. |
 |
 |
| Quadrant-wise count rates Data is divided into 100 sec bins |
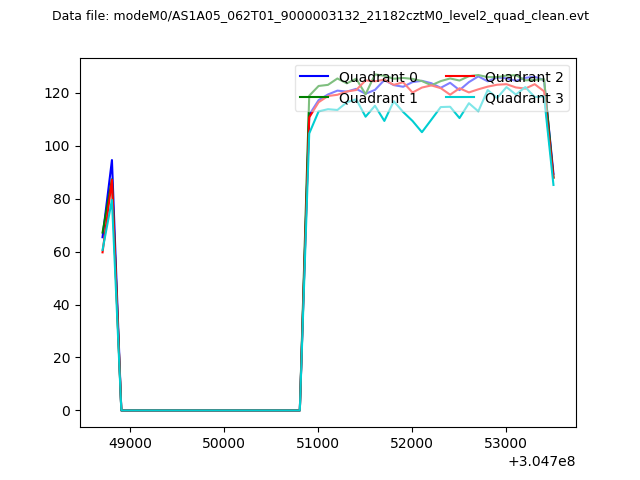 |
|
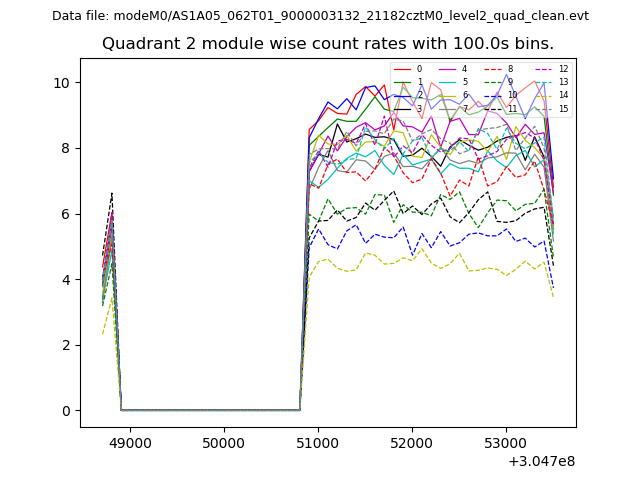
| Module-wise count rates for Quadrant A Data is divided into 100 sec bins |
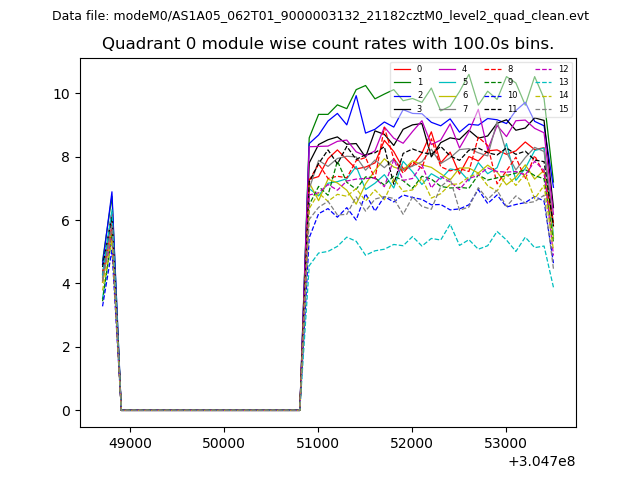 |
 |
| Module-wise count rates for Quadrant B Data is divided into 100 sec bins |
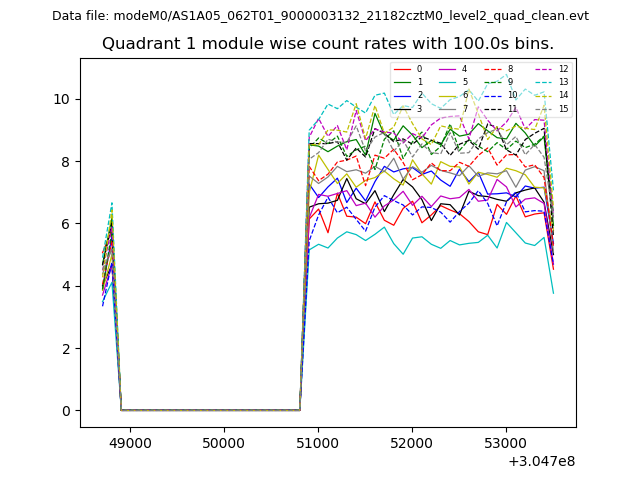 |
 |
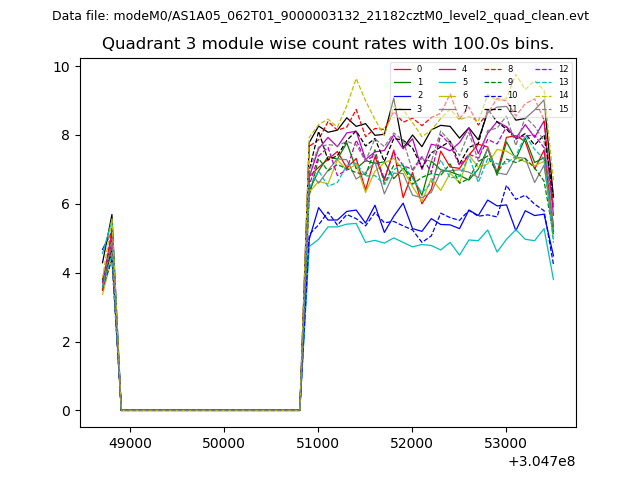
| Module-wise count rates for Quadrant C Data is divided into 100 sec bins |
 |
 |
| Module-wise count rates for Quadrant D Data is divided into 100 sec bins |
 |
 |
| Parameter | Plot |
|---|---|
| CZT HV Monitor | 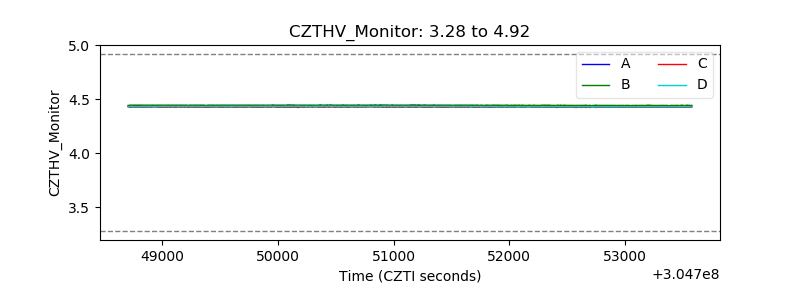 |
| D_VDD | 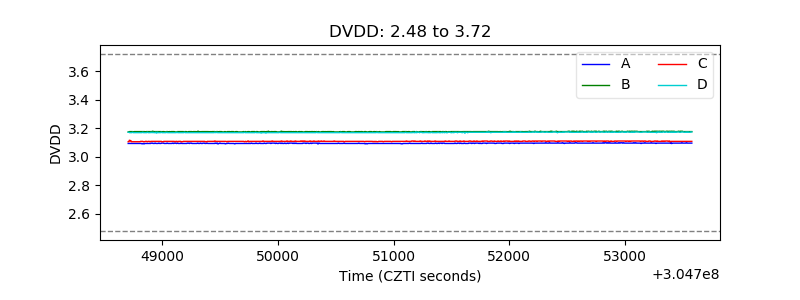 |
| Temperature 1 | 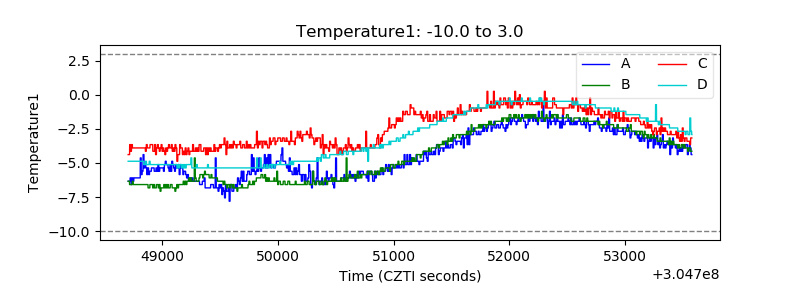 |
| Veto HV Monitor | 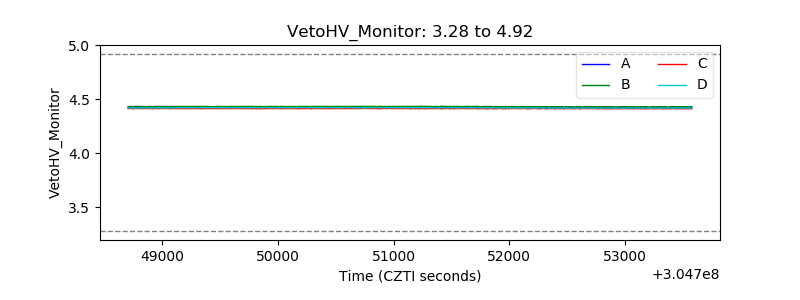 |
| Veto LLD | 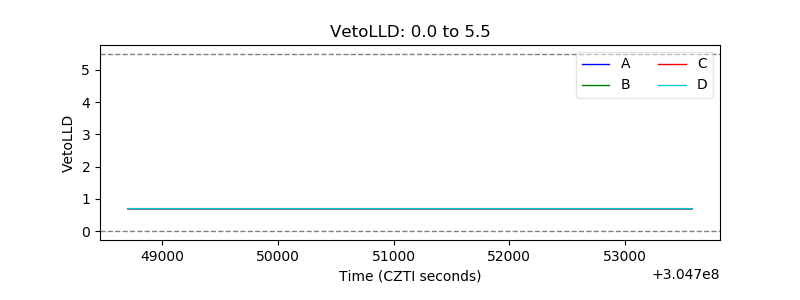 |
| Alpha Counter | 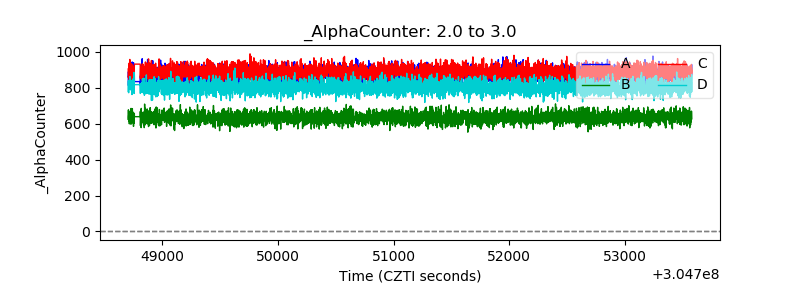 |
| _CPM_Rate | 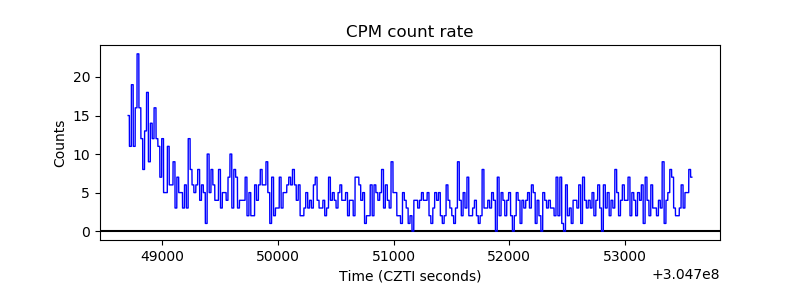 |
| CZT Counter | 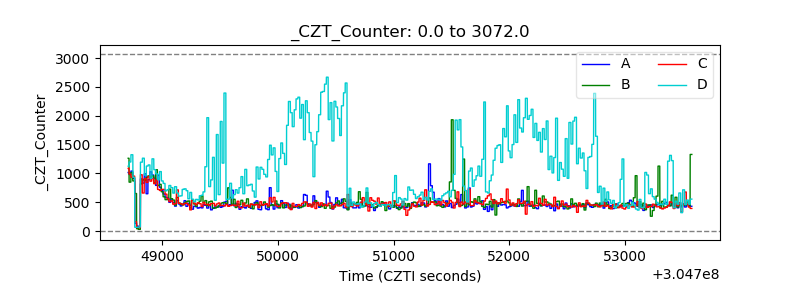 |
| +2.5 Volts monitor |  |
| +5 Volts monitor |  |
| _ROLL_ROT | 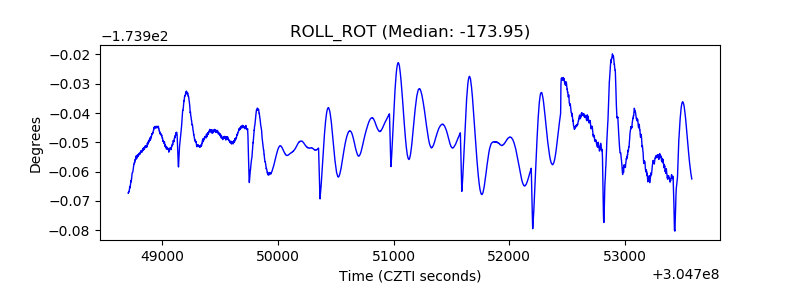 |
| _Roll_DEC | 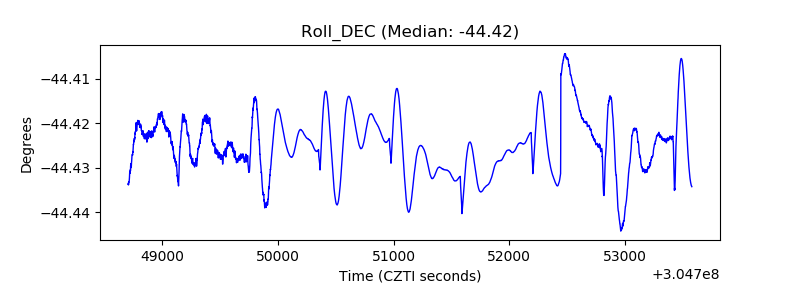 |
| _Roll_RA | 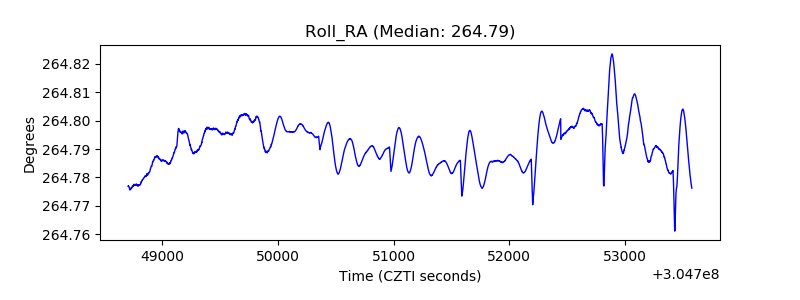 |
| Veto Counter | 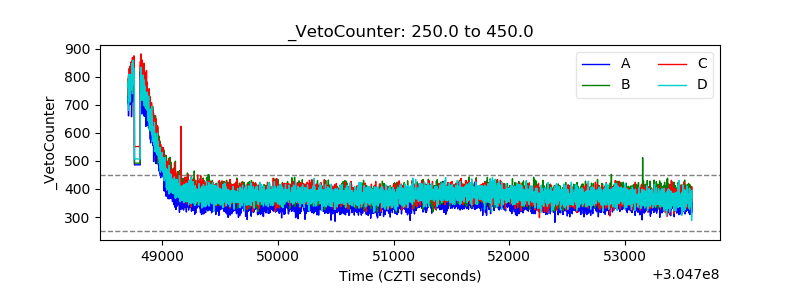 |