| Param | Original file | Final file |
|---|---|---|
| Filename | modeM0/AS1A06_009T02_9000003130cztM0_level2.fits | modeM0/AS1A06_009T02_9000003130cztM0_level2_quad_clean.evt |
| Size (bytes) | 88,992,000 | 52,899,840 |
| Size | 84.9 MB | 50.4 MB |
| Events in quadrant A | 554,104 | 257,538 |
| Events in quadrant B | 527,518 | 252,934 |
| Events in quadrant C | 534,280 | 246,278 |
| Events in quadrant D | 450,574 | 215,216 |
| Mode SS | |||
|---|---|---|---|
| Quadrant | BADHDUFLAG | Total packets | Discarded packets |
| A | 0 | 186 | 0 |
| B | 0 | 186 | 0 |
| C | 0 | 186 | 0 |
| D | 0 | 186 | 0 |
| Mode M9 | |||
|---|---|---|---|
| Quadrant | BADHDUFLAG | Total packets | Discarded packets |
| A | 0 | 20 | 0 |
| B | 0 | 20 | 0 |
| C | 0 | 20 | 0 |
| D | 0 | 20 | 0 |
| Mode M0 | |||
|---|---|---|---|
| Quadrant | BADHDUFLAG | Total packets | Discarded packets |
| A | 0 | 20109 | 0 |
| B | 0 | 19918 | 0 |
| C | 0 | 19107 | 0 |
| D | 0 | 29422 | 0 |
| Quadrant | Total seconds | Saturated seconds | Saturation percentage |
|---|---|---|---|
| A | 9060 | 119 | 1.313466% |
| B | 9060 | 82 | 0.905077% |
| C | 9060 | 98 | 1.081678% |
| D | 9060 | 444 | 4.900662% |
Noise dominated data is calculated using 1-second bins in cleaned event files. If a bin has >2000 counts, and if more than 50% of those come from <1% of pixels, then it is considered to be noise-dominated and hence unusable.
| Quadrant | # 1 sec bins | Bins with >0 counts | Bins with >2000 counts | High rate bins dominated by noise | Noise dominated (total time) | Noise dominated (detector-on time) | Marked lightcurve |
|---|---|---|---|---|---|---|---|
| A | 11170 | 9059 | 0 | 0 | 0.00% | 0.00% |  |
| B | 11170 | 9060 | 0 | 0 | 0.00% | 0.00% |  |
| C | 11170 | 9060 | 0 | 0 | 0.00% | 0.00% |  |
| D | 11170 | 9046 | 0 | 0 | 0.00% | 0.00% |  |
Top three noisy pixels from each quadrant. If the there are fewer than three noisy pixels in the level2.evt file, extra rows are filled as -1
| Pixel properties | Quadrant properties | ||||||
|---|---|---|---|---|---|---|---|
| Quadrant | DetID | PixID | Counts | Sigma | Mean | Median | Sigma |
| A | 0 | 29 | 550 | 11.15 | 144 | 136 | 37.1 |
| A | 7 | 110 | 505 | 9.94 | 144 | 136 | 37.1 |
| A | 0 | 30 | 432 | 7.97 | 144 | 136 | 37.1 |
| B | 2 | 9 | 442 | 10.43 | 139 | 133 | 29.6 |
| B | 2 | 8 | 367 | 7.9 | 139 | 133 | 29.6 |
| B | 5 | 225 | 366 | 7.86 | 139 | 133 | 29.6 |
| C | 1 | 81 | 409 | 7.23 | 140 | 132 | 38.3 |
| C | 1 | 80 | 394 | 6.84 | 140 | 132 | 38.3 |
| C | 2 | 191 | 385 | 6.6 | 140 | 132 | 38.3 |
| D | 3 | 159 | 325 | 5.8 | 129 | 118 | 35.7 |
| D | 10 | 189 | 321 | 5.69 | 129 | 118 | 35.7 |
| D | 6 | 38 | 320 | 5.66 | 129 | 118 | 35.7 |
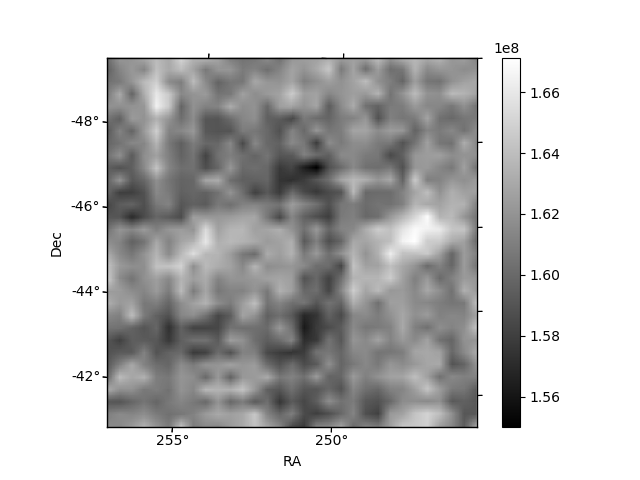
Histogram calculated using DETX and DETY for each event in the final _common_clean file
| Quadrant A | 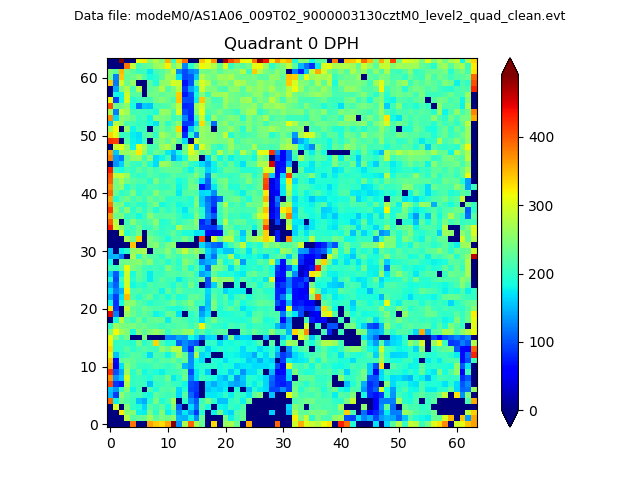 |
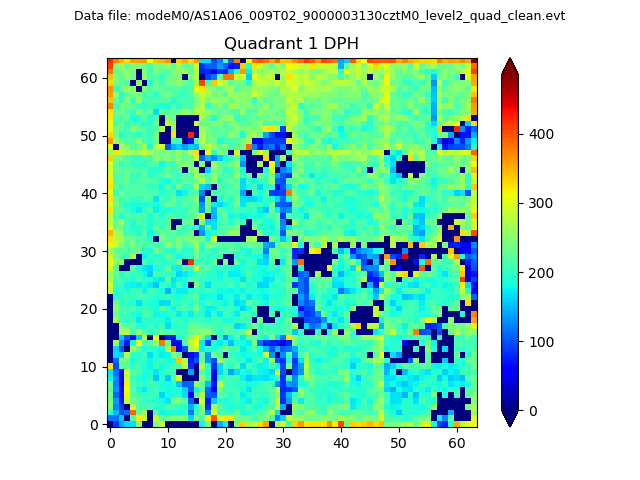 |
Quadrant B |
|---|---|---|---|
| Quadrant D | 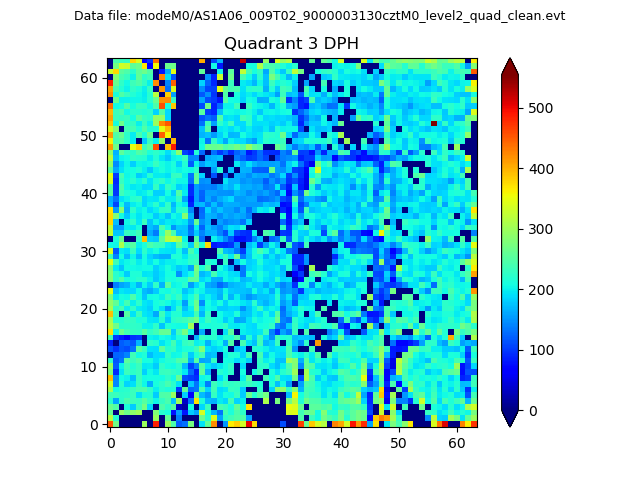 |
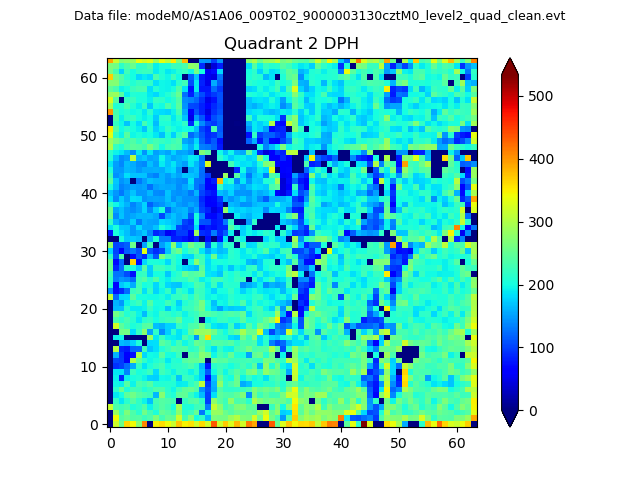 |
Quadrant C |
| Plot type | Count rate plots | Images |
|---|---|---|
| Comparison with Poisson distribution Blue bars denote a histogram of data divided into 1 sec bins. Red curve is a Poisson curve with rate = median count rate of data. |
 |
 |
| Quadrant-wise count rates Data is divided into 100 sec bins |
 |
|
| Module-wise count rates for Quadrant A Data is divided into 100 sec bins |
 |
 |
| Module-wise count rates for Quadrant B Data is divided into 100 sec bins |
 |
 |
| Module-wise count rates for Quadrant C Data is divided into 100 sec bins |
 |
 |
| Module-wise count rates for Quadrant D Data is divided into 100 sec bins |
 |
 |
| Parameter | Plot |
|---|---|
| CZT HV Monitor |  |
| D_VDD |  |
| Temperature 1 | 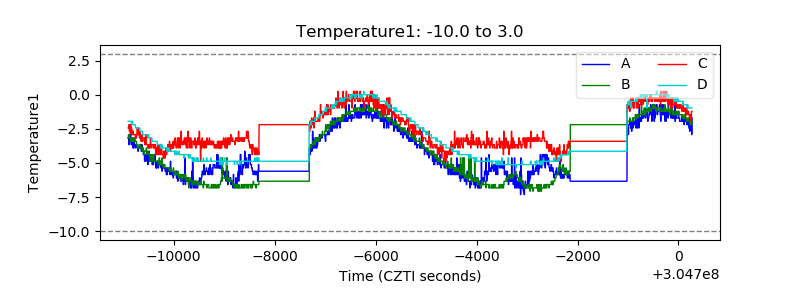 |
| Veto HV Monitor |  |
| Veto LLD |  |
| Alpha Counter |  |
| _CPM_Rate |  |
| CZT Counter |  |
| +2.5 Volts monitor |  |
| +5 Volts monitor |  |
| _ROLL_ROT |  |
| _Roll_DEC |  |
| _Roll_RA |  |
| Veto Counter |  |