| Param | Original file | Final file |
|---|---|---|
| Filename | modeM0/AS1A06_009T02_9000003130_21173cztM0_level2.evt | modeM0/AS1A06_009T02_9000003130_21173cztM0_level2_quad_clean.evt |
| Size (bytes) | 483,298,560 | 89,735,040 |
| Size | 460.9 MB | 85.6 MB |
| Events in quadrant A | 3,155,796 | 594,219 |
| Events in quadrant B | 3,165,960 | 593,436 |
| Events in quadrant C | 2,915,159 | 571,268 |
| Events in quadrant D | 4,991,702 | 538,382 |
| Mode SS | |||
|---|---|---|---|
| Quadrant | BADHDUFLAG | Total packets | Discarded packets |
| A | 0 | 122 | 0 |
| B | 0 | 122 | 0 |
| C | 0 | 122 | 0 |
| D | 0 | 122 | 0 |
| Mode M9 | |||
|---|---|---|---|
| Quadrant | BADHDUFLAG | Total packets | Discarded packets |
| A | 0 | 11 | 0 |
| B | 0 | 11 | 0 |
| C | 0 | 11 | 0 |
| D | 0 | 11 | 0 |
| Mode M0 | |||
|---|---|---|---|
| Quadrant | BADHDUFLAG | Total packets | Discarded packets |
| A | 0 | 13374 | 1 |
| B | 0 | 13328 | 1 |
| C | 0 | 12665 | 1 |
| D | 0 | 18909 | 1 |
| Quadrant | Total seconds | Saturated seconds | Saturation percentage |
|---|---|---|---|
| A | 6017 | 79 | 1.312947% |
| B | 6018 | 51 | 0.847458% |
| C | 6018 | 62 | 1.030243% |
| D | 6018 | 235 | 3.904952% |
Noise dominated data is calculated using 1-second bins in cleaned event files. If a bin has >2000 counts, and if more than 50% of those come from <1% of pixels, then it is considered to be noise-dominated and hence unusable.
| Quadrant | # 1 sec bins | Bins with >0 counts | Bins with >2000 counts | High rate bins dominated by noise | Noise dominated (total time) | Noise dominated (detector-on time) | Marked lightcurve |
|---|---|---|---|---|---|---|---|
| A | 7137 | 6017 | 22 | 22 | 0.31% | 0.37% | 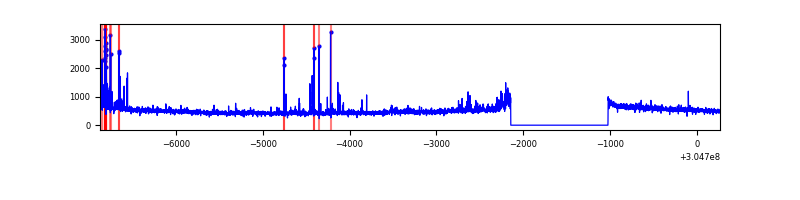 |
| B | 7138 | 6019 | 5 | 5 | 0.07% | 0.08% | 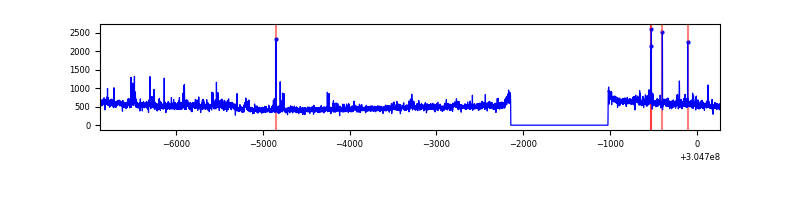 |
| C | 7138 | 6019 | 0 | 0 | 0.00% | 0.00% | 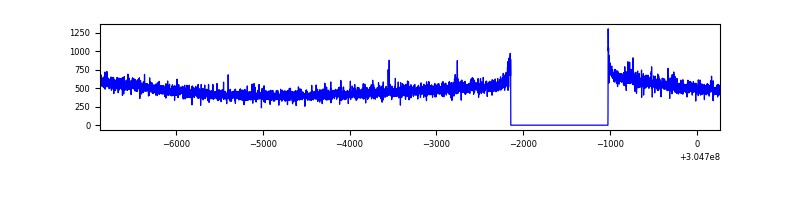 |
| D | 7138 | 6019 | 179 | 179 | 2.51% | 2.97% | 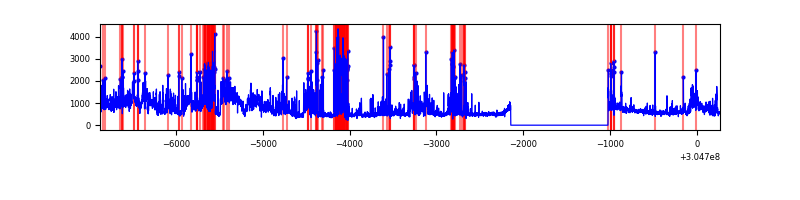 |
Top three noisy pixels from each quadrant. If the there are fewer than three noisy pixels in the level2.evt file, extra rows are filled as -1
| Pixel properties | Quadrant properties | ||||||
|---|---|---|---|---|---|---|---|
| Quadrant | DetID | PixID | Counts | Sigma | Mean | Median | Sigma |
| A | 5 | 16 | 149248 | 978.9 | 754 | 739 | 151.7 |
| A | 10 | 229 | 84986 | 555.31 | 754 | 739 | 151.7 |
| A | 13 | 254 | 9277 | 56.28 | 754 | 739 | 151.7 |
| B | 0 | 189 | 75031 | 516.07 | 747 | 730 | 144.0 |
| B | 0 | 229 | 36396 | 247.72 | 747 | 730 | 144.0 |
| B | 0 | 190 | 34244 | 232.78 | 747 | 730 | 144.0 |
| C | 14 | 238 | 110741 | 662.84 | 709 | 713 | 166.0 |
| C | 3 | 233 | 36773 | 217.23 | 709 | 713 | 166.0 |
| C | 13 | 61 | 4984 | 25.73 | 709 | 713 | 166.0 |
| D | 1 | 20 | 860141 | 4910.89 | 714 | 694 | 175.0 |
| D | 1 | 52 | 722670 | 4125.38 | 714 | 694 | 175.0 |
| D | 13 | 153 | 238328 | 1357.84 | 714 | 694 | 175.0 |
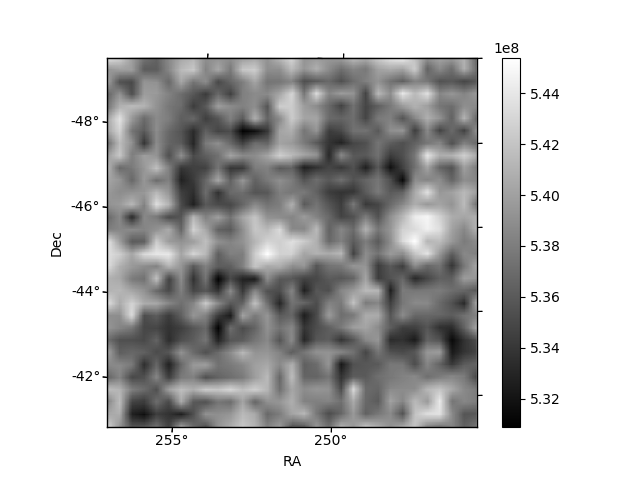
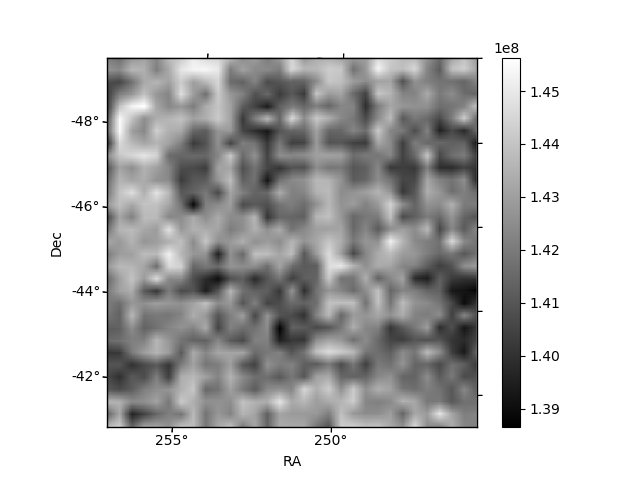
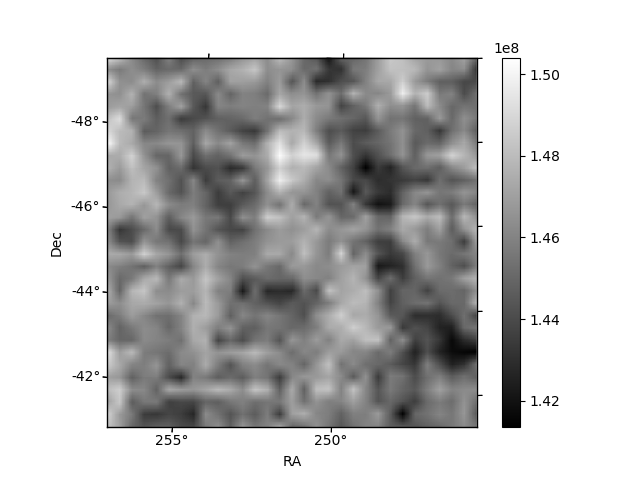
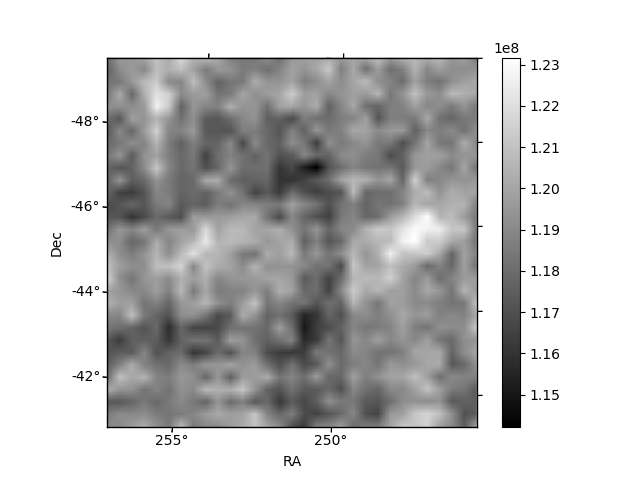
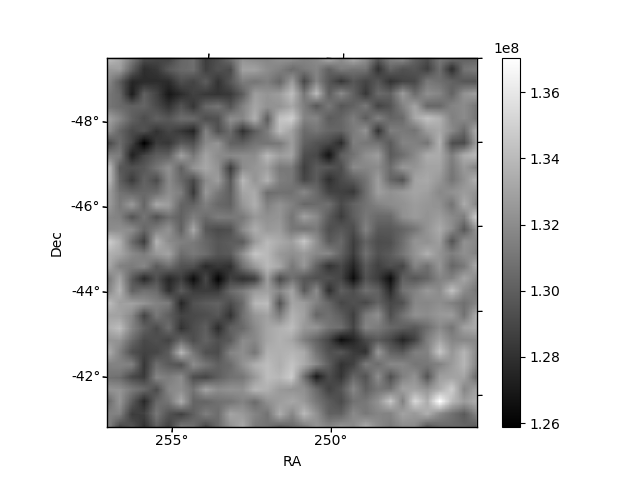
Histogram calculated using DETX and DETY for each event in the final _common_clean file
| Quadrant A | 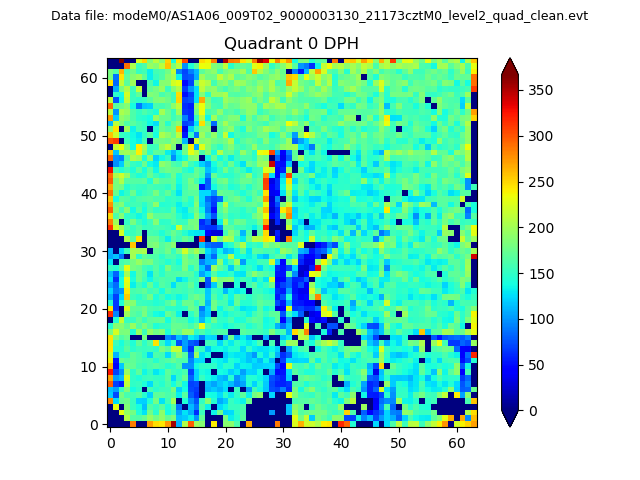 |
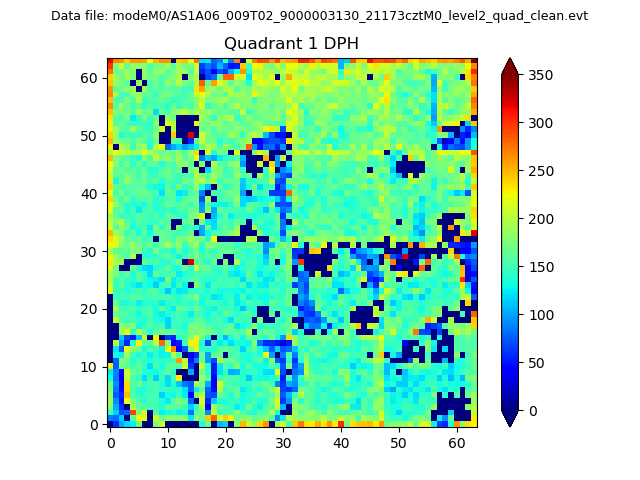 |
Quadrant B |
|---|---|---|---|
| Quadrant D | 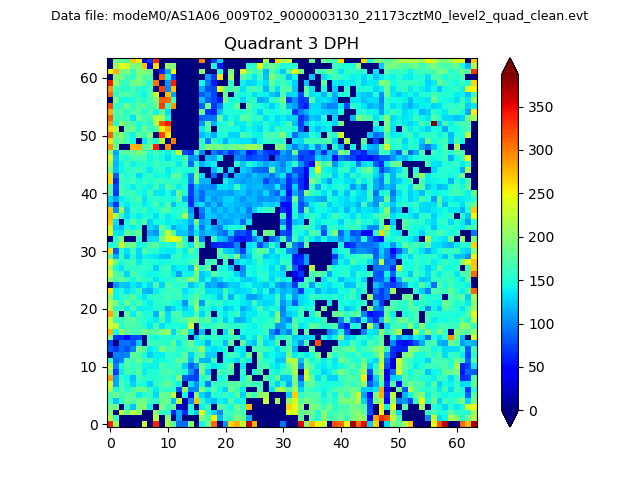 |
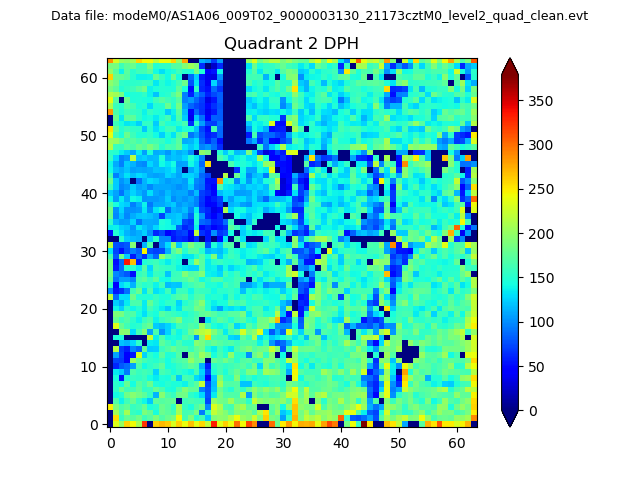 |
Quadrant C |
| Plot type | Count rate plots | Images |
|---|---|---|
| Comparison with Poisson distribution Blue bars denote a histogram of data divided into 1 sec bins. Red curve is a Poisson curve with rate = median count rate of data. |
 |
 |
| Quadrant-wise count rates Data is divided into 100 sec bins |
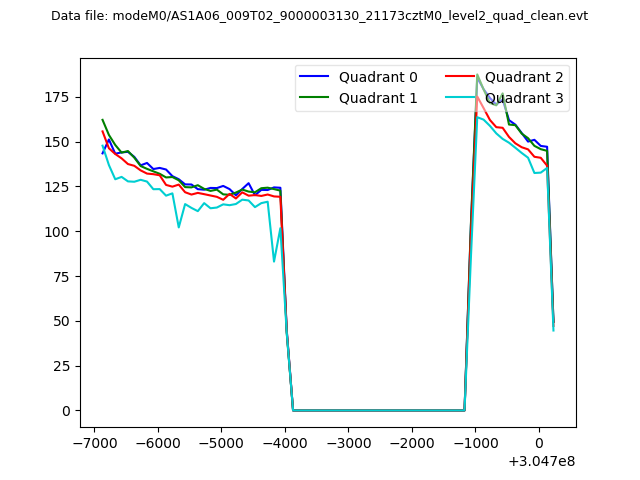 |
|
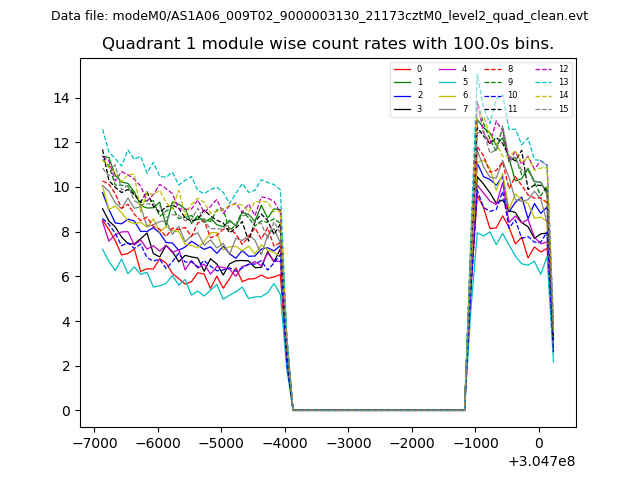
| Module-wise count rates for Quadrant A Data is divided into 100 sec bins |
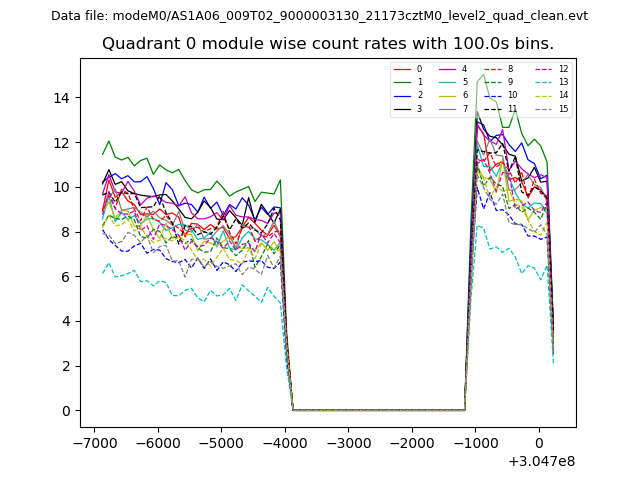 |
 |
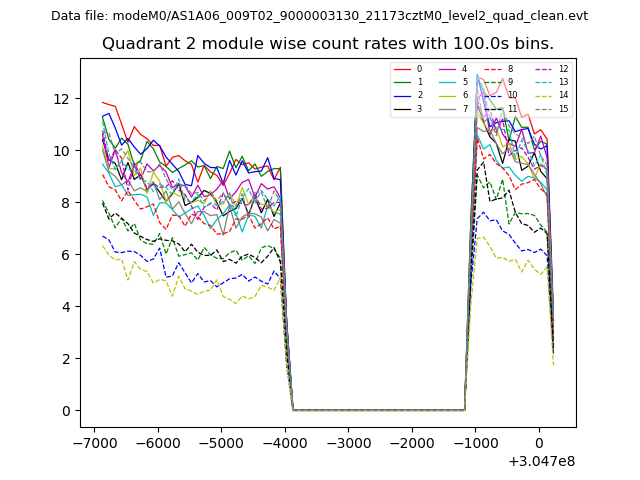
| Module-wise count rates for Quadrant B Data is divided into 100 sec bins |
 |
 |
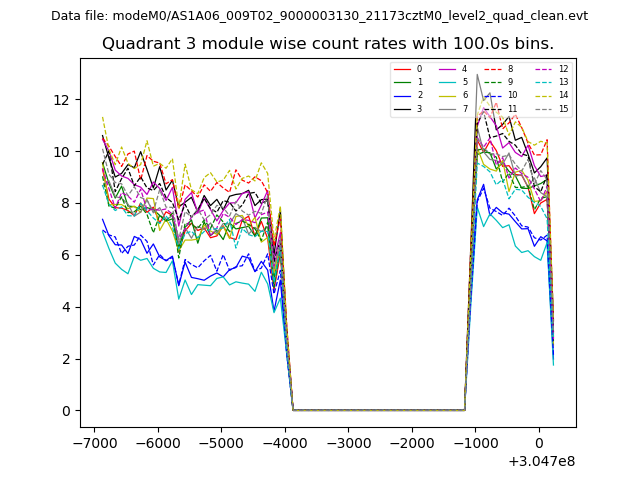
| Module-wise count rates for Quadrant C Data is divided into 100 sec bins |
 |
 |
| Module-wise count rates for Quadrant D Data is divided into 100 sec bins |
 |
 |
| Parameter | Plot |
|---|---|
| CZT HV Monitor | 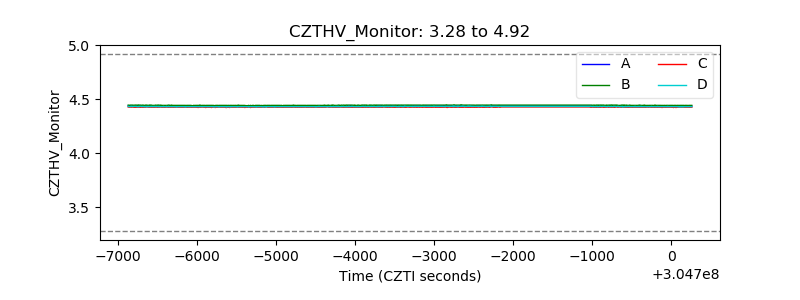 |
| D_VDD | 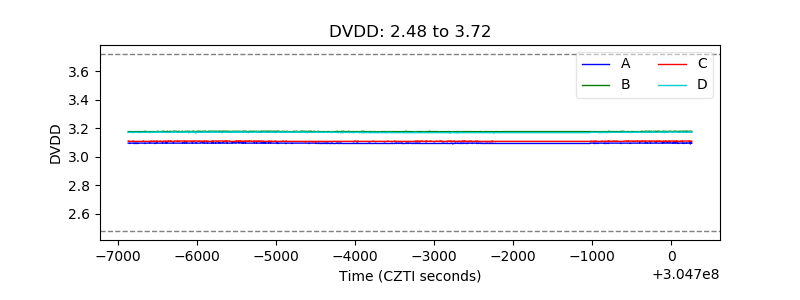 |
| Temperature 1 | 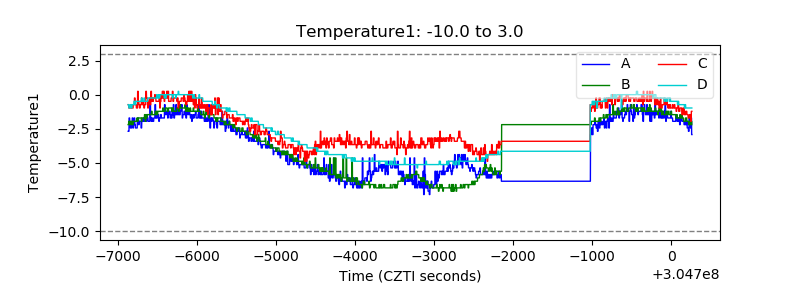 |
| Veto HV Monitor | 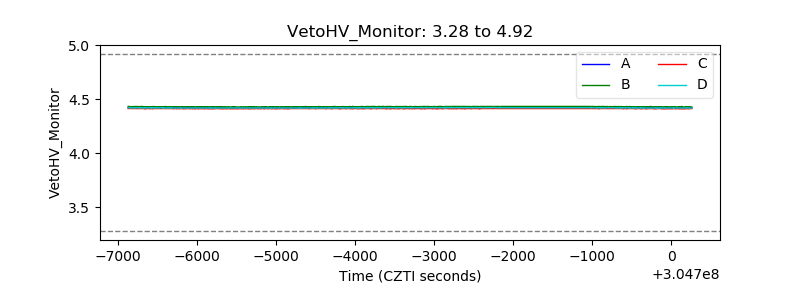 |
| Veto LLD | 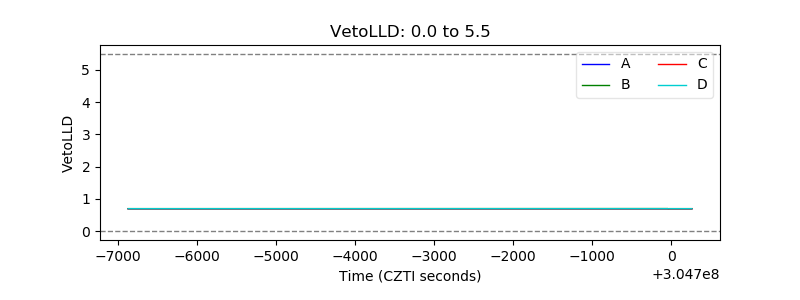 |
| Alpha Counter |  |
| _CPM_Rate | 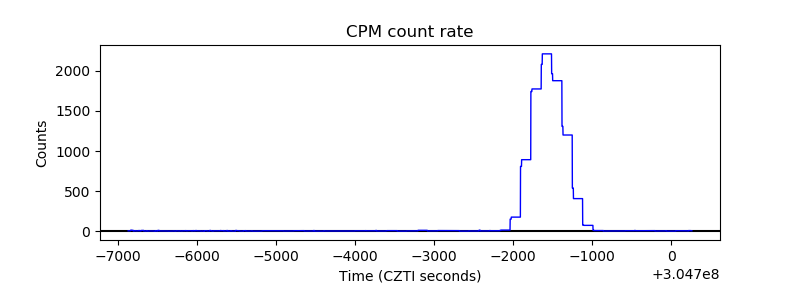 |
| CZT Counter |  |
| +2.5 Volts monitor |  |
| +5 Volts monitor |  |
| _ROLL_ROT | 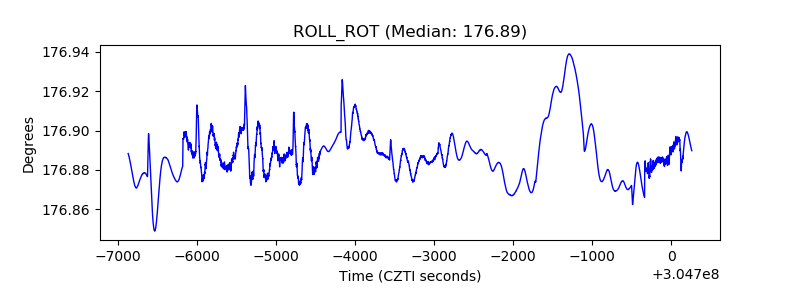 |
| _Roll_DEC | 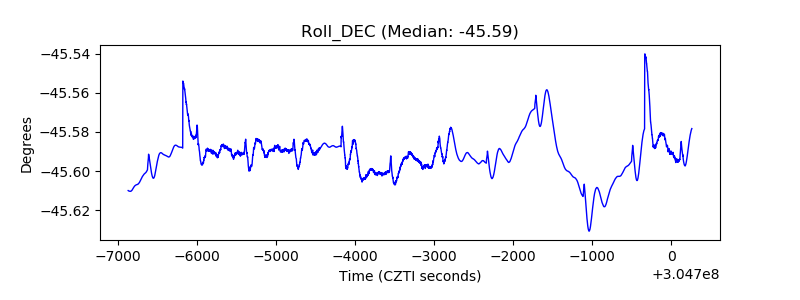 |
| _Roll_RA |  |
| Veto Counter | 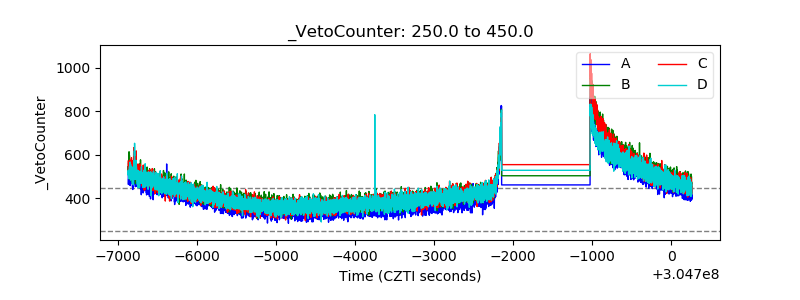 |