| Param | Original file | Final file |
|---|---|---|
| Filename | modeM0/AS1A06_009T02_9000003130_21174cztM0_level2.evt | modeM0/AS1A06_009T02_9000003130_21174cztM0_level2_quad_clean.evt |
| Size (bytes) | 62,536,320 | 17,383,680 |
| Size | 59.6 MB | 16.6 MB |
| Events in quadrant A | 420,981 | 120,146 |
| Events in quadrant B | 455,848 | 119,602 |
| Events in quadrant C | 404,051 | 113,303 |
| Events in quadrant D | 556,368 | 110,500 |
| Mode SS | |||
|---|---|---|---|
| Quadrant | BADHDUFLAG | Total packets | Discarded packets |
| A | 0 | 16 | 0 |
| B | 0 | 16 | 0 |
| C | 0 | 16 | 0 |
| D | 0 | 16 | 0 |
| Mode M0 | |||
|---|---|---|---|
| Quadrant | BADHDUFLAG | Total packets | Discarded packets |
| A | 0 | 1670 | 0 |
| B | 0 | 1838 | 0 |
| C | 0 | 1630 | 0 |
| D | 0 | 2178 | 0 |
| Quadrant | Total seconds | Saturated seconds | Saturation percentage |
|---|---|---|---|
| A | 784 | 3 | 0.382653% |
| B | 785 | 4 | 0.509554% |
| C | 785 | 5 | 0.636943% |
| D | 785 | 5 | 0.636943% |
Noise dominated data is calculated using 1-second bins in cleaned event files. If a bin has >2000 counts, and if more than 50% of those come from <1% of pixels, then it is considered to be noise-dominated and hence unusable.
| Quadrant | # 1 sec bins | Bins with >0 counts | Bins with >2000 counts | High rate bins dominated by noise | Noise dominated (total time) | Noise dominated (detector-on time) | Marked lightcurve |
|---|---|---|---|---|---|---|---|
| A | 784 | 784 | 0 | 0 | 0.00% | 0.00% | 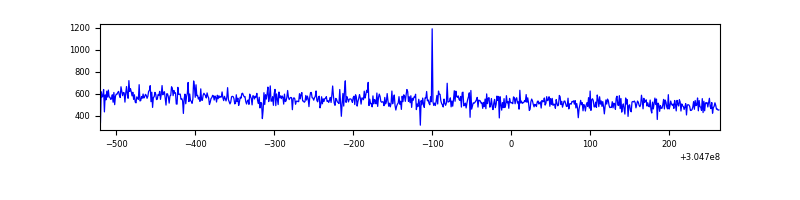 |
| B | 785 | 785 | 2 | 2 | 0.25% | 0.25% | 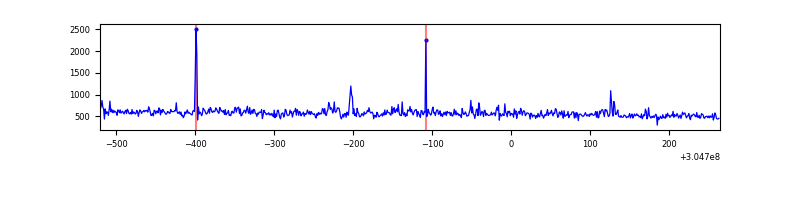 |
| C | 785 | 785 | 0 | 0 | 0.00% | 0.00% | 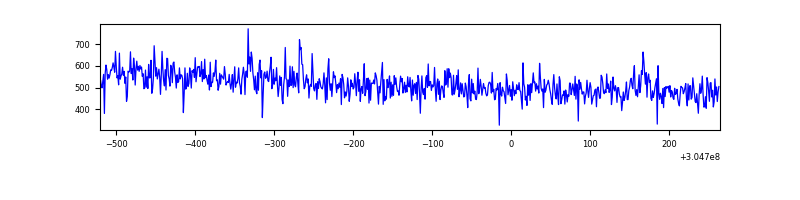 |
| D | 785 | 785 | 3 | 3 | 0.38% | 0.38% | 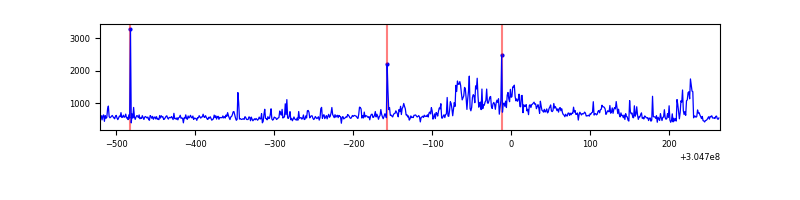 |
Top three noisy pixels from each quadrant. If the there are fewer than three noisy pixels in the level2.evt file, extra rows are filled as -1
| Pixel properties | Quadrant properties | ||||||
|---|---|---|---|---|---|---|---|
| Quadrant | DetID | PixID | Counts | Sigma | Mean | Median | Sigma |
| A | 15 | 236 | 4282 | 176.94 | 107 | 105 | 23.6 |
| A | 13 | 254 | 1090 | 41.72 | 107 | 105 | 23.6 |
| A | 0 | 226 | 1009 | 38.29 | 107 | 105 | 23.6 |
| B | 0 | 229 | 15062 | 669.26 | 104 | 102 | 22.4 |
| B | 0 | 190 | 10449 | 462.89 | 104 | 102 | 22.4 |
| B | 3 | 64 | 7276 | 320.94 | 104 | 102 | 22.4 |
| C | 14 | 238 | 15450 | 626.78 | 97 | 98 | 24.5 |
| C | 3 | 233 | 6858 | 275.99 | 97 | 98 | 24.5 |
| C | 13 | 61 | 726 | 25.64 | 97 | 98 | 24.5 |
| D | 1 | 20 | 91763 | 3434.69 | 102 | 98 | 26.7 |
| D | 13 | 153 | 26789 | 1000.11 | 102 | 98 | 26.7 |
| D | 13 | 104 | 21040 | 784.7 | 102 | 98 | 26.7 |
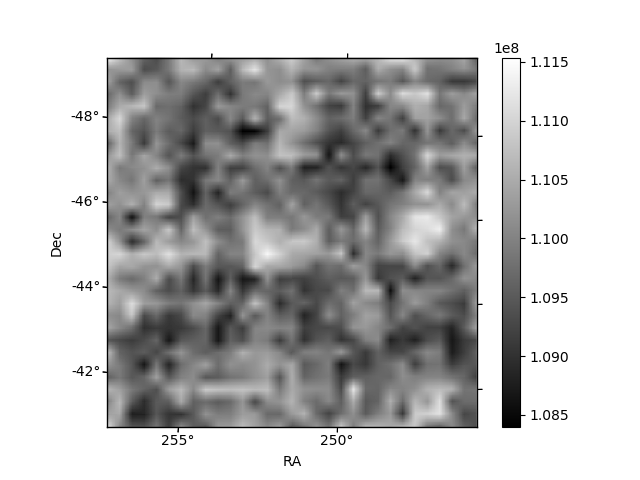
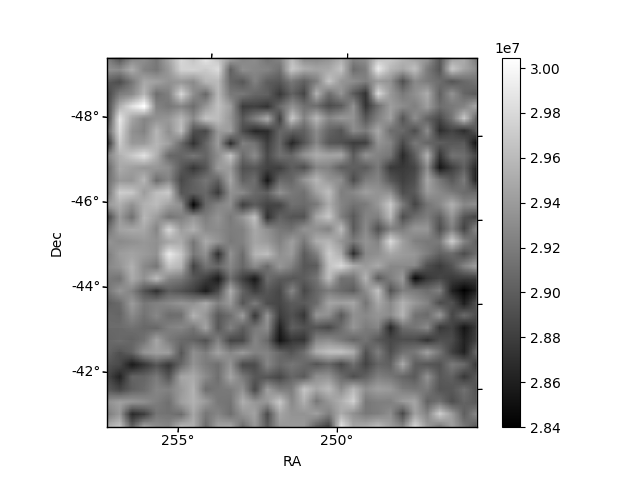
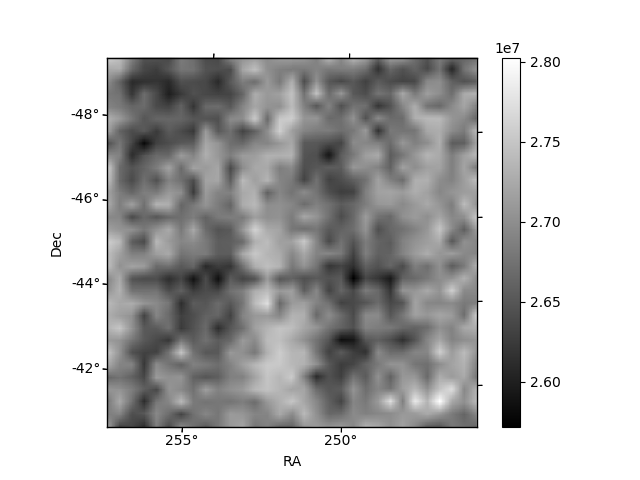
Histogram calculated using DETX and DETY for each event in the final _common_clean file
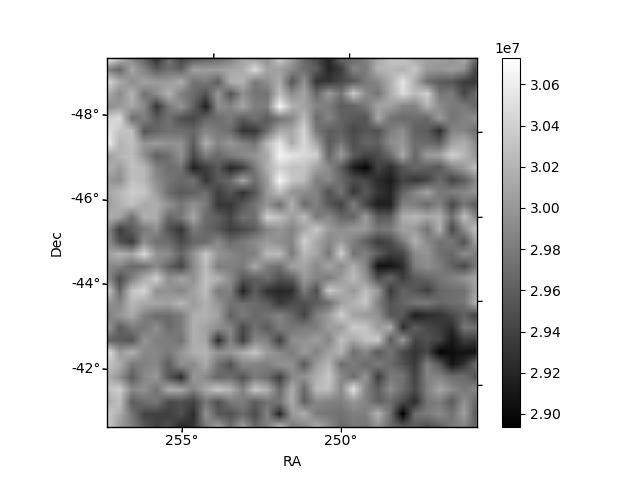
| Quadrant A | 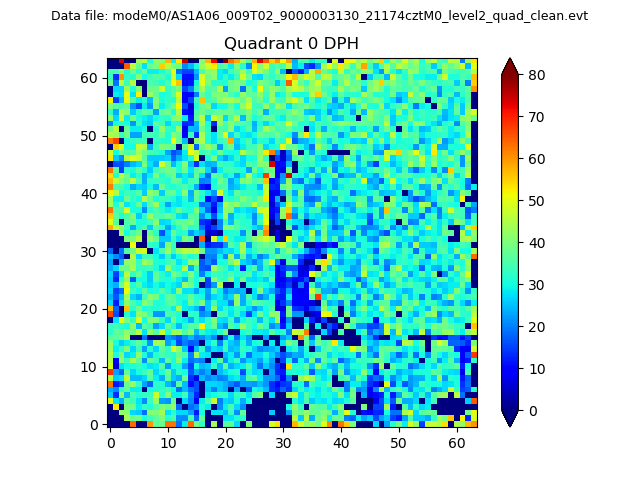 |
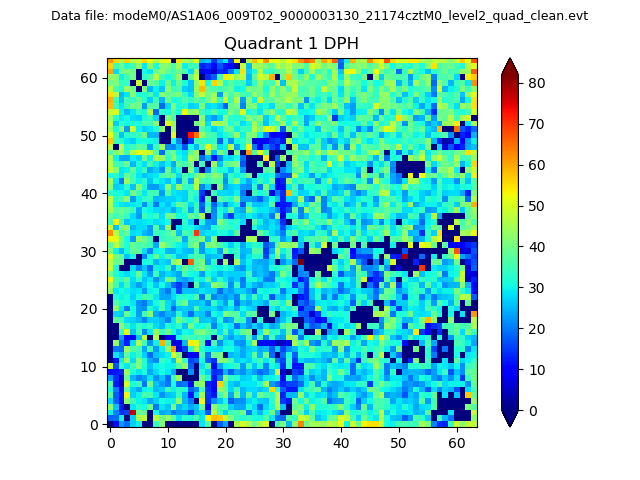 |
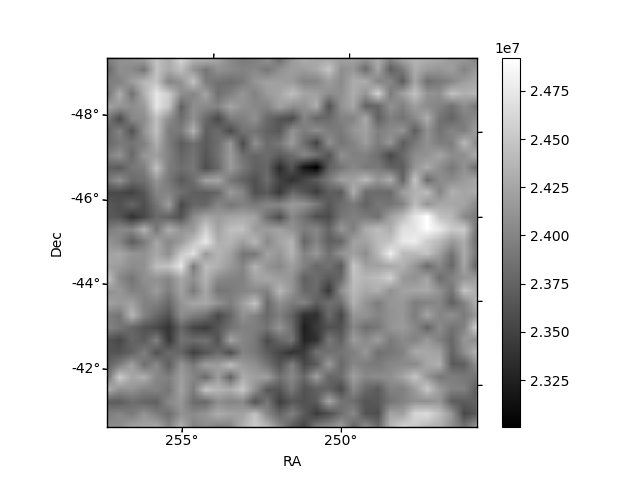
Quadrant B |
|---|---|---|---|
| Quadrant D | 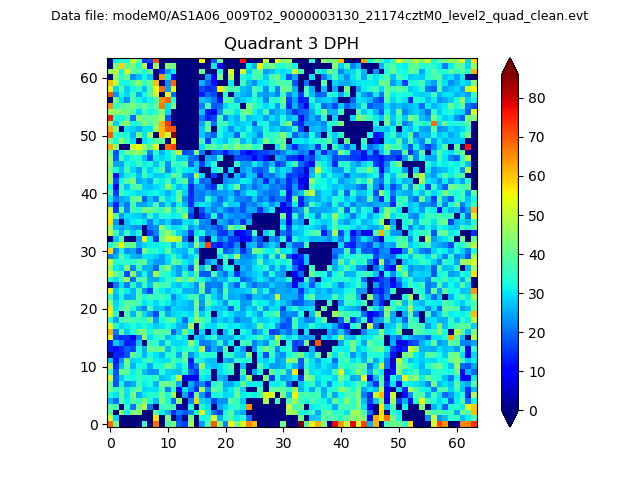 |
 |
Quadrant C |
| Plot type | Count rate plots | Images |
|---|---|---|
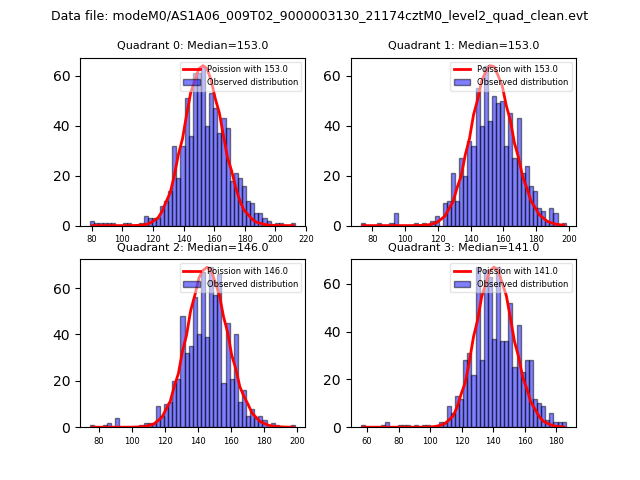
| Comparison with Poisson distribution Blue bars denote a histogram of data divided into 1 sec bins. Red curve is a Poisson curve with rate = median count rate of data. |
 |
 |
| Quadrant-wise count rates Data is divided into 100 sec bins |
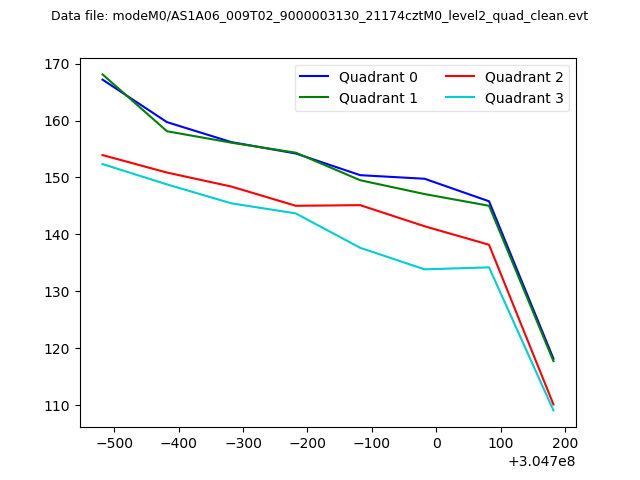 |
|
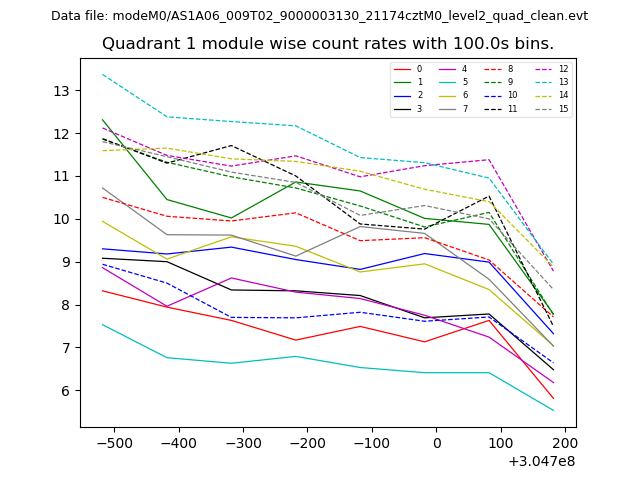
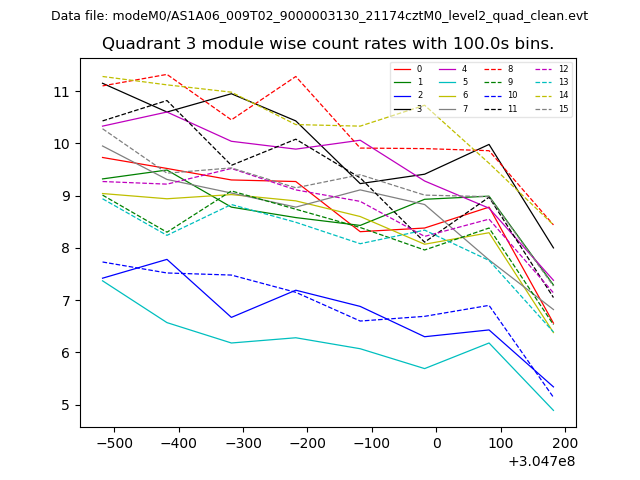
| Module-wise count rates for Quadrant A Data is divided into 100 sec bins |
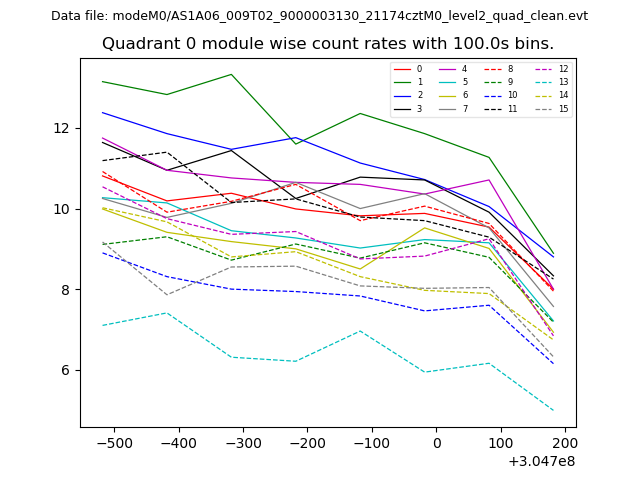 |
 |
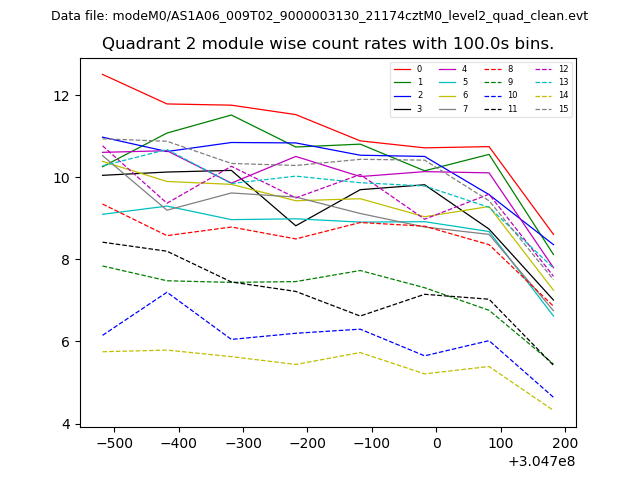
| Module-wise count rates for Quadrant B Data is divided into 100 sec bins |
 |
 |
| Module-wise count rates for Quadrant C Data is divided into 100 sec bins |
 |
 |
| Module-wise count rates for Quadrant D Data is divided into 100 sec bins |
 |
 |
| Parameter | Plot |
|---|---|
| CZT HV Monitor | 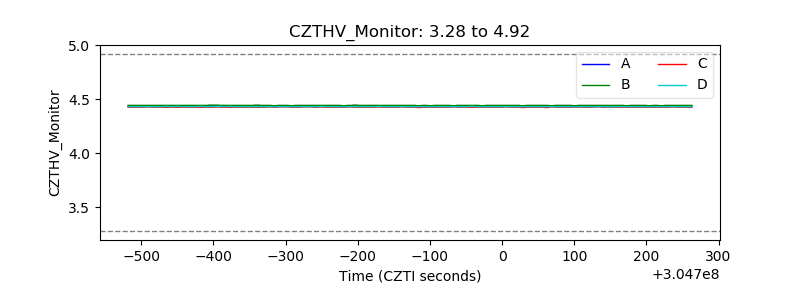 |
| D_VDD | 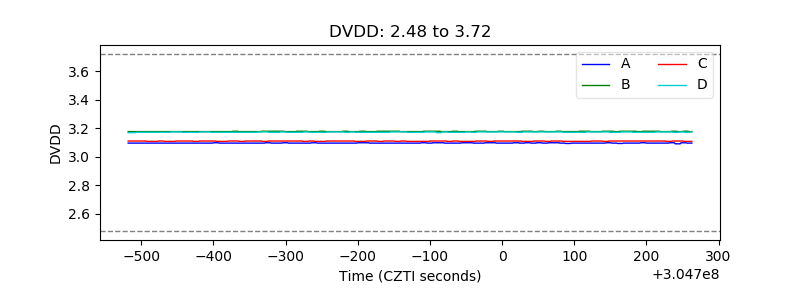 |
| Temperature 1 | 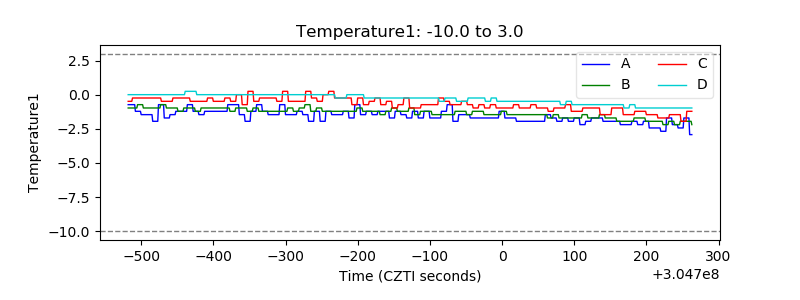 |
| Veto HV Monitor |  |
| Veto LLD | 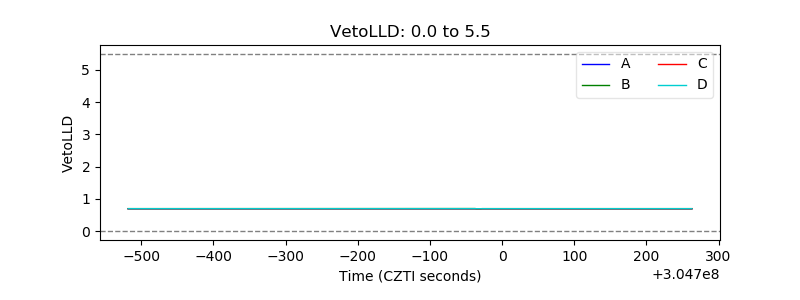 |
| Alpha Counter | 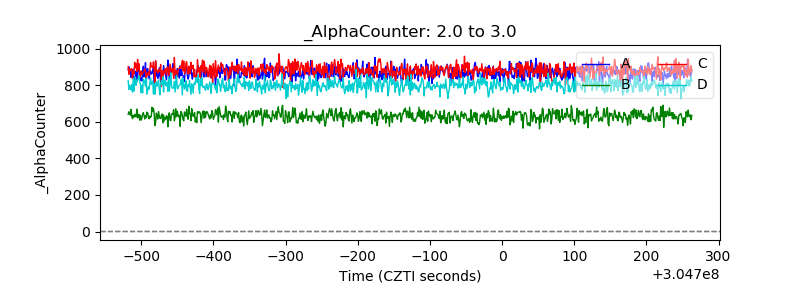 |
| _CPM_Rate | 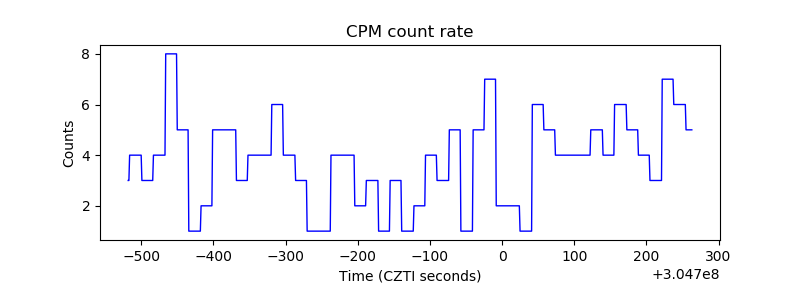 |
| CZT Counter | 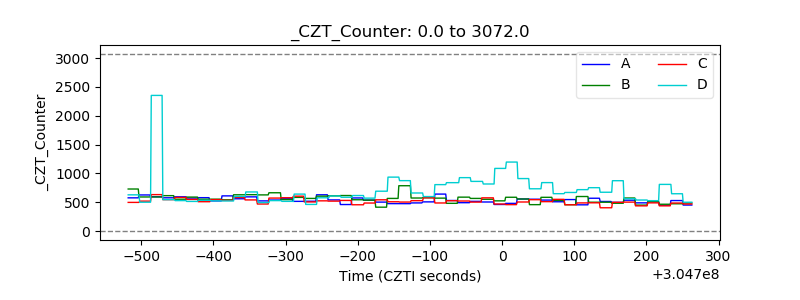 |
| +2.5 Volts monitor |  |
| +5 Volts monitor | 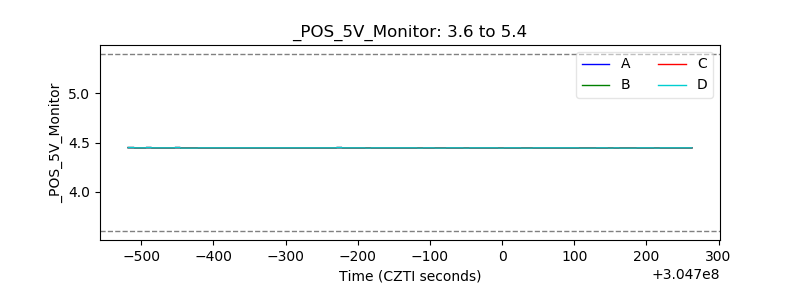 |
| _ROLL_ROT | 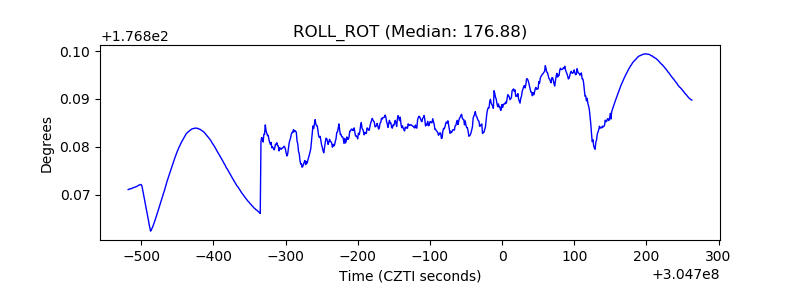 |
| _Roll_DEC | 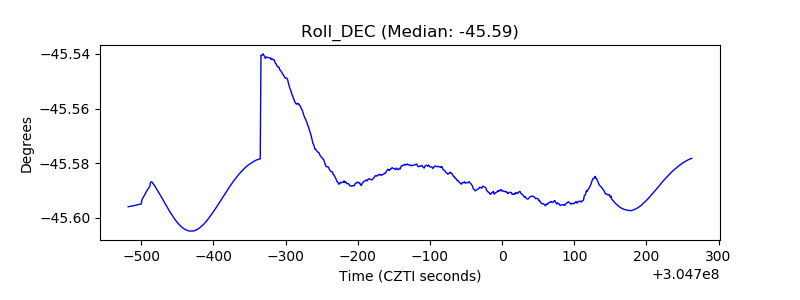 |
| _Roll_RA | 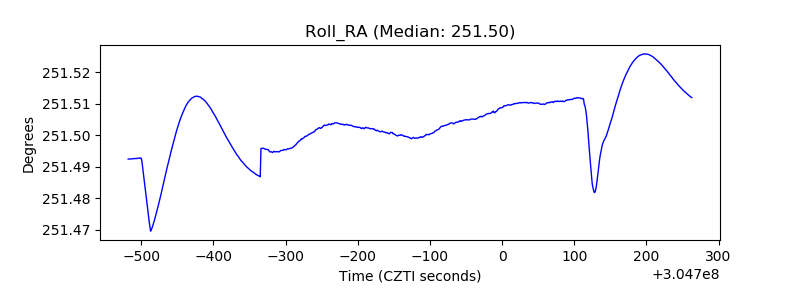 |
| Veto Counter | 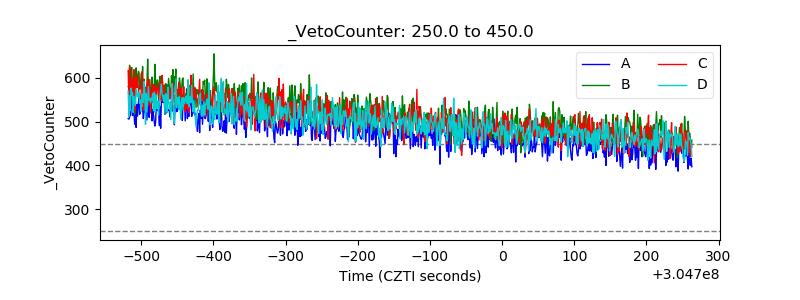 |