| Param | Original file | Final file |
|---|---|---|
| Filename | modeM0/AS1A06_009T03_9000003128cztM0_level2.fits | modeM0/AS1A06_009T03_9000003128cztM0_level2_quad_clean.evt |
| Size (bytes) | 78,704,640 | 73,082,880 |
| Size | 75.1 MB | 69.7 MB |
| Events in quadrant A | 484,884 | 446,085 |
| Events in quadrant B | 466,310 | 445,363 |
| Events in quadrant C | 476,798 | 428,742 |
| Events in quadrant D | 371,756 | 308,979 |
| Mode M0 | |||
|---|---|---|---|
| Quadrant | BADHDUFLAG | Total packets | Discarded packets |
| A | 0 | 17476 | 0 |
| B | 0 | 17947 | 0 |
| C | 0 | 17207 | 0 |
| D | 0 | 41812 | 0 |
| Mode M9 | |||
|---|---|---|---|
| Quadrant | BADHDUFLAG | Total packets | Discarded packets |
| A | 0 | 13 | 0 |
| B | 0 | 13 | 0 |
| C | 0 | 13 | 0 |
| D | 0 | 13 | 0 |
| Mode SS | |||
|---|---|---|---|
| Quadrant | BADHDUFLAG | Total packets | Discarded packets |
| A | 0 | 174 | 0 |
| B | 0 | 174 | 0 |
| C | 0 | 174 | 0 |
| D | 0 | 174 | 0 |
| Quadrant | Total seconds | Saturated seconds | Saturation percentage |
|---|---|---|---|
| A | 8387 | 123 | 1.466555% |
| B | 8387 | 137 | 1.633480% |
| C | 8387 | 154 | 1.836175% |
| D | 8387 | 1777 | 21.187552% |
Noise dominated data is calculated using 1-second bins in cleaned event files. If a bin has >2000 counts, and if more than 50% of those come from <1% of pixels, then it is considered to be noise-dominated and hence unusable.
| Quadrant | # 1 sec bins | Bins with >0 counts | Bins with >2000 counts | High rate bins dominated by noise | Noise dominated (total time) | Noise dominated (detector-on time) | Marked lightcurve |
|---|---|---|---|---|---|---|---|
| A | 9807 | 8385 | 0 | 0 | 0.00% | 0.00% |  |
| B | 9807 | 8386 | 0 | 0 | 0.00% | 0.00% |  |
| C | 9807 | 8385 | 0 | 0 | 0.00% | 0.00% |  |
| D | 9807 | 8382 | 0 | 0 | 0.00% | 0.00% |  |
Top three noisy pixels from each quadrant. If the there are fewer than three noisy pixels in the level2.evt file, extra rows are filled as -1
| Pixel properties | Quadrant properties | ||||||
|---|---|---|---|---|---|---|---|
| Quadrant | DetID | PixID | Counts | Sigma | Mean | Median | Sigma |
| A | 0 | 29 | 435 | 9.36 | 126 | 118 | 33.9 |
| A | 7 | 110 | 392 | 8.09 | 126 | 118 | 33.9 |
| A | 9 | 19 | 380 | 7.73 | 126 | 118 | 33.9 |
| B | 2 | 9 | 393 | 10.23 | 123 | 117 | 27.0 |
| B | 2 | 8 | 337 | 8.15 | 123 | 117 | 27.0 |
| B | 3 | 17 | 333 | 8.01 | 123 | 117 | 27.0 |
| C | 1 | 80 | 381 | 7.75 | 125 | 117 | 34.1 |
| C | 1 | 81 | 371 | 7.45 | 125 | 117 | 34.1 |
| C | 2 | 191 | 338 | 6.49 | 125 | 117 | 34.1 |
| D | 4 | 246 | 300 | 6.96 | 105 | 96 | 29.3 |
| D | 6 | 67 | 286 | 6.49 | 105 | 96 | 29.3 |
| D | 6 | 83 | 263 | 5.7 | 105 | 96 | 29.3 |
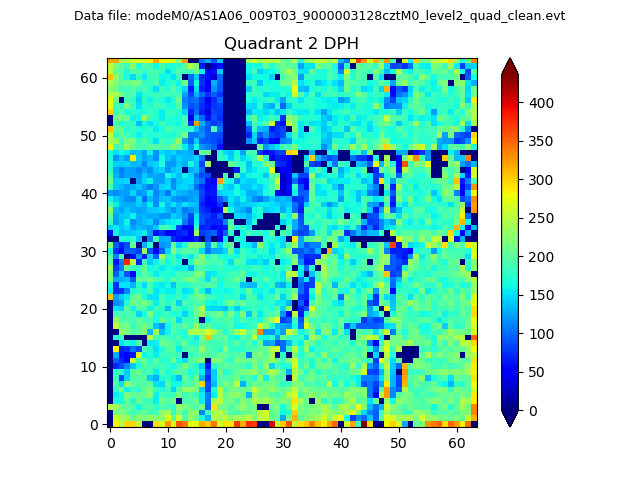
Histogram calculated using DETX and DETY for each event in the final _common_clean file
| Quadrant A |  |
 |
Quadrant B |
|---|---|---|---|
| Quadrant D |  |
 |
Quadrant C |
| Plot type | Count rate plots | Images |
|---|---|---|
| Comparison with Poisson distribution Blue bars denote a histogram of data divided into 1 sec bins. Red curve is a Poisson curve with rate = median count rate of data. |
 |
 |
| Quadrant-wise count rates Data is divided into 100 sec bins |
 |
|
| Module-wise count rates for Quadrant A Data is divided into 100 sec bins |
 |
 |
| Module-wise count rates for Quadrant B Data is divided into 100 sec bins |
 |
 |
| Module-wise count rates for Quadrant C Data is divided into 100 sec bins |
 |
 |
| Module-wise count rates for Quadrant D Data is divided into 100 sec bins |
 |
 |
| Parameter | Plot |
|---|---|
| CZT HV Monitor |  |
| D_VDD |  |
| Temperature 1 |  |
| Veto HV Monitor |  |
| Veto LLD |  |
| Alpha Counter |  |
| _CPM_Rate |  |
| CZT Counter |  |
| +2.5 Volts monitor |  |
| +5 Volts monitor |  |
| _ROLL_ROT |  |
| _Roll_DEC |  |
| _Roll_RA | 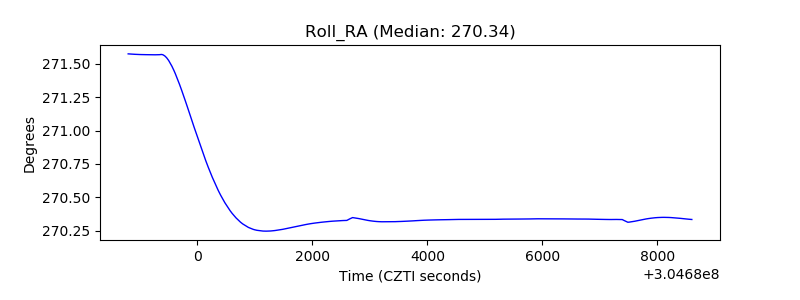 |
| Veto Counter |  |