| Param | Original file | Final file |
|---|---|---|
| Filename | modeM0/AS1A06_009T03_9000003128_21171cztM0_level2.evt | modeM0/AS1A06_009T03_9000003128_21171cztM0_level2_quad_clean.evt |
| Size (bytes) | 163,736,640 | 32,673,600 |
| Size | 156.2 MB | 31.2 MB |
| Events in quadrant A | 834,607 | 222,697 |
| Events in quadrant B | 938,853 | 225,561 |
| Events in quadrant C | 816,732 | 217,699 |
| Events in quadrant D | 2,251,292 | 198,691 |
| Mode M0 | |||
|---|---|---|---|
| Quadrant | BADHDUFLAG | Total packets | Discarded packets |
| A | 0 | 3451 | 0 |
| B | 0 | 3729 | 0 |
| C | 0 | 3428 | 0 |
| D | 0 | 7888 | 0 |
| Mode SS | |||
|---|---|---|---|
| Quadrant | BADHDUFLAG | Total packets | Discarded packets |
| A | 0 | 34 | 0 |
| B | 0 | 34 | 0 |
| C | 0 | 34 | 0 |
| D | 0 | 34 | 0 |
| Quadrant | Total seconds | Saturated seconds | Saturation percentage |
|---|---|---|---|
| A | 1692 | 3 | 0.177305% |
| B | 1693 | 5 | 0.295334% |
| C | 1693 | 4 | 0.236267% |
| D | 1693 | 198 | 11.695216% |
Noise dominated data is calculated using 1-second bins in cleaned event files. If a bin has >2000 counts, and if more than 50% of those come from <1% of pixels, then it is considered to be noise-dominated and hence unusable.
| Quadrant | # 1 sec bins | Bins with >0 counts | Bins with >2000 counts | High rate bins dominated by noise | Noise dominated (total time) | Noise dominated (detector-on time) | Marked lightcurve |
|---|---|---|---|---|---|---|---|
| A | 1692 | 1692 | 0 | 0 | 0.00% | 0.00% |  |
| B | 1693 | 1693 | 1 | 1 | 0.06% | 0.06% |  |
| C | 1693 | 1693 | 0 | 0 | 0.00% | 0.00% |  |
| D | 1693 | 1693 | 245 | 245 | 14.47% | 14.47% |  |
Top three noisy pixels from each quadrant. If the there are fewer than three noisy pixels in the level2.evt file, extra rows are filled as -1
| Pixel properties | Quadrant properties | ||||||
|---|---|---|---|---|---|---|---|
| Quadrant | DetID | PixID | Counts | Sigma | Mean | Median | Sigma |
| A | 8 | 6 | 4317 | 90.61 | 214 | 209 | 45.3 |
| A | 13 | 254 | 2595 | 52.63 | 214 | 209 | 45.3 |
| A | 8 | 205 | 1977 | 39.0 | 214 | 209 | 45.3 |
| B | 0 | 189 | 47963 | 1144.2 | 208 | 204 | 41.7 |
| B | 0 | 190 | 37640 | 896.89 | 208 | 204 | 41.7 |
| B | 15 | 35 | 16228 | 383.9 | 208 | 204 | 41.7 |
| C | 14 | 238 | 31185 | 640.91 | 200 | 201 | 48.3 |
| C | 3 | 233 | 2212 | 41.6 | 200 | 201 | 48.3 |
| C | 13 | 61 | 1420 | 25.22 | 200 | 201 | 48.3 |
| D | 1 | 20 | 775381 | 15266.85 | 202 | 196 | 50.8 |
| D | 7 | 238 | 454759 | 8952.37 | 202 | 196 | 50.8 |
| D | 1 | 52 | 171142 | 3366.69 | 202 | 196 | 50.8 |
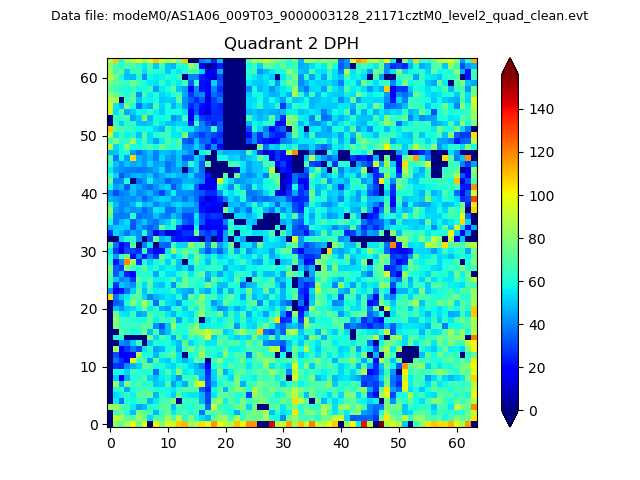
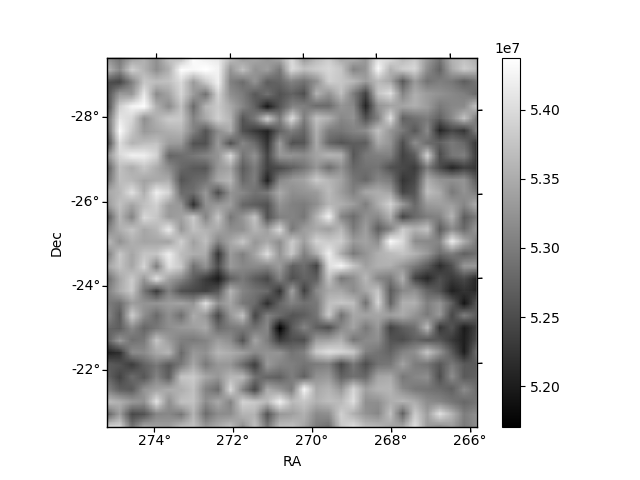
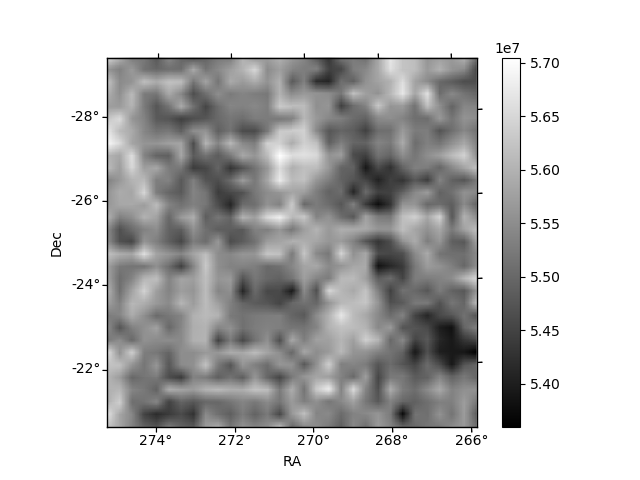
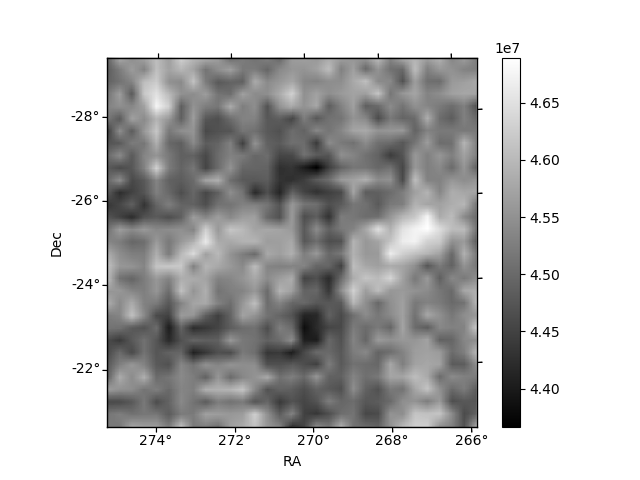
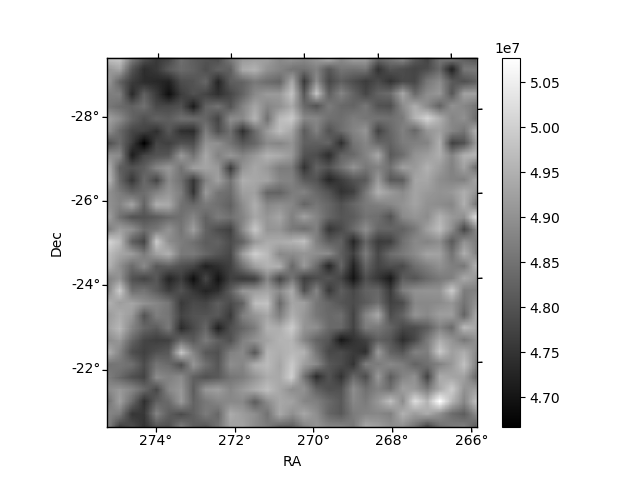
Histogram calculated using DETX and DETY for each event in the final _common_clean file
| Quadrant A | 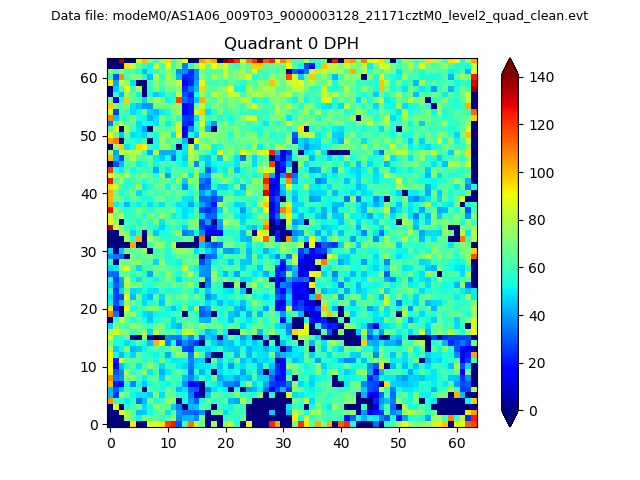 |
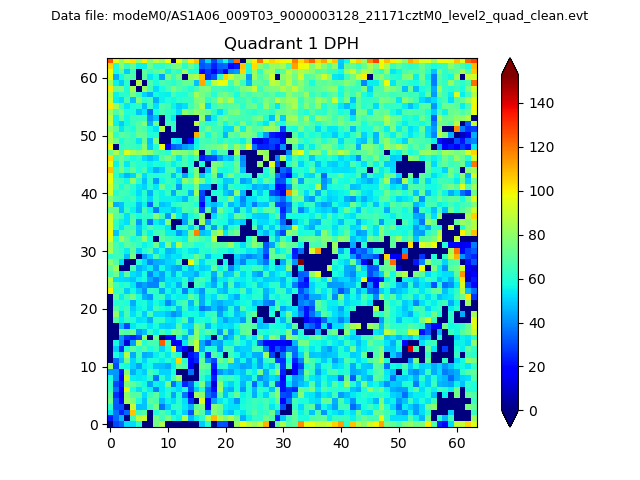 |
Quadrant B |
|---|---|---|---|
| Quadrant D | 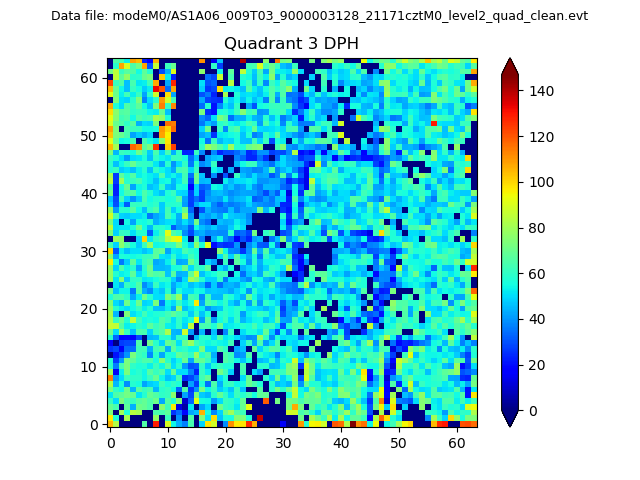 |
 |
Quadrant C |
| Plot type | Count rate plots | Images |
|---|---|---|
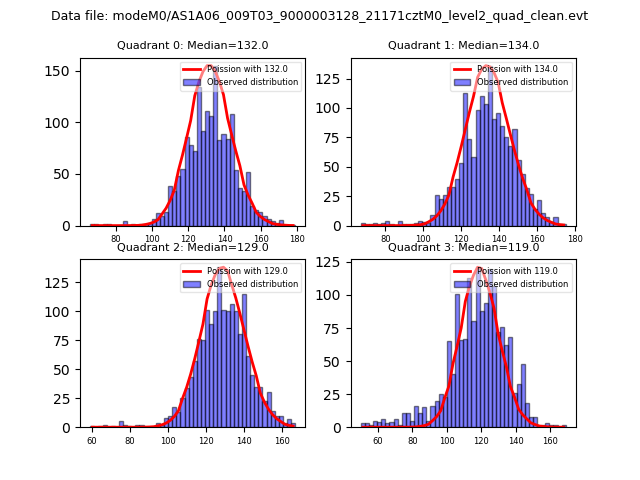
| Comparison with Poisson distribution Blue bars denote a histogram of data divided into 1 sec bins. Red curve is a Poisson curve with rate = median count rate of data. |
 |
 |
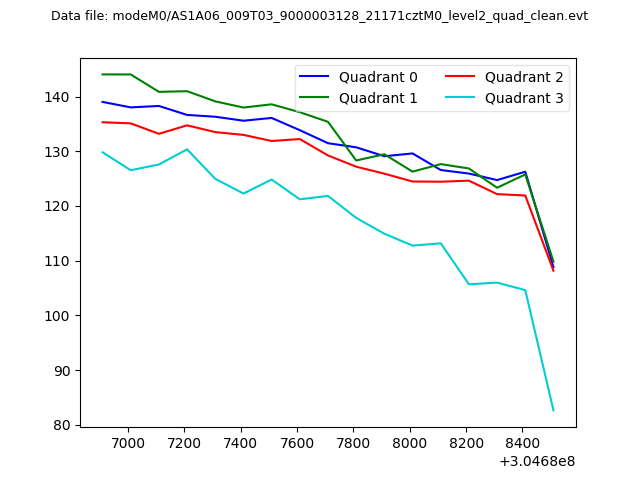
| Quadrant-wise count rates Data is divided into 100 sec bins |
 |
|
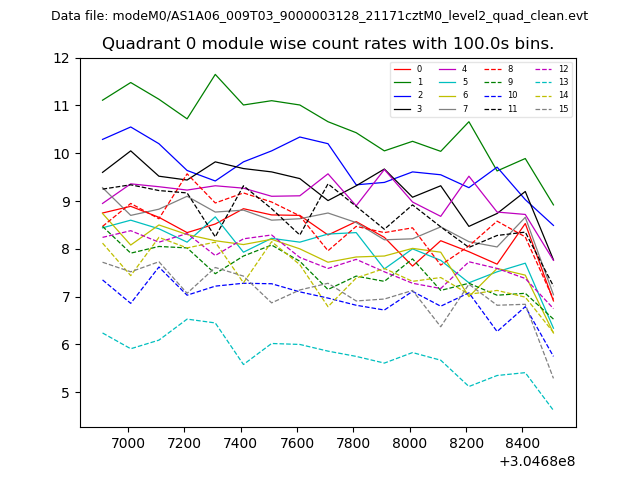
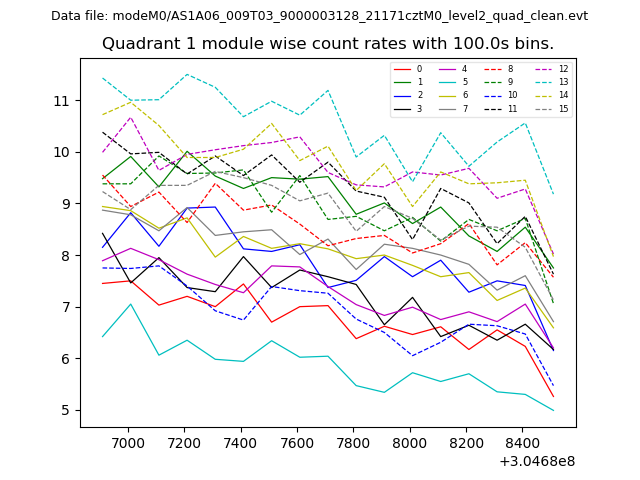
| Module-wise count rates for Quadrant A Data is divided into 100 sec bins |
 |
 |
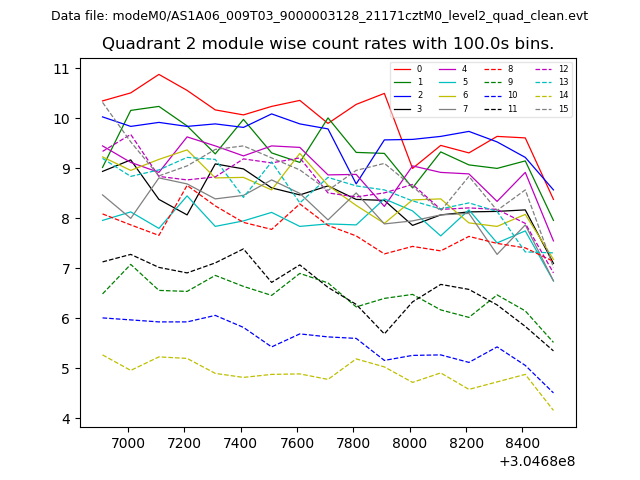
| Module-wise count rates for Quadrant B Data is divided into 100 sec bins |
 |
 |
| Module-wise count rates for Quadrant C Data is divided into 100 sec bins |
 |
 |
| Module-wise count rates for Quadrant D Data is divided into 100 sec bins |
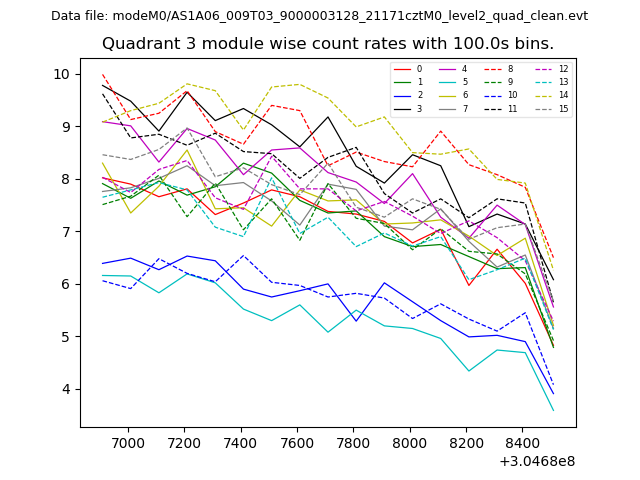 |
 |
| Parameter | Plot |
|---|---|
| CZT HV Monitor | 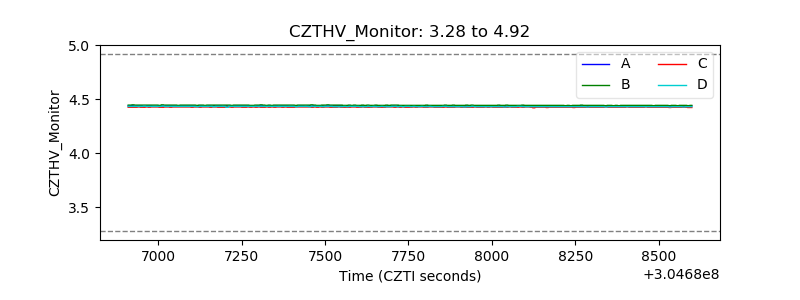 |
| D_VDD | 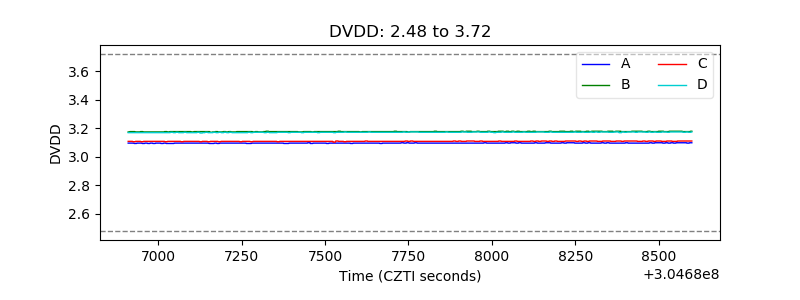 |
| Temperature 1 | 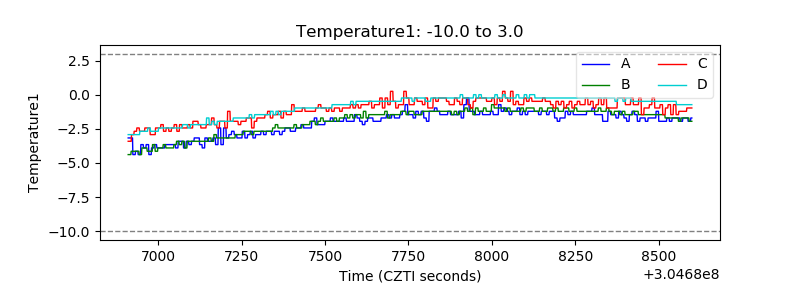 |
| Veto HV Monitor | 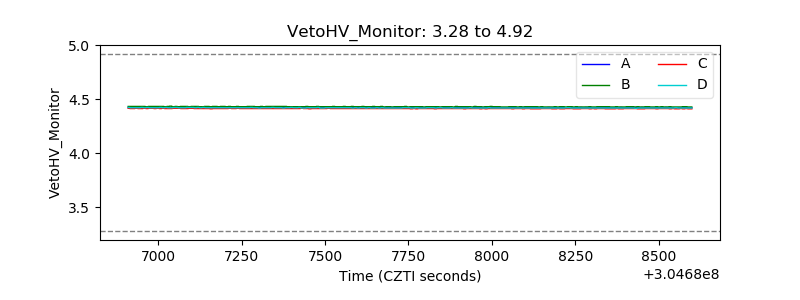 |
| Veto LLD | 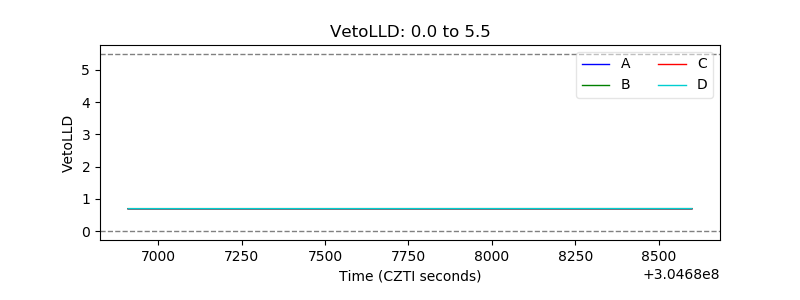 |
| Alpha Counter | 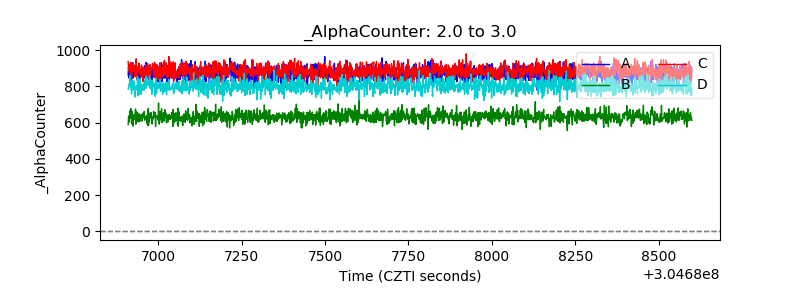 |
| _CPM_Rate | 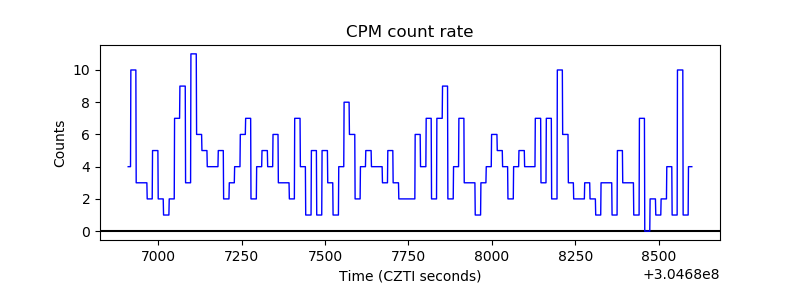 |
| CZT Counter | 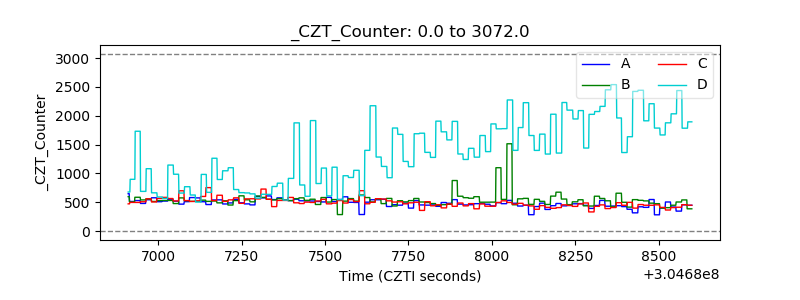 |
| +2.5 Volts monitor |  |
| +5 Volts monitor | 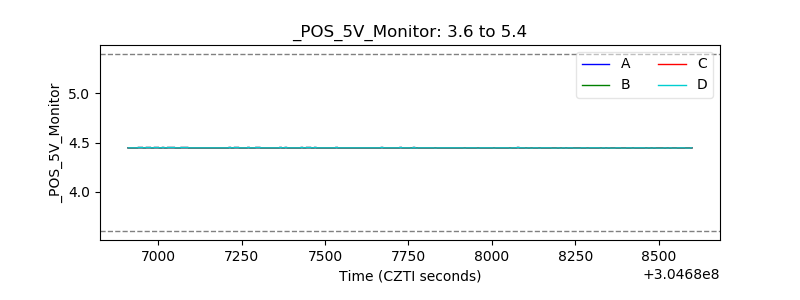 |
| _ROLL_ROT | 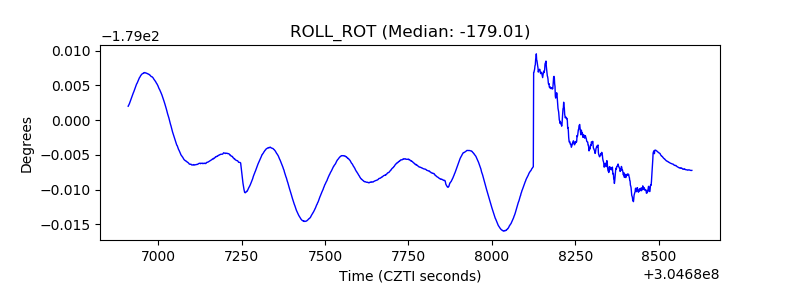 |
| _Roll_DEC | 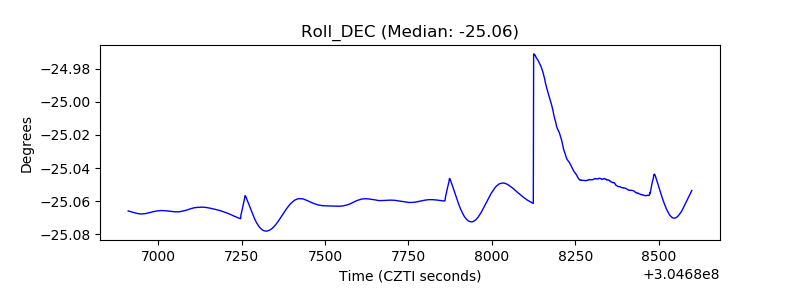 |
| _Roll_RA | 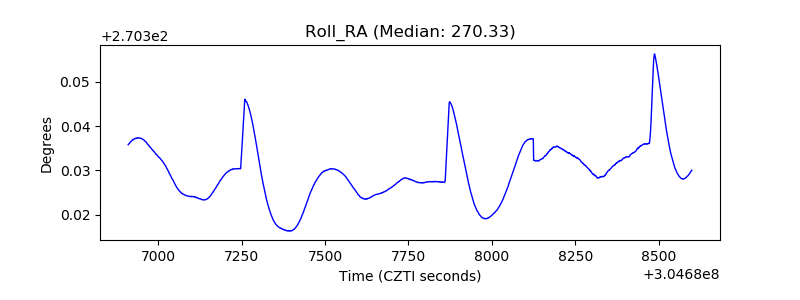 |
| Veto Counter | 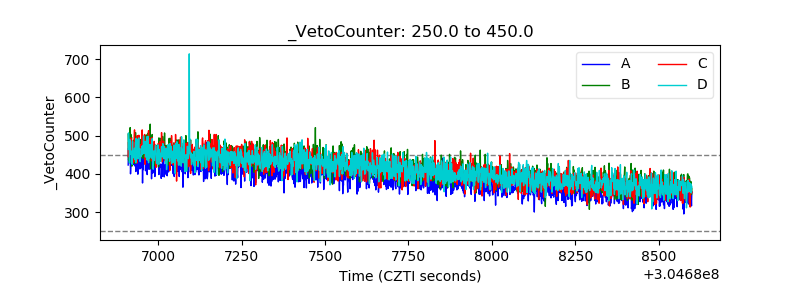 |