| Param | Original file | Final file |
|---|---|---|
| Filename | modeM0/AS1A06_002T01_9000003134_21182cztM0_level2.evt | modeM0/AS1A06_002T01_9000003134_21182cztM0_level2_quad_clean.evt |
| Size (bytes) | 219,121,920 | 17,418,240 |
| Size | 209.0 MB | 16.6 MB |
| Events in quadrant A | 1,296,034 | 87,764 |
| Events in quadrant B | 1,265,813 | 89,910 |
| Events in quadrant C | 1,233,831 | 86,732 |
| Events in quadrant D | 2,669,039 | 83,403 |
| Mode SS | |||
|---|---|---|---|
| Quadrant | BADHDUFLAG | Total packets | Discarded packets |
| A | 0 | 50 | 0 |
| B | 0 | 50 | 0 |
| C | 0 | 50 | 0 |
| D | 0 | 50 | 0 |
| Mode M0 | |||
|---|---|---|---|
| Quadrant | BADHDUFLAG | Total packets | Discarded packets |
| A | 0 | 5447 | 1 |
| B | 0 | 5300 | 1 |
| C | 0 | 5228 | 1 |
| D | 0 | 9687 | 1 |
| Mode M9 | |||
|---|---|---|---|
| Quadrant | BADHDUFLAG | Total packets | Discarded packets |
| A | 0 | 4 | 0 |
| B | 0 | 4 | 0 |
| C | 0 | 4 | 0 |
| D | 0 | 4 | 0 |
| Quadrant | Total seconds | Saturated seconds | Saturation percentage |
|---|---|---|---|
| A | 2495 | 74 | 2.965932% |
| B | 2495 | 97 | 3.887776% |
| C | 2495 | 93 | 3.727455% |
| D | 2495 | 747 | 29.939880% |
Noise dominated data is calculated using 1-second bins in cleaned event files. If a bin has >2000 counts, and if more than 50% of those come from <1% of pixels, then it is considered to be noise-dominated and hence unusable.
| Quadrant | # 1 sec bins | Bins with >0 counts | Bins with >2000 counts | High rate bins dominated by noise | Noise dominated (total time) | Noise dominated (detector-on time) | Marked lightcurve |
|---|---|---|---|---|---|---|---|
| A | 2855 | 2496 | 4 | 4 | 0.14% | 0.16% | 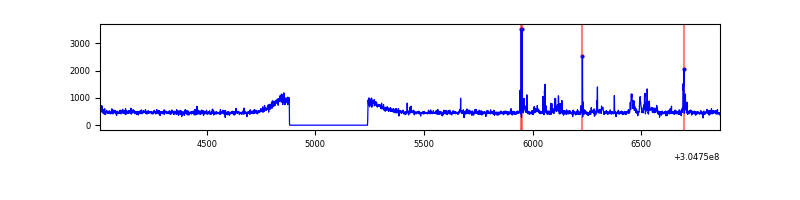 |
| B | 2855 | 2496 | 4 | 4 | 0.14% | 0.16% | 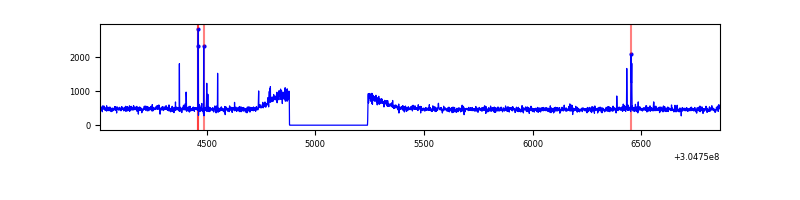 |
| C | 2855 | 2496 | 0 | 0 | 0.00% | 0.00% | 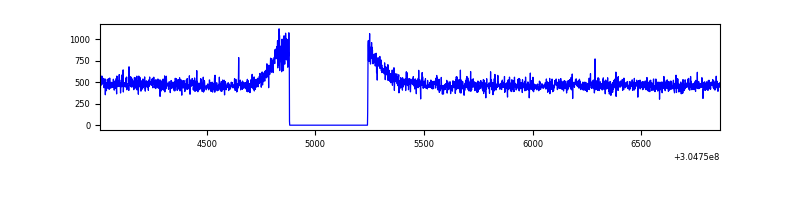 |
| D | 2855 | 2496 | 444 | 444 | 15.55% | 17.79% | 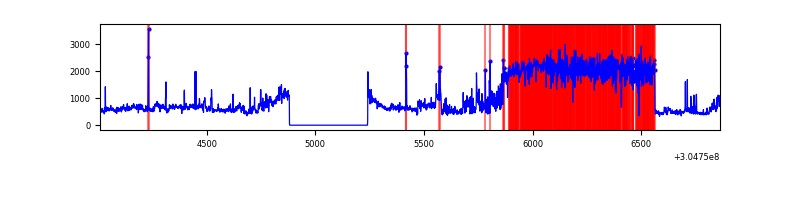 |
Top three noisy pixels from each quadrant. If the there are fewer than three noisy pixels in the level2.evt file, extra rows are filled as -1
| Pixel properties | Quadrant properties | ||||||
|---|---|---|---|---|---|---|---|
| Quadrant | DetID | PixID | Counts | Sigma | Mean | Median | Sigma |
| A | 5 | 16 | 65039 | 976.58 | 313 | 306 | 66.3 |
| A | 13 | 252 | 22637 | 336.89 | 313 | 306 | 66.3 |
| A | 13 | 254 | 3520 | 48.49 | 313 | 306 | 66.3 |
| B | 4 | 173 | 13065 | 202.12 | 314 | 306 | 63.1 |
| B | 3 | 64 | 10702 | 164.69 | 314 | 306 | 63.1 |
| B | 12 | 111 | 7583 | 115.28 | 314 | 306 | 63.1 |
| C | 14 | 238 | 45964 | 620.15 | 303 | 305 | 73.6 |
| C | 3 | 233 | 3550 | 44.07 | 303 | 305 | 73.6 |
| C | 13 | 61 | 2169 | 25.32 | 303 | 305 | 73.6 |
| D | 7 | 238 | 1539475 | 22340.48 | 273 | 264 | 68.9 |
| D | 7 | 223 | 29712 | 427.42 | 273 | 264 | 68.9 |
| D | 1 | 52 | 21481 | 307.95 | 273 | 264 | 68.9 |
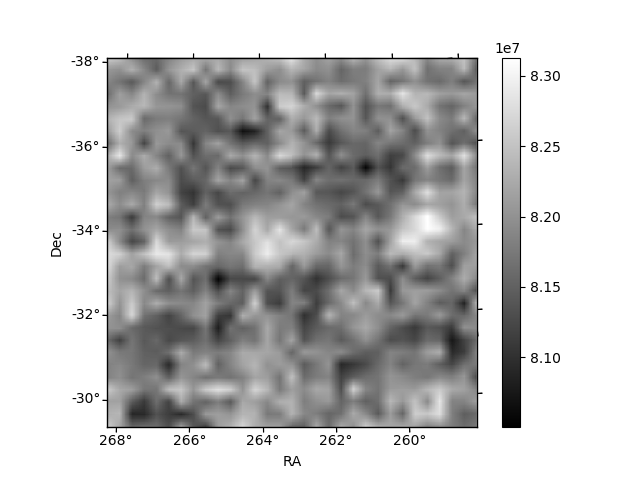
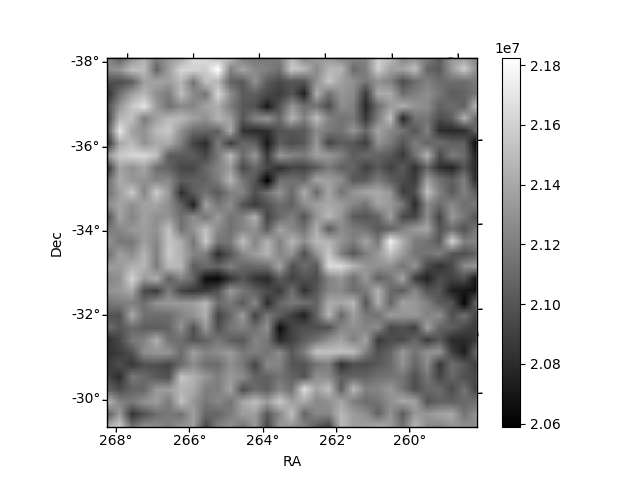
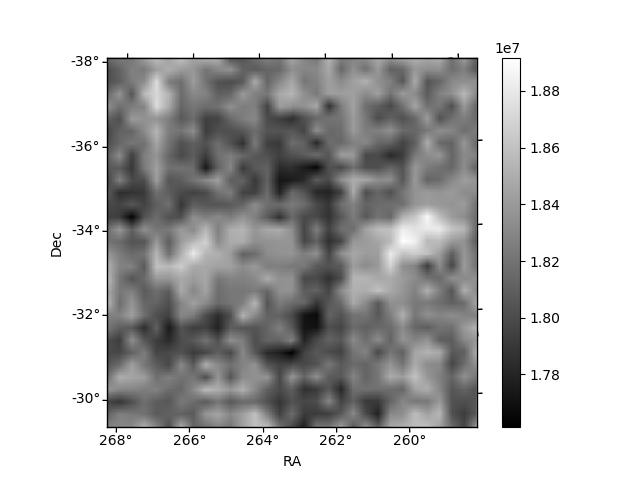
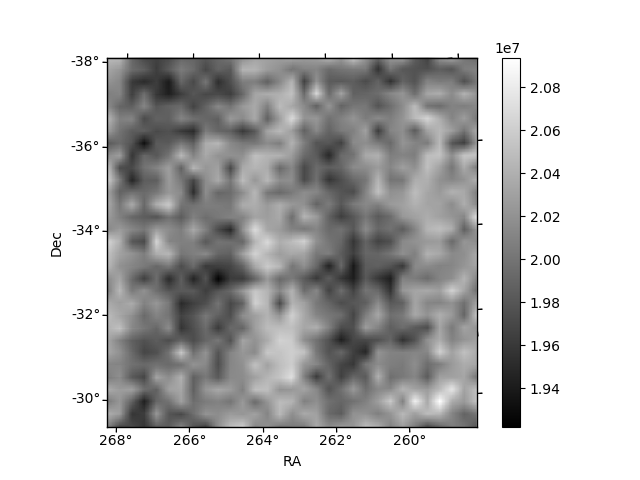
Histogram calculated using DETX and DETY for each event in the final _common_clean file
| Quadrant A | 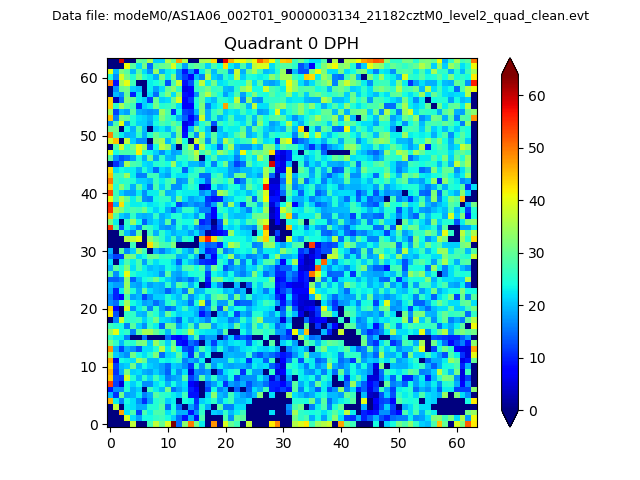 |
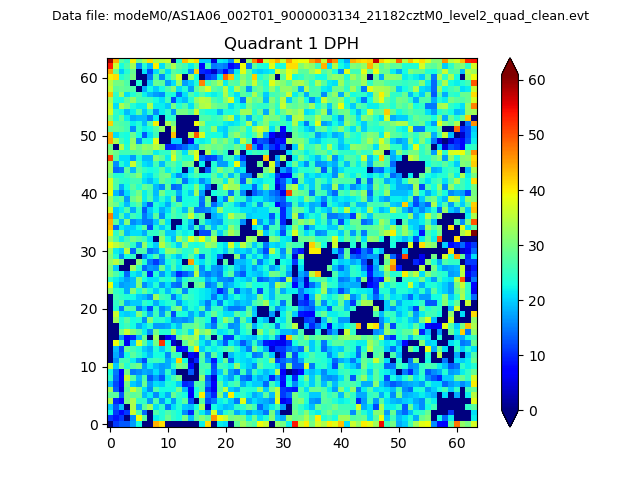 |
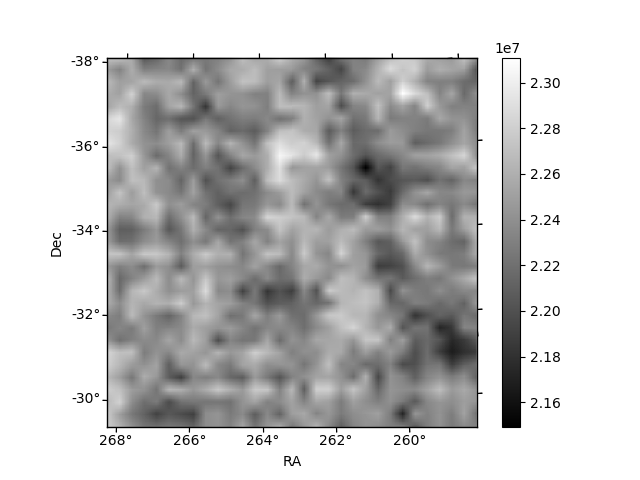
Quadrant B |
|---|---|---|---|
| Quadrant D | 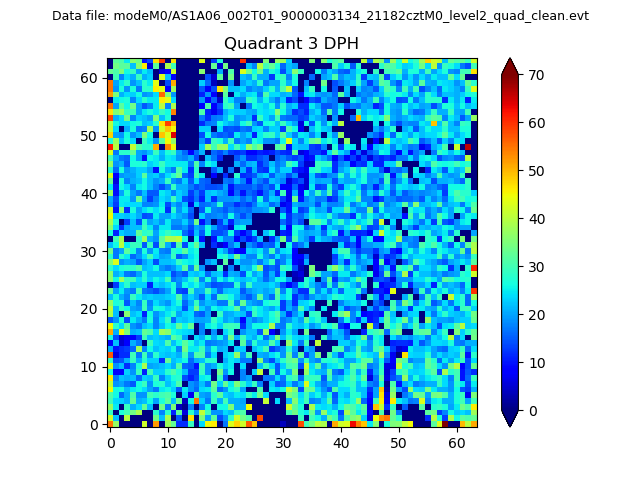 |
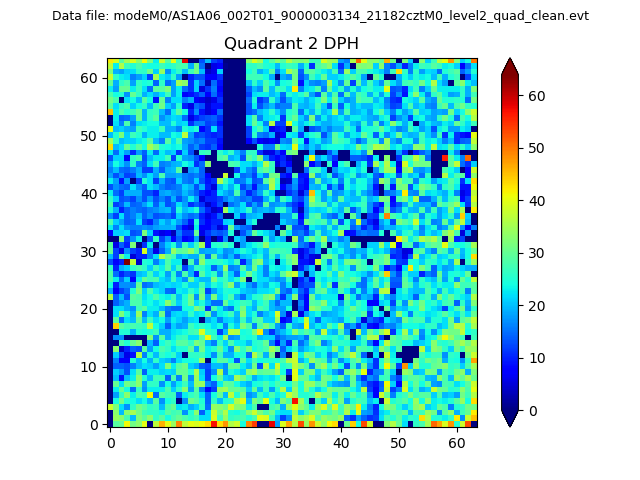 |
Quadrant C |
| Plot type | Count rate plots | Images |
|---|---|---|
| Comparison with Poisson distribution Blue bars denote a histogram of data divided into 1 sec bins. Red curve is a Poisson curve with rate = median count rate of data. |
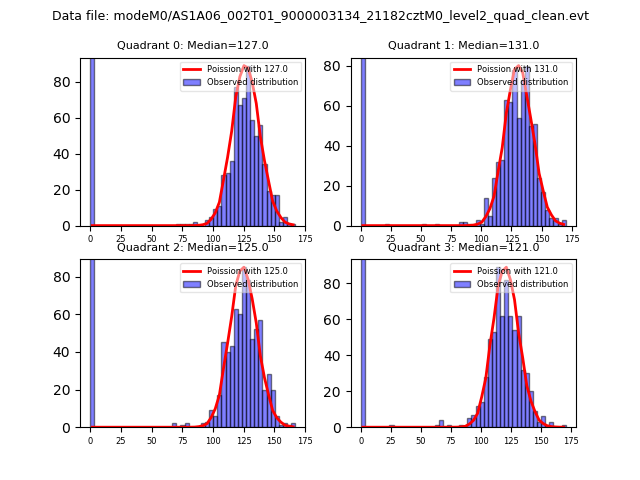 |
 |
| Quadrant-wise count rates Data is divided into 100 sec bins |
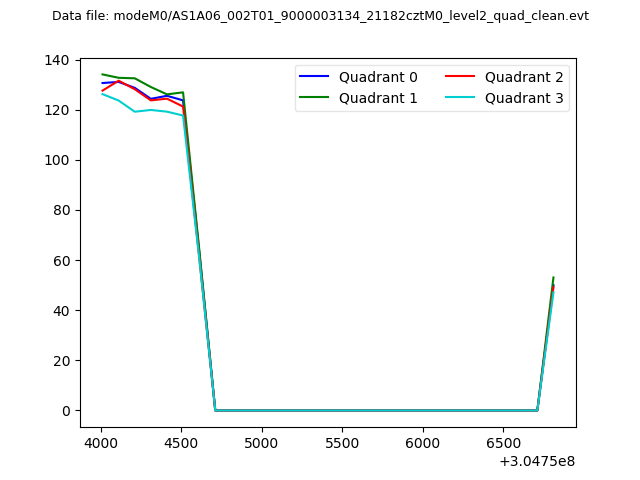 |
|
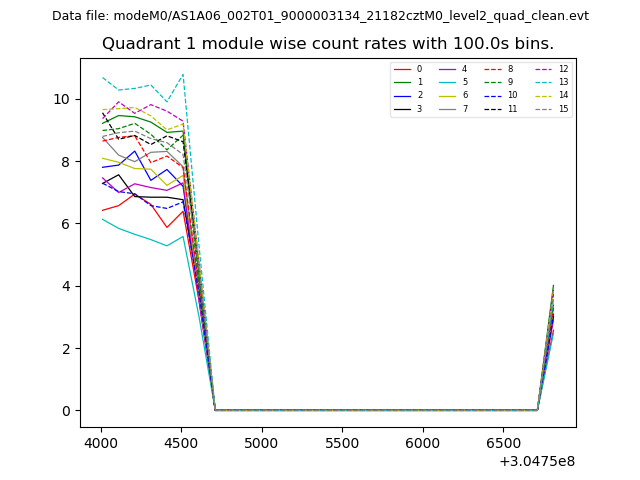
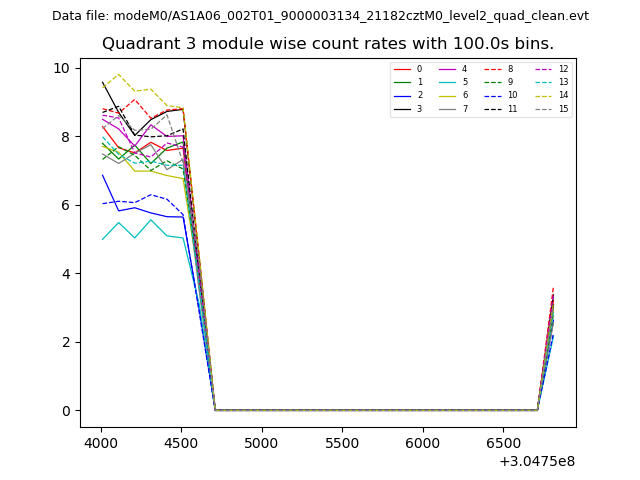
| Module-wise count rates for Quadrant A Data is divided into 100 sec bins |
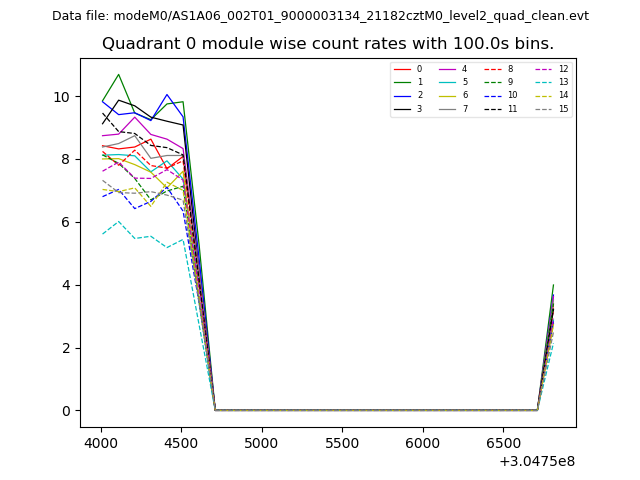 |
 |
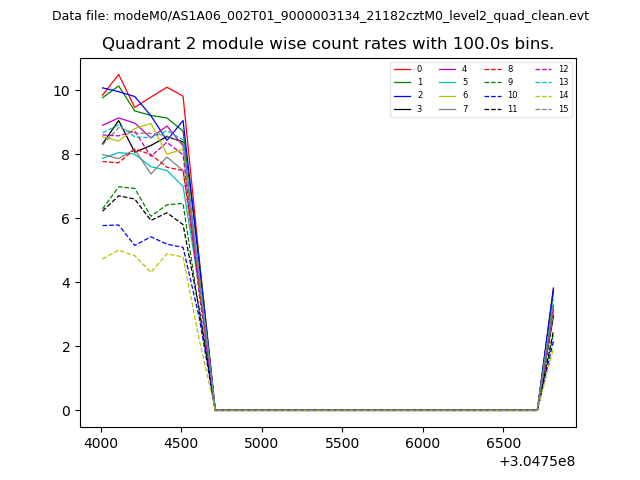
| Module-wise count rates for Quadrant B Data is divided into 100 sec bins |
 |
 |
| Module-wise count rates for Quadrant C Data is divided into 100 sec bins |
 |
 |
| Module-wise count rates for Quadrant D Data is divided into 100 sec bins |
 |
 |
| Parameter | Plot |
|---|---|
| CZT HV Monitor | 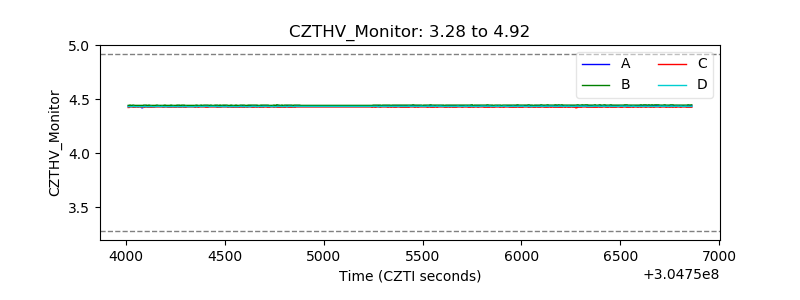 |
| D_VDD | 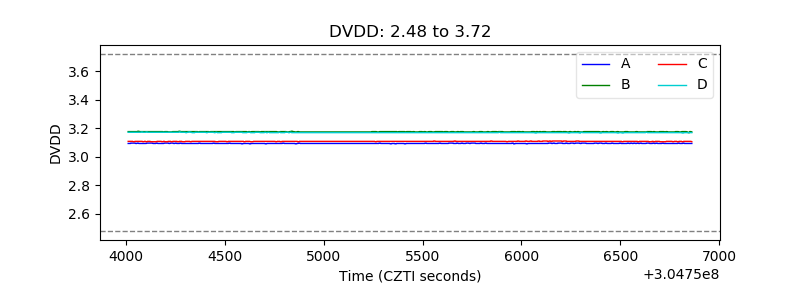 |
| Temperature 1 | 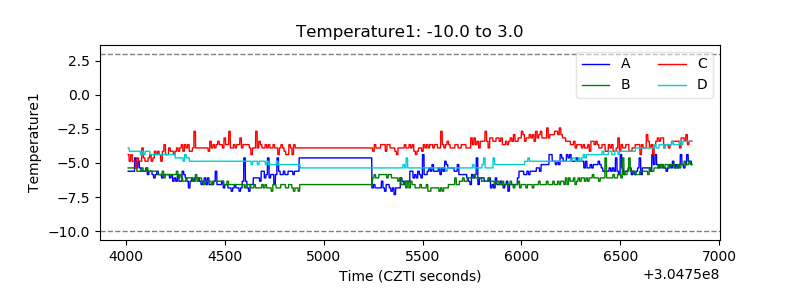 |
| Veto HV Monitor | 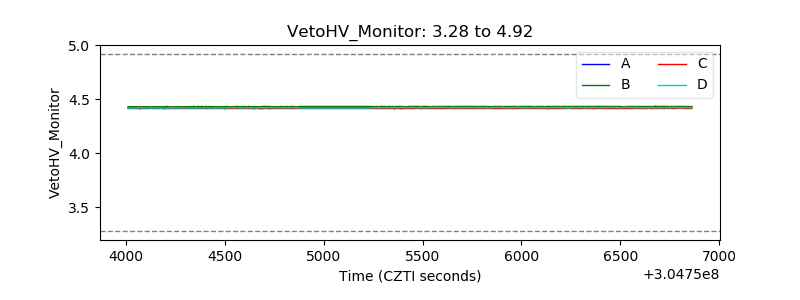 |
| Veto LLD | 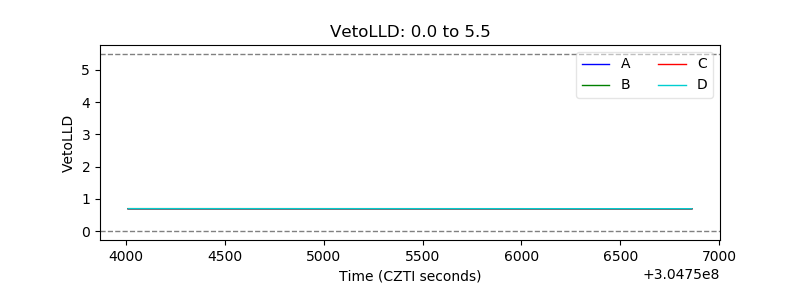 |
| Alpha Counter | 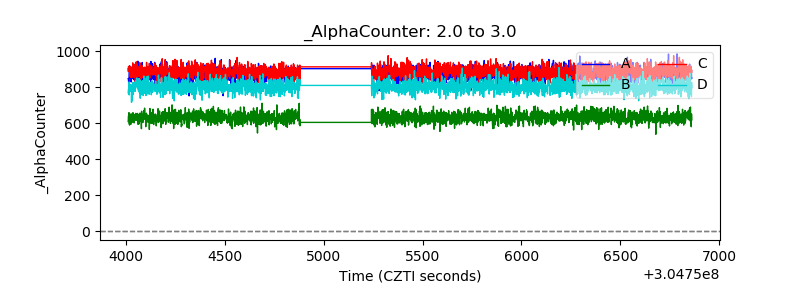 |
| _CPM_Rate | 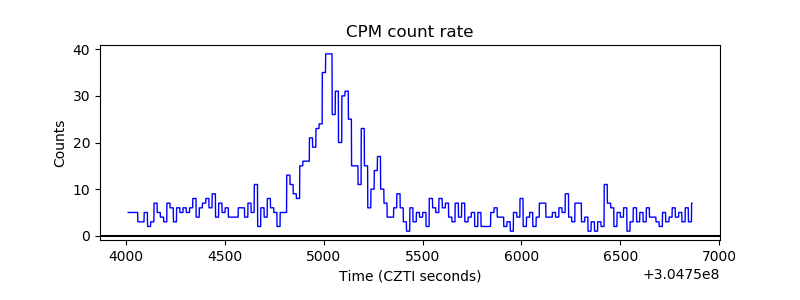 |
| CZT Counter | 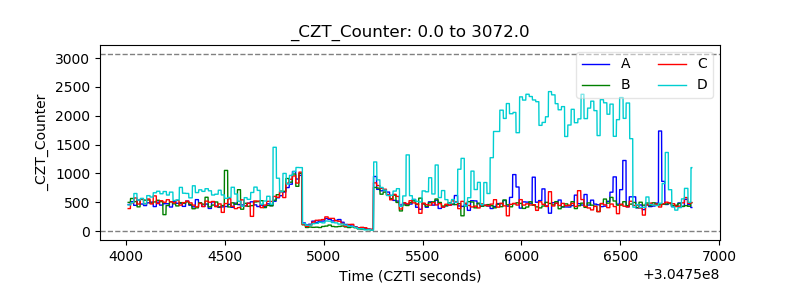 |
| +2.5 Volts monitor | 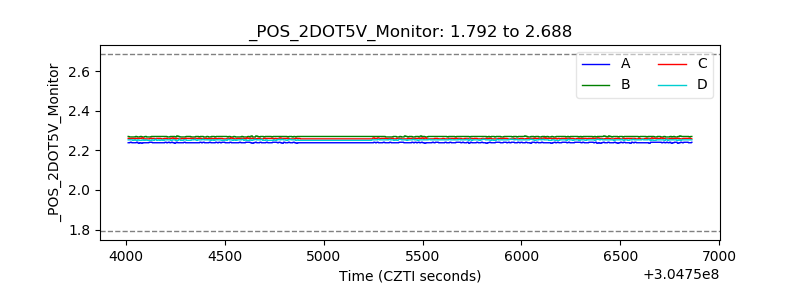 |
| +5 Volts monitor |  |
| _ROLL_ROT | 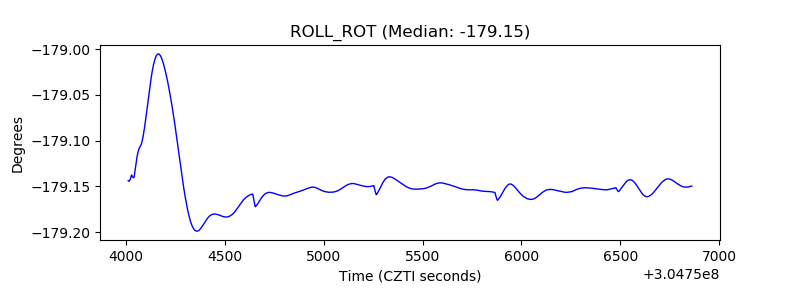 |
| _Roll_DEC | 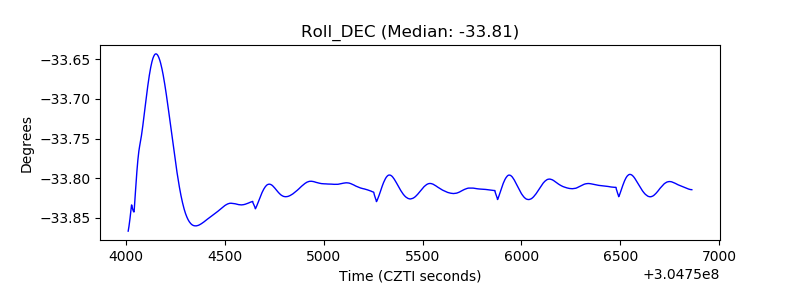 |
| _Roll_RA | 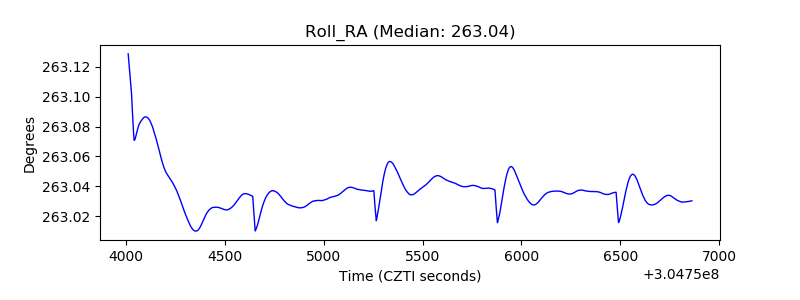 |
| Veto Counter |  |