| Param | Original file | Final file |
|---|---|---|
| Filename | modeM0/AS1A06_002T01_9000003134_21184cztM0_level2.evt | modeM0/AS1A06_002T01_9000003134_21184cztM0_level2_quad_clean.evt |
| Size (bytes) | 1,051,225,920 | 152,619,840 |
| Size | 1002.5 MB | 145.5 MB |
| Events in quadrant A | 5,955,194 | 1,009,064 |
| Events in quadrant B | 6,128,775 | 1,024,616 |
| Events in quadrant C | 6,181,295 | 988,938 |
| Events in quadrant D | 12,729,398 | 738,888 |
| Mode SS | |||
|---|---|---|---|
| Quadrant | BADHDUFLAG | Total packets | Discarded packets |
| A | 0 | 254 | 2 |
| B | 0 | 254 | 2 |
| C | 0 | 254 | 2 |
| D | 0 | 254 | 2 |
| Mode M0 | |||
|---|---|---|---|
| Quadrant | BADHDUFLAG | Total packets | Discarded packets |
| A | 0 | 25787 | 205 |
| B | 0 | 26092 | 213 |
| C | 0 | 26230 | 195 |
| D | 0 | 46489 | 270 |
| Mode M9 | |||
|---|---|---|---|
| Quadrant | BADHDUFLAG | Total packets | Discarded packets |
| A | 0 | 13 | 0 |
| B | 0 | 13 | 0 |
| C | 0 | 13 | 0 |
| D | 0 | 13 | 0 |
| Quadrant | Total seconds | Saturated seconds | Saturation percentage |
|---|---|---|---|
| A | 12440 | 142 | 1.141479% |
| B | 12442 | 162 | 1.302041% |
| C | 12442 | 214 | 1.719981% |
| D | 12439 | 3582 | 28.796527% |
Noise dominated data is calculated using 1-second bins in cleaned event files. If a bin has >2000 counts, and if more than 50% of those come from <1% of pixels, then it is considered to be noise-dominated and hence unusable.
| Quadrant | # 1 sec bins | Bins with >0 counts | Bins with >2000 counts | High rate bins dominated by noise | Noise dominated (total time) | Noise dominated (detector-on time) | Marked lightcurve |
|---|---|---|---|---|---|---|---|
| A | 13883 | 12448 | 4 | 4 | 0.03% | 0.03% | 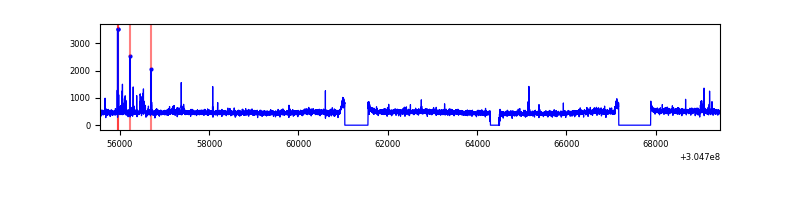 |
| B | 13884 | 12449 | 13 | 13 | 0.09% | 0.10% | 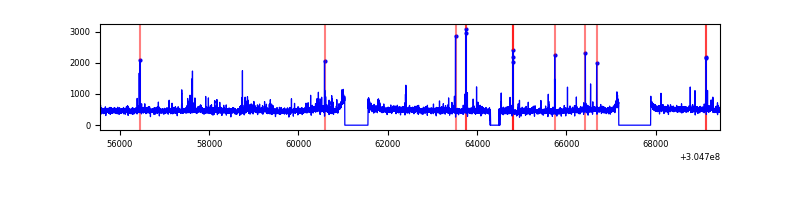 |
| C | 13884 | 12447 | 11 | 11 | 0.08% | 0.09% | 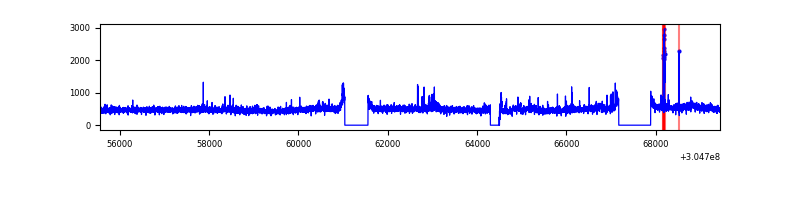 |
| D | 13884 | 12448 | 1922 | 1922 | 13.84% | 15.44% | 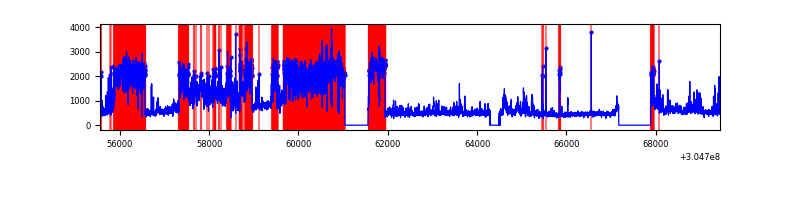 |
Top three noisy pixels from each quadrant. If the there are fewer than three noisy pixels in the level2.evt file, extra rows are filled as -1
| Pixel properties | Quadrant properties | ||||||
|---|---|---|---|---|---|---|---|
| Quadrant | DetID | PixID | Counts | Sigma | Mean | Median | Sigma |
| A | 5 | 16 | 68229 | 220.25 | 1499 | 1470 | 303.1 |
| A | 13 | 252 | 64527 | 208.03 | 1499 | 1470 | 303.1 |
| A | 8 | 6 | 29900 | 93.79 | 1499 | 1470 | 303.1 |
| B | 0 | 230 | 50770 | 171.51 | 1492 | 1454 | 287.5 |
| B | 0 | 197 | 45538 | 153.32 | 1492 | 1454 | 287.5 |
| B | 0 | 190 | 44489 | 149.67 | 1492 | 1454 | 287.5 |
| C | 3 | 233 | 307126 | 909.3 | 1434 | 1441 | 336.2 |
| C | 14 | 238 | 221387 | 654.26 | 1434 | 1441 | 336.2 |
| C | 10 | 91 | 61656 | 179.12 | 1434 | 1441 | 336.2 |
| D | 7 | 238 | 7813621 | 28063.45 | 1134 | 1101 | 278.4 |
| D | 1 | 20 | 380575 | 1363.11 | 1134 | 1101 | 278.4 |
| D | 1 | 52 | 62710 | 221.31 | 1134 | 1101 | 278.4 |
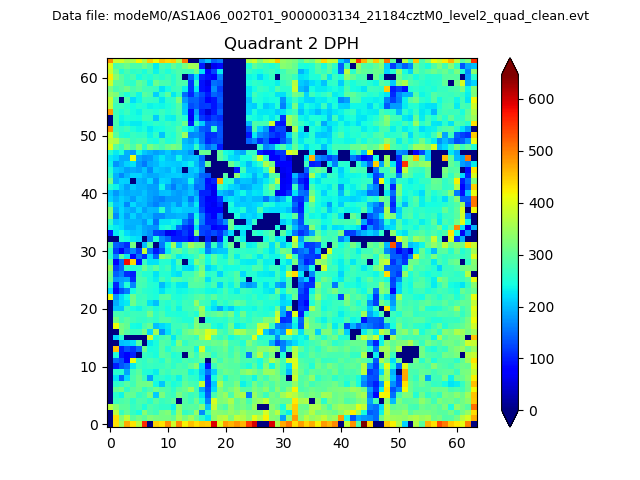
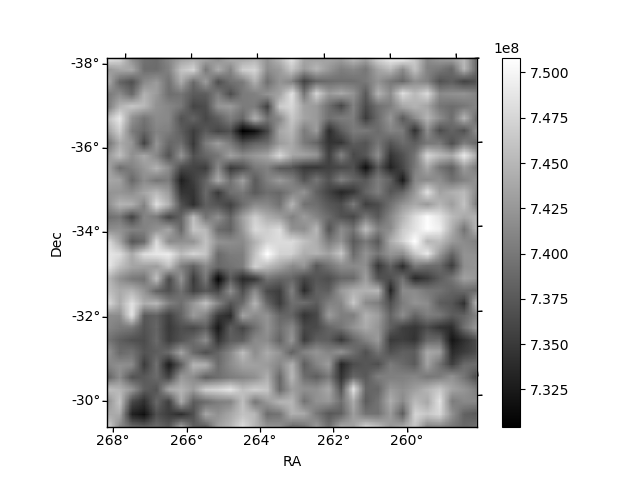
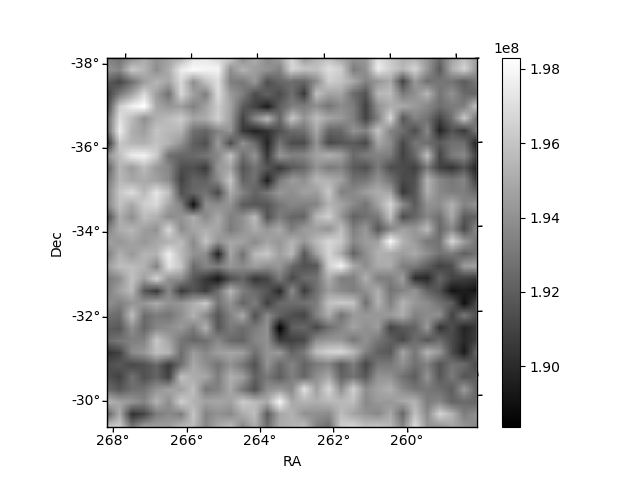
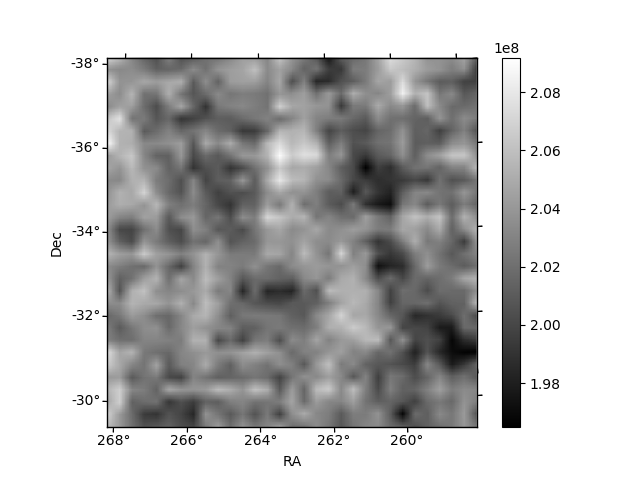
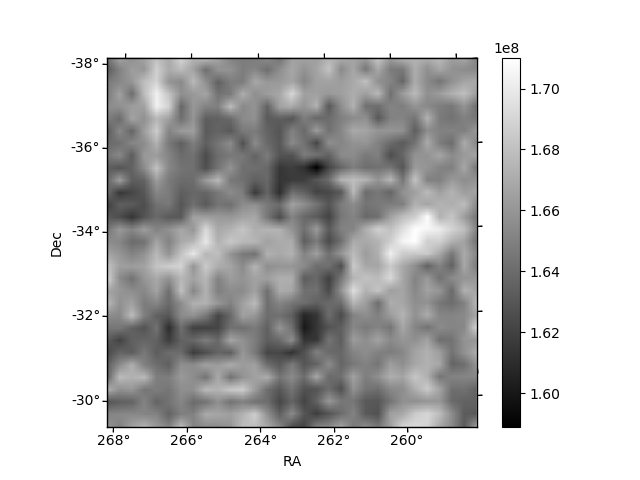
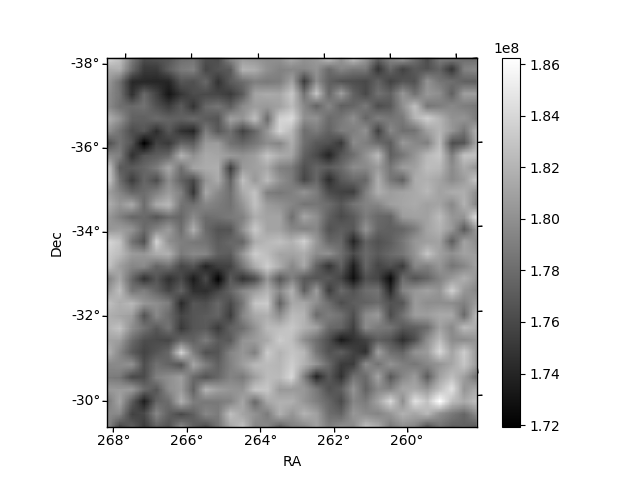
Histogram calculated using DETX and DETY for each event in the final _common_clean file
| Quadrant A | 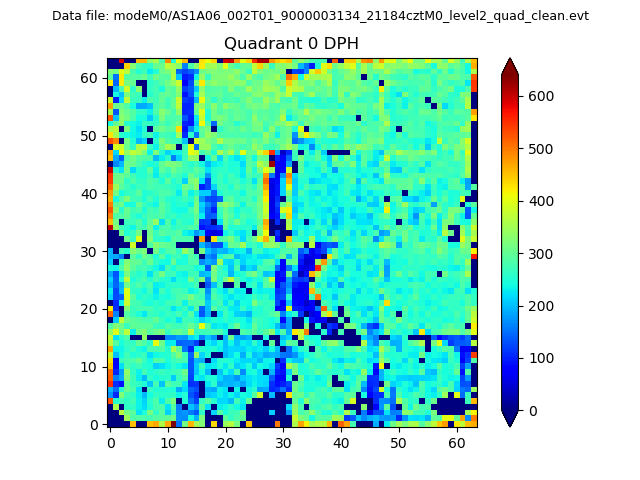 |
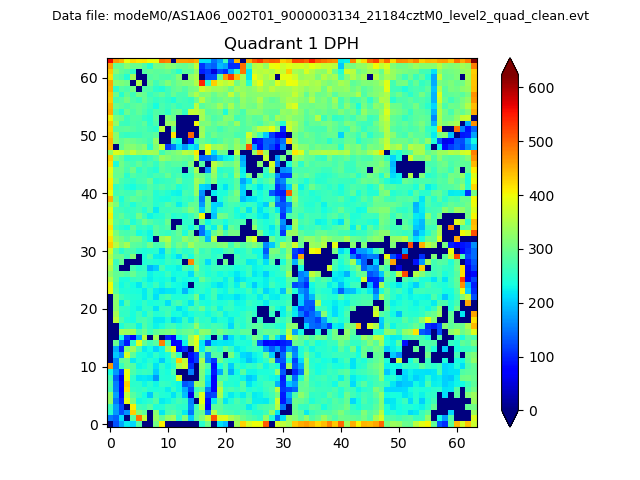 |
Quadrant B |
|---|---|---|---|
| Quadrant D | 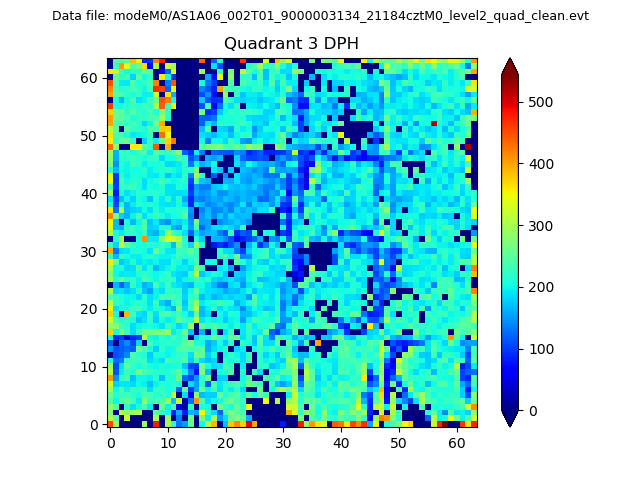 |
 |
Quadrant C |
| Plot type | Count rate plots | Images |
|---|---|---|
| Comparison with Poisson distribution Blue bars denote a histogram of data divided into 1 sec bins. Red curve is a Poisson curve with rate = median count rate of data. |
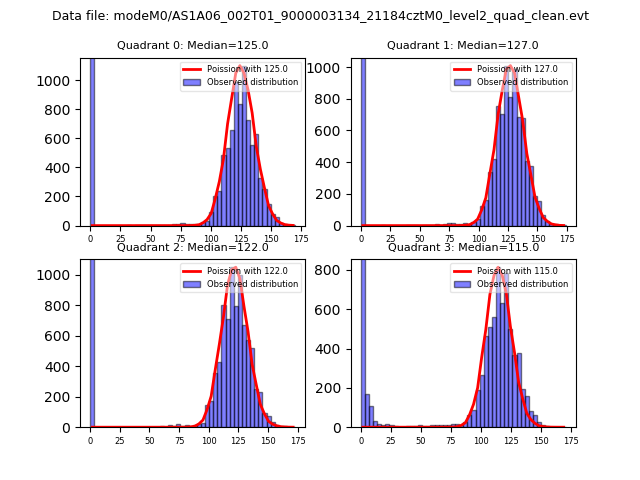 |
 |
| Quadrant-wise count rates Data is divided into 100 sec bins |
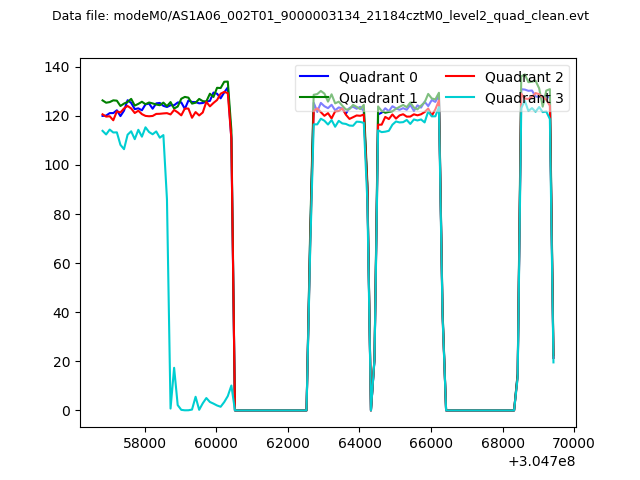 |
|
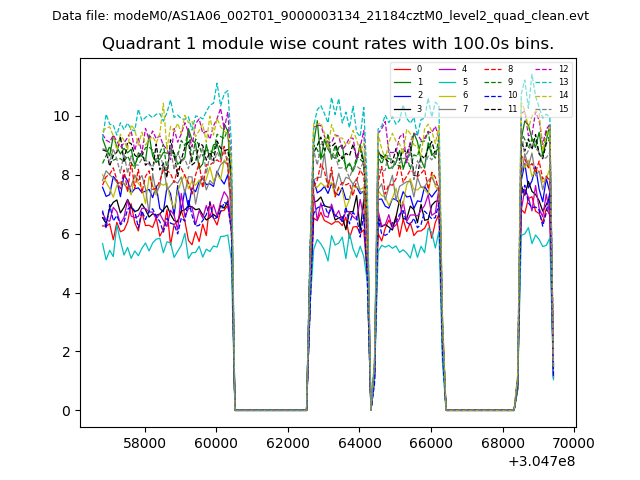
| Module-wise count rates for Quadrant A Data is divided into 100 sec bins |
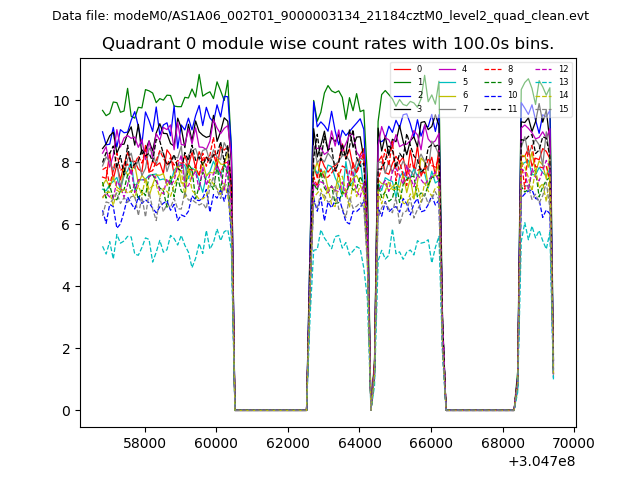 |
 |
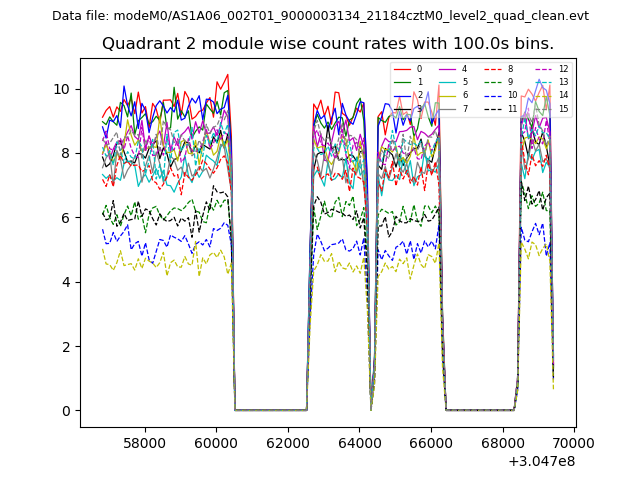
| Module-wise count rates for Quadrant B Data is divided into 100 sec bins |
 |
 |
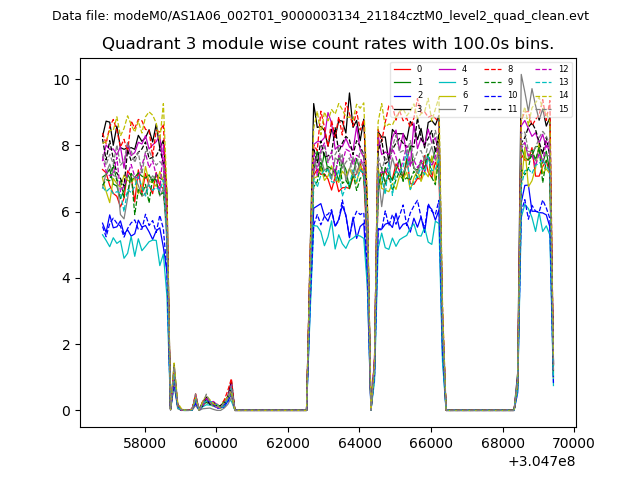
| Module-wise count rates for Quadrant C Data is divided into 100 sec bins |
 |
 |
| Module-wise count rates for Quadrant D Data is divided into 100 sec bins |
 |
 |
| Parameter | Plot |
|---|---|
| CZT HV Monitor |  |
| D_VDD | 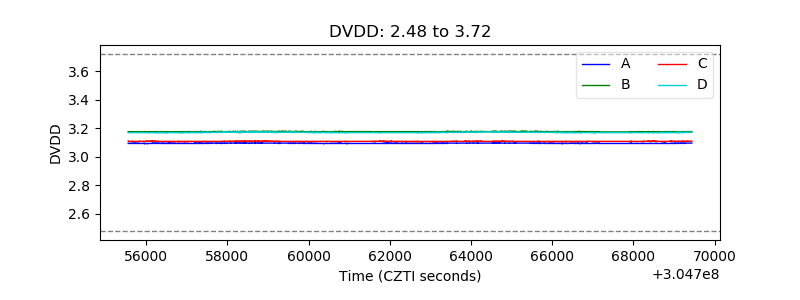 |
| Temperature 1 | 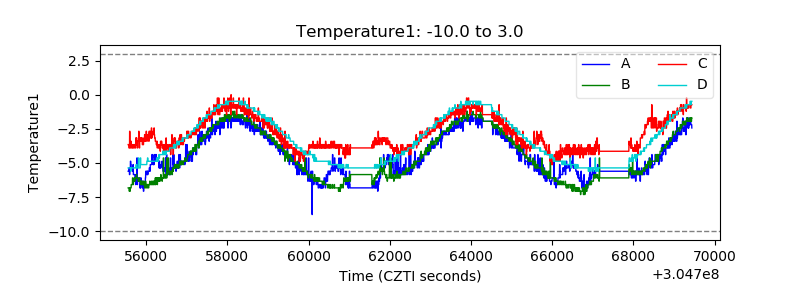 |
| Veto HV Monitor | 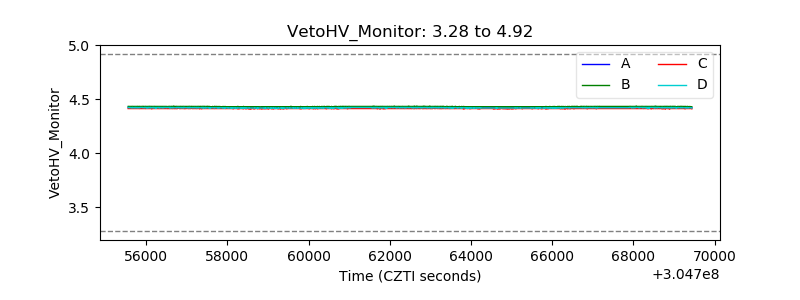 |
| Veto LLD | 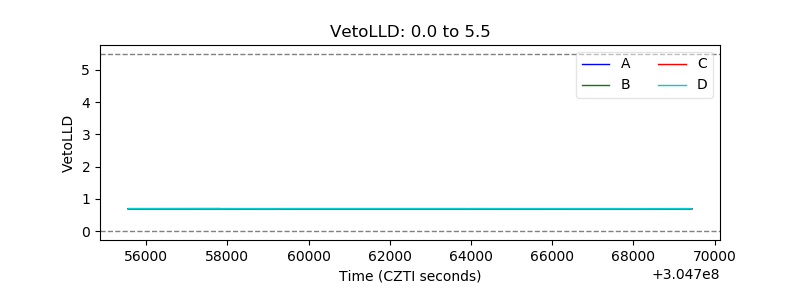 |
| Alpha Counter | 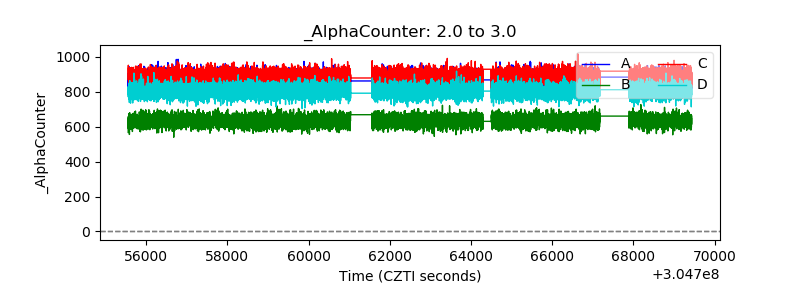 |
| _CPM_Rate | 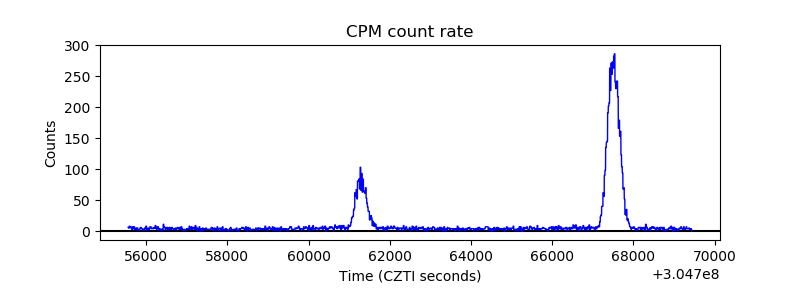 |
| CZT Counter | 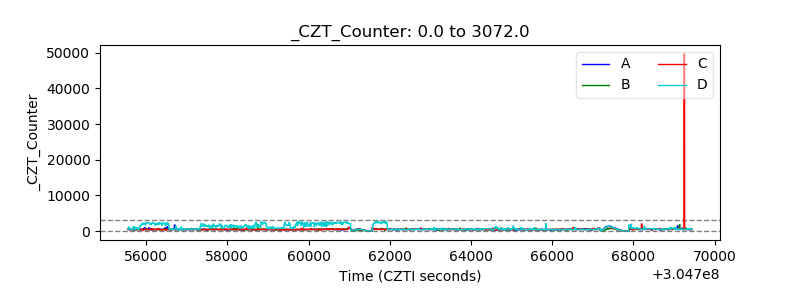 |
| +2.5 Volts monitor | 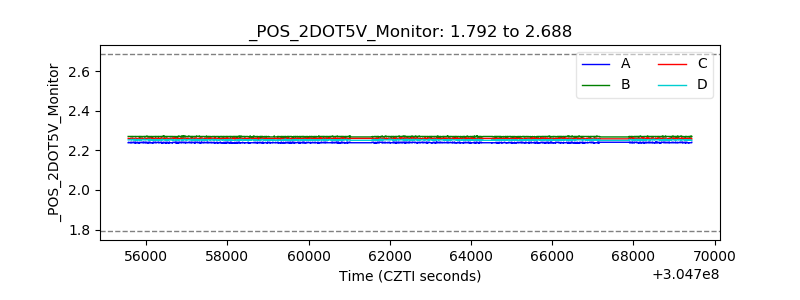 |
| +5 Volts monitor |  |
| _ROLL_ROT | 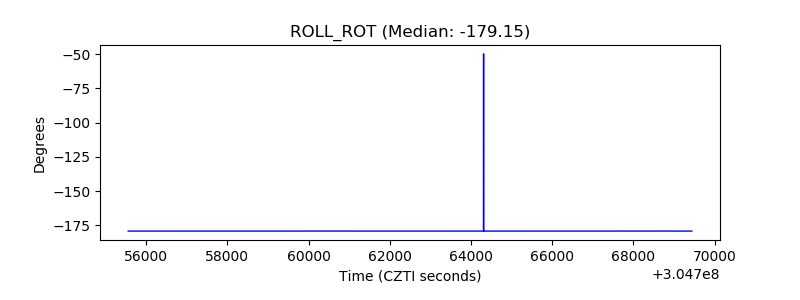 |
| _Roll_DEC | 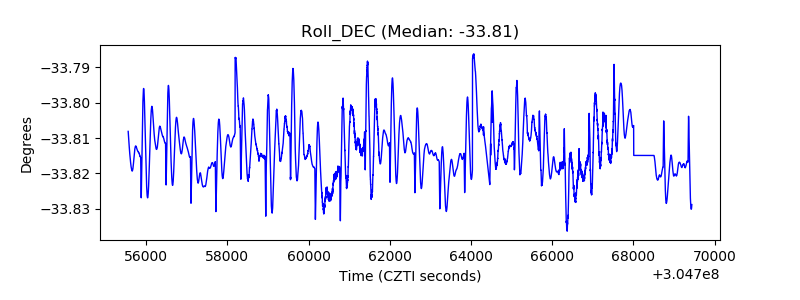 |
| _Roll_RA | 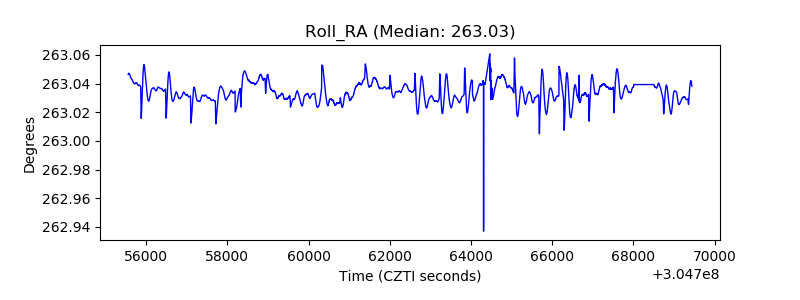 |
| Veto Counter | 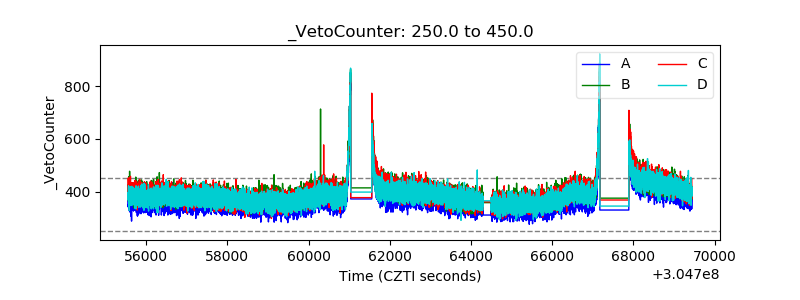 |