| Param | Original file | Final file |
|---|---|---|
| Filename | modeM0/AS1A06_002T01_9000003134_21185cztM0_level2.evt | modeM0/AS1A06_002T01_9000003134_21185cztM0_level2_quad_clean.evt |
| Size (bytes) | 494,654,400 | 94,150,080 |
| Size | 471.7 MB | 89.8 MB |
| Events in quadrant A | 3,113,993 | 623,449 |
| Events in quadrant B | 3,276,507 | 628,787 |
| Events in quadrant C | 3,145,891 | 606,504 |
| Events in quadrant D | 5,030,811 | 567,010 |
| Mode SS | |||
|---|---|---|---|
| Quadrant | BADHDUFLAG | Total packets | Discarded packets |
| A | 0 | 124 | 0 |
| B | 0 | 124 | 0 |
| C | 0 | 124 | 0 |
| D | 0 | 124 | 0 |
| Mode M0 | |||
|---|---|---|---|
| Quadrant | BADHDUFLAG | Total packets | Discarded packets |
| A | 0 | 13331 | 1 |
| B | 0 | 13470 | 1 |
| C | 0 | 13275 | 1 |
| D | 0 | 19028 | 1 |
| Mode M9 | |||
|---|---|---|---|
| Quadrant | BADHDUFLAG | Total packets | Discarded packets |
| A | 0 | 10 | 0 |
| B | 0 | 10 | 0 |
| C | 0 | 10 | 0 |
| D | 0 | 10 | 0 |
| Quadrant | Total seconds | Saturated seconds | Saturation percentage |
|---|---|---|---|
| A | 6100 | 69 | 1.131148% |
| B | 6100 | 110 | 1.803279% |
| C | 6100 | 78 | 1.278689% |
| D | 6101 | 492 | 8.064252% |
Noise dominated data is calculated using 1-second bins in cleaned event files. If a bin has >2000 counts, and if more than 50% of those come from <1% of pixels, then it is considered to be noise-dominated and hence unusable.
| Quadrant | # 1 sec bins | Bins with >0 counts | Bins with >2000 counts | High rate bins dominated by noise | Noise dominated (total time) | Noise dominated (detector-on time) | Marked lightcurve |
|---|---|---|---|---|---|---|---|
| A | 7010 | 6102 | 3 | 3 | 0.04% | 0.05% | 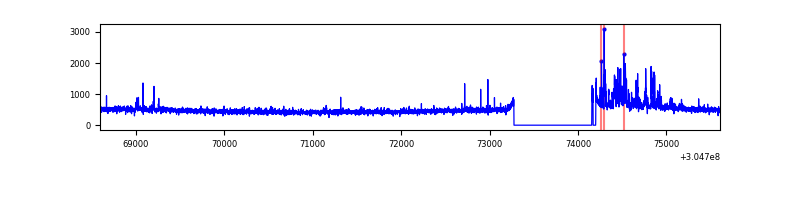 |
| B | 7010 | 6102 | 44 | 44 | 0.63% | 0.72% | 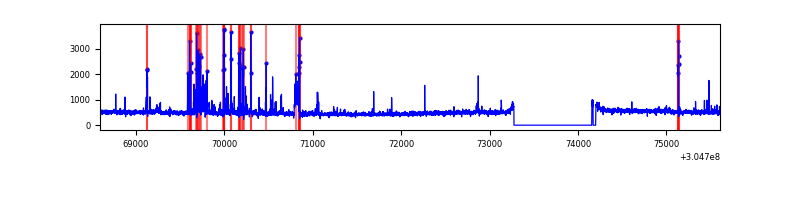 |
| C | 7010 | 6101 | 0 | 0 | 0.00% | 0.00% | 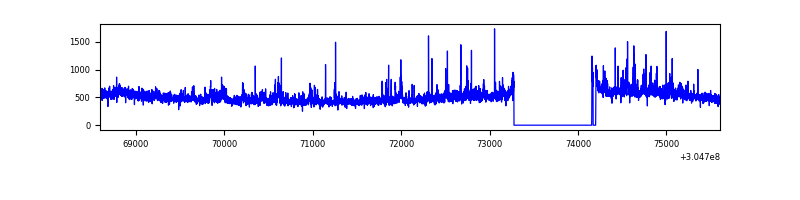 |
| D | 7011 | 6103 | 533 | 533 | 7.60% | 8.73% | 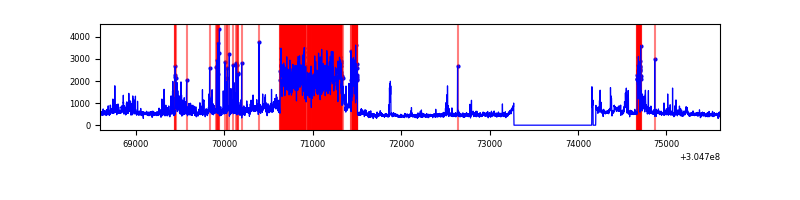 |
Top three noisy pixels from each quadrant. If the there are fewer than three noisy pixels in the level2.evt file, extra rows are filled as -1
| Pixel properties | Quadrant properties | ||||||
|---|---|---|---|---|---|---|---|
| Quadrant | DetID | PixID | Counts | Sigma | Mean | Median | Sigma |
| A | 13 | 252 | 205925 | 1354.98 | 747 | 730 | 151.4 |
| A | 8 | 6 | 14415 | 90.37 | 747 | 730 | 151.4 |
| A | 13 | 254 | 8709 | 52.69 | 747 | 730 | 151.4 |
| B | 0 | 189 | 163370 | 1159.86 | 738 | 719 | 140.2 |
| B | 3 | 64 | 75695 | 534.65 | 738 | 719 | 140.2 |
| B | 0 | 190 | 40962 | 286.97 | 738 | 719 | 140.2 |
| C | 3 | 233 | 244461 | 1458.45 | 711 | 714 | 167.1 |
| C | 14 | 238 | 112052 | 666.19 | 711 | 714 | 167.1 |
| C | 10 | 91 | 17145 | 98.31 | 711 | 714 | 167.1 |
| D | 7 | 238 | 1849548 | 10595.54 | 710 | 690 | 174.5 |
| D | 1 | 20 | 211884 | 1210.32 | 710 | 690 | 174.5 |
| D | 15 | 0 | 125800 | 716.99 | 710 | 690 | 174.5 |
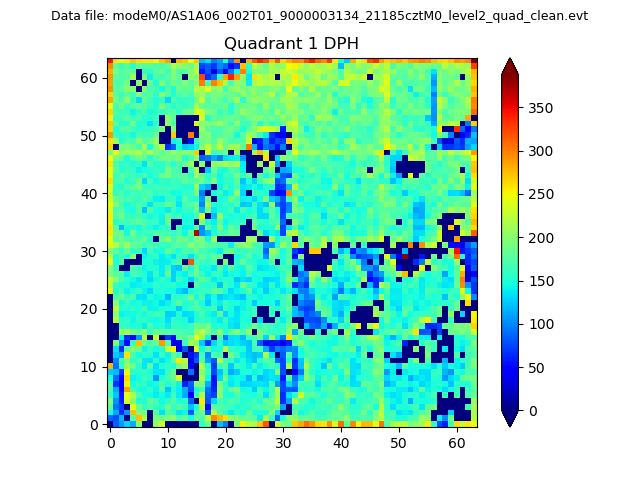
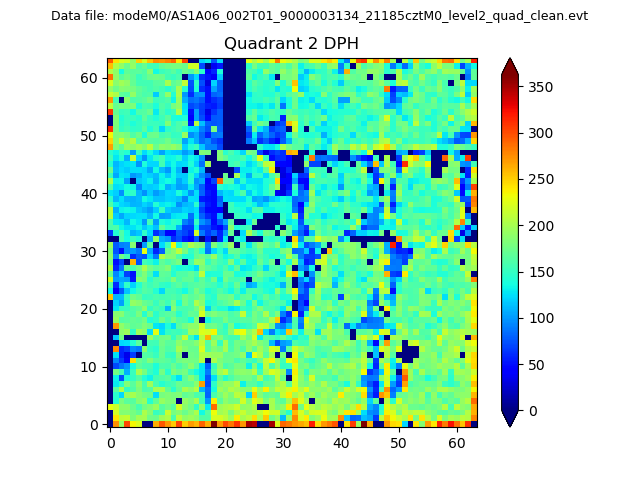
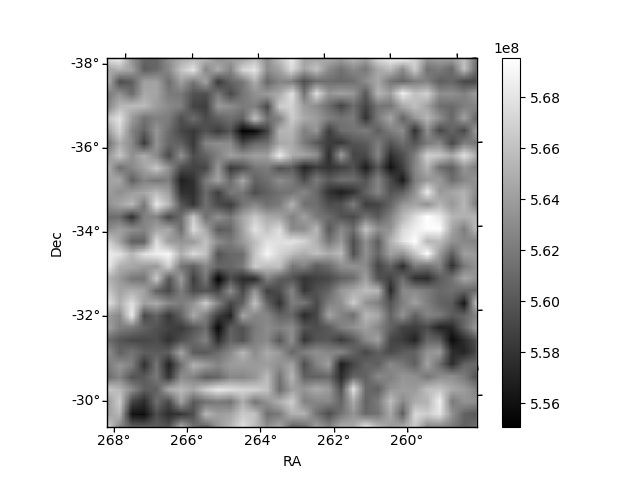
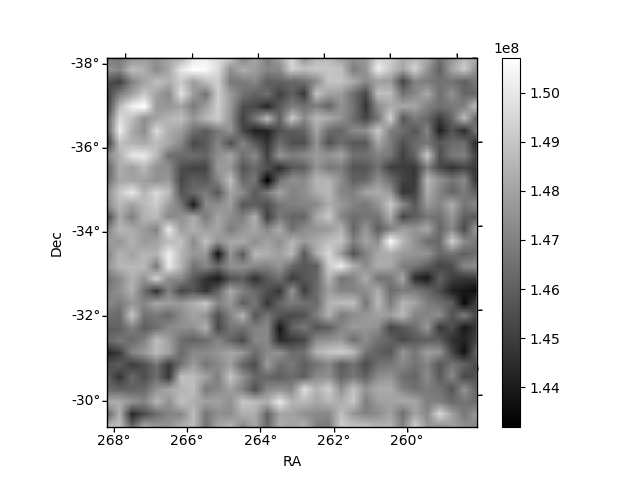
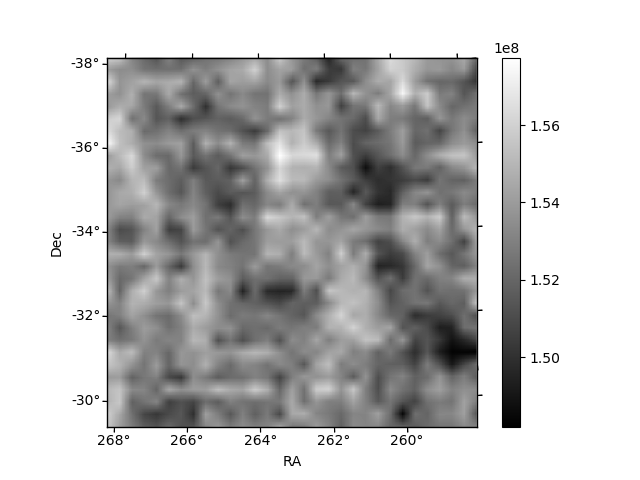
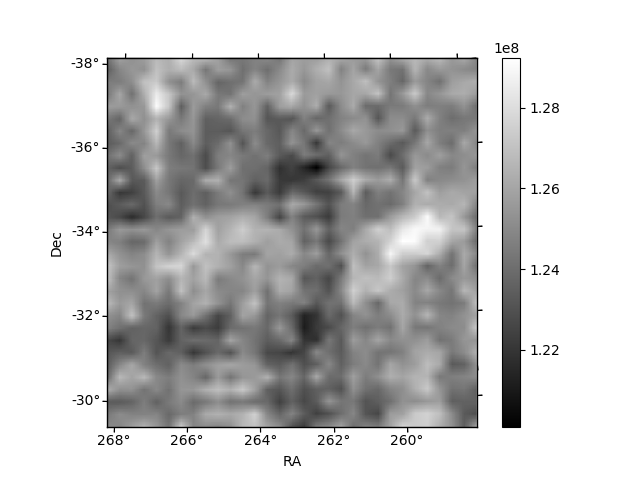
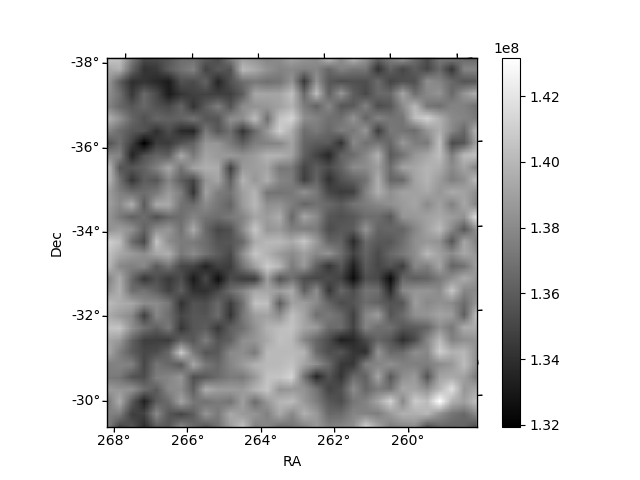
Histogram calculated using DETX and DETY for each event in the final _common_clean file
| Quadrant A |  |
 |
Quadrant B |
|---|---|---|---|
| Quadrant D | 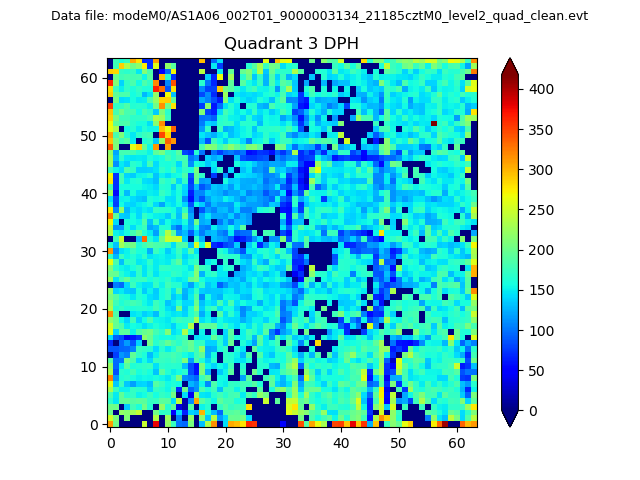 |
 |
Quadrant C |
| Plot type | Count rate plots | Images |
|---|---|---|
| Comparison with Poisson distribution Blue bars denote a histogram of data divided into 1 sec bins. Red curve is a Poisson curve with rate = median count rate of data. |
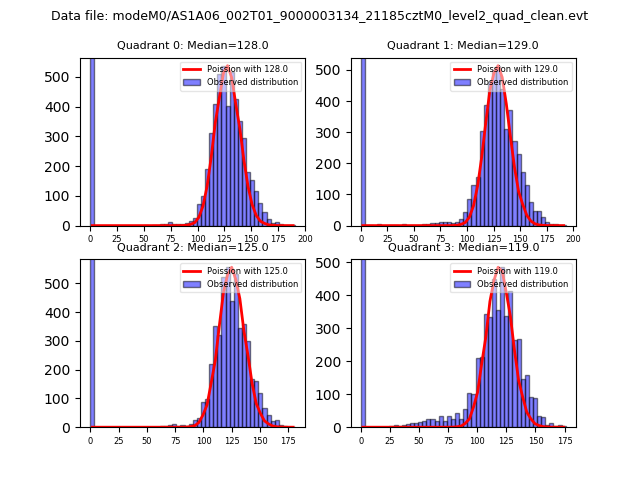 |
 |
| Quadrant-wise count rates Data is divided into 100 sec bins |
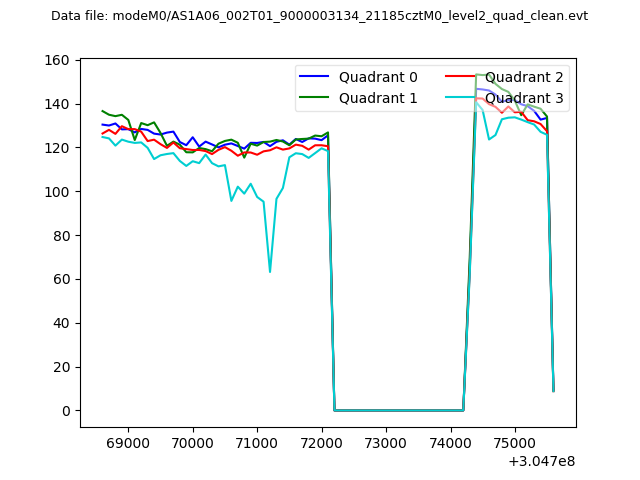 |
|
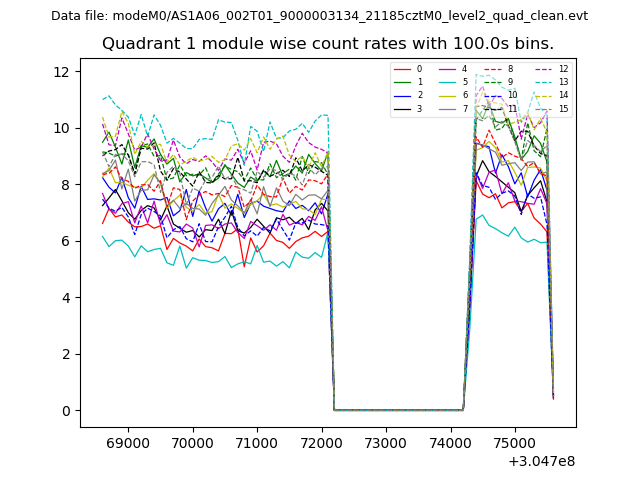
| Module-wise count rates for Quadrant A Data is divided into 100 sec bins |
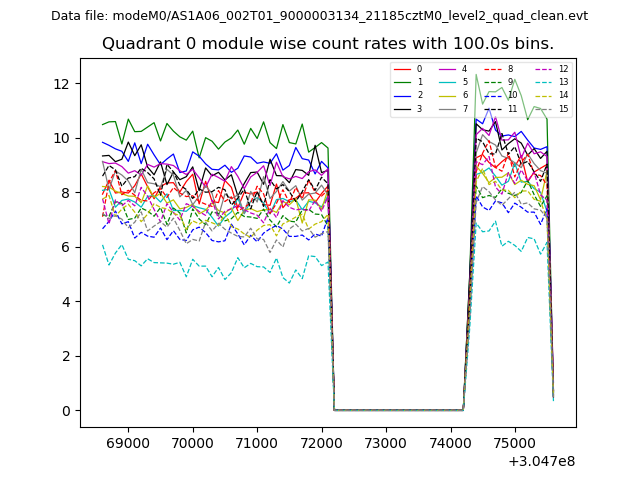 |
 |
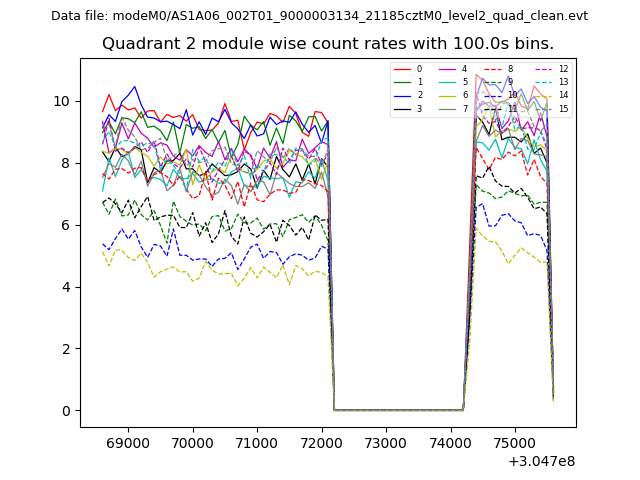
| Module-wise count rates for Quadrant B Data is divided into 100 sec bins |
 |
 |
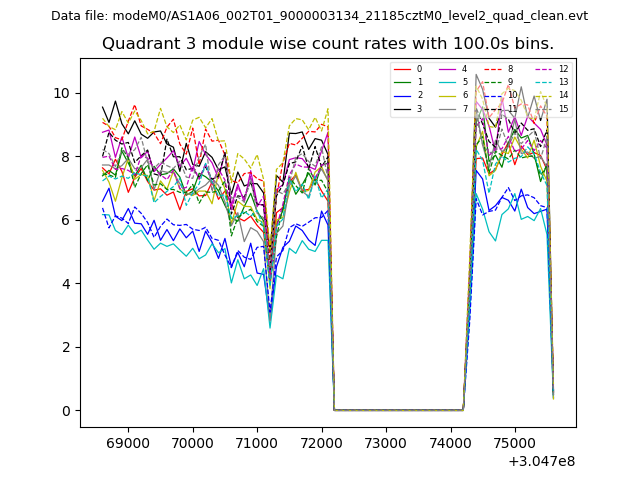
| Module-wise count rates for Quadrant C Data is divided into 100 sec bins |
 |
 |
| Module-wise count rates for Quadrant D Data is divided into 100 sec bins |
 |
 |
| Parameter | Plot |
|---|---|
| CZT HV Monitor | 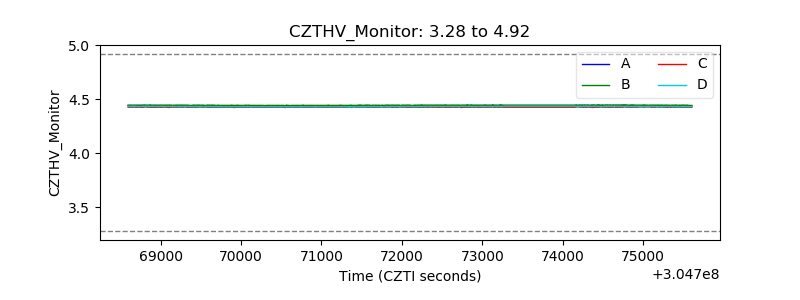 |
| D_VDD | 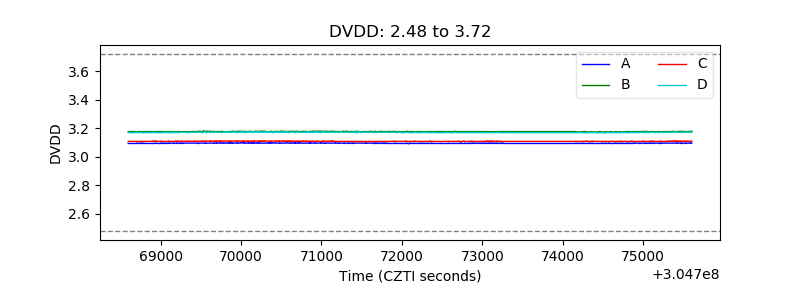 |
| Temperature 1 | 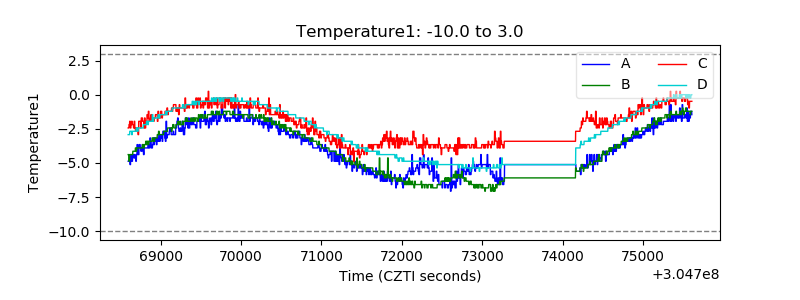 |
| Veto HV Monitor | 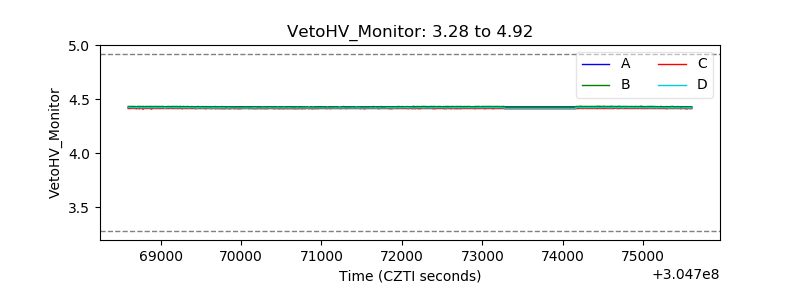 |
| Veto LLD | 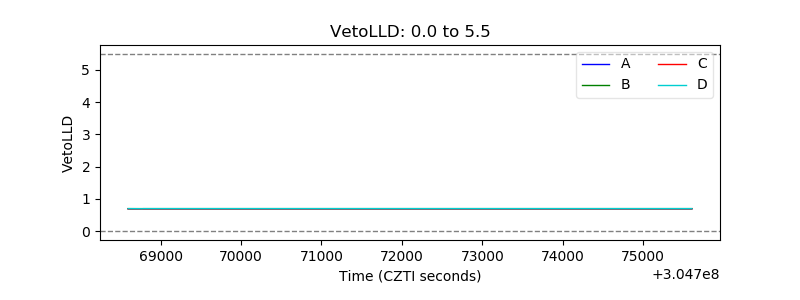 |
| Alpha Counter | 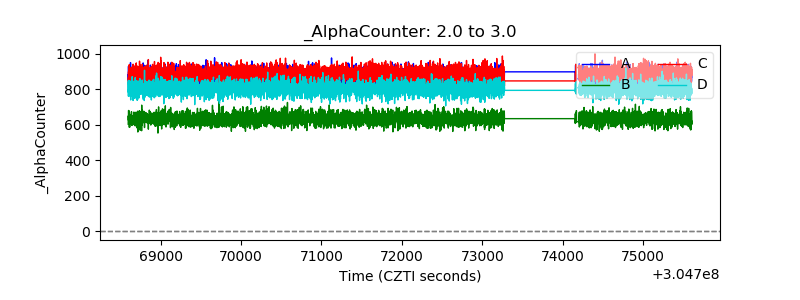 |
| _CPM_Rate | 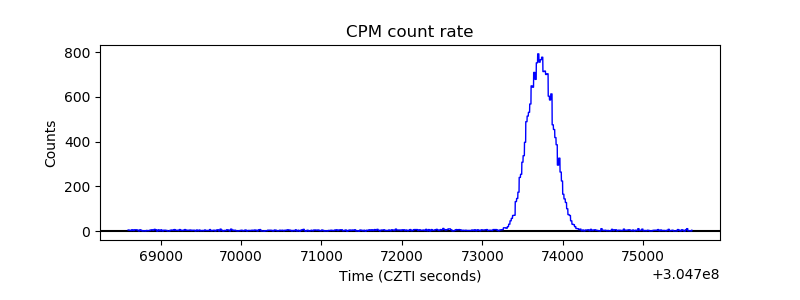 |
| CZT Counter | 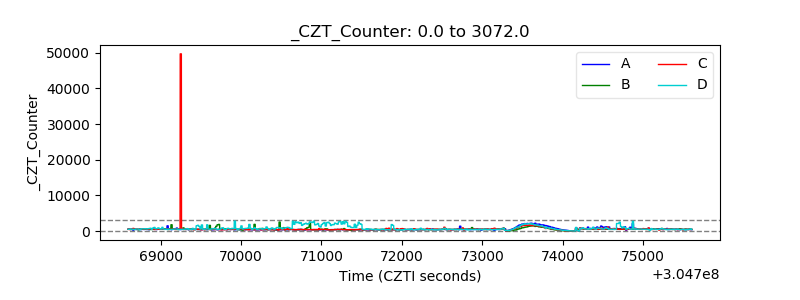 |
| +2.5 Volts monitor |  |
| +5 Volts monitor |  |
| _ROLL_ROT |  |
| _Roll_DEC | 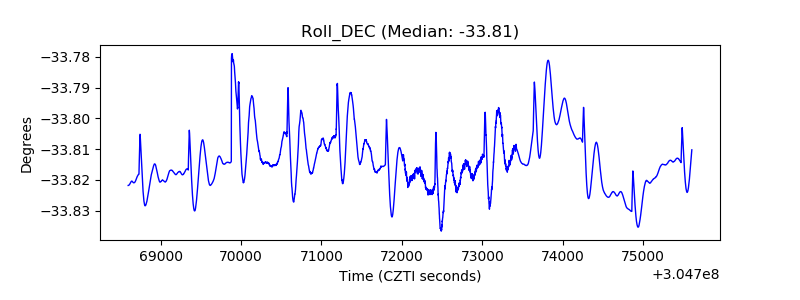 |
| _Roll_RA | 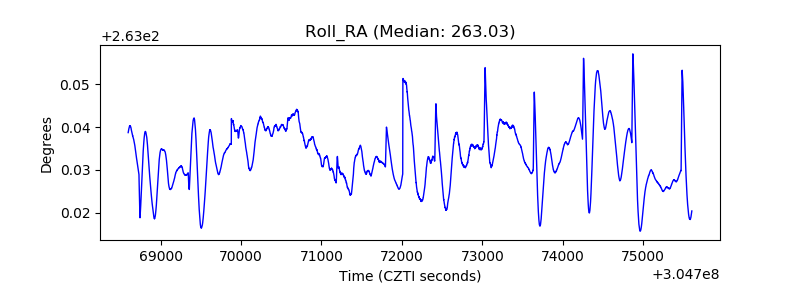 |
| Veto Counter |  |