| Param | Original file | Final file |
|---|---|---|
| Filename | modeM0/AS1A06_002T01_9000003134_21188cztM0_level2.evt | modeM0/AS1A06_002T01_9000003134_21188cztM0_level2_quad_clean.evt |
| Size (bytes) | 568,494,720 | 104,146,560 |
| Size | 542.2 MB | 99.3 MB |
| Events in quadrant A | 3,435,086 | 704,945 |
| Events in quadrant B | 3,533,961 | 707,550 |
| Events in quadrant C | 3,487,066 | 666,925 |
| Events in quadrant D | 6,323,561 | 624,026 |
| Mode SS | |||
|---|---|---|---|
| Quadrant | BADHDUFLAG | Total packets | Discarded packets |
| A | 0 | 130 | 0 |
| B | 0 | 130 | 0 |
| C | 0 | 130 | 0 |
| D | 0 | 130 | 0 |
| Mode M0 | |||
|---|---|---|---|
| Quadrant | BADHDUFLAG | Total packets | Discarded packets |
| A | 0 | 14563 | 1 |
| B | 0 | 14800 | 1 |
| C | 0 | 14679 | 1 |
| D | 0 | 23268 | 1 |
| Mode M9 | |||
|---|---|---|---|
| Quadrant | BADHDUFLAG | Total packets | Discarded packets |
| A | 0 | 12 | 0 |
| B | 0 | 12 | 0 |
| C | 0 | 12 | 0 |
| D | 0 | 12 | 0 |
| Quadrant | Total seconds | Saturated seconds | Saturation percentage |
|---|---|---|---|
| A | 6463 | 87 | 1.346124% |
| B | 6464 | 69 | 1.067450% |
| C | 6463 | 107 | 1.655578% |
| D | 6463 | 492 | 7.612564% |
Noise dominated data is calculated using 1-second bins in cleaned event files. If a bin has >2000 counts, and if more than 50% of those come from <1% of pixels, then it is considered to be noise-dominated and hence unusable.
| Quadrant | # 1 sec bins | Bins with >0 counts | Bins with >2000 counts | High rate bins dominated by noise | Noise dominated (total time) | Noise dominated (detector-on time) | Marked lightcurve |
|---|---|---|---|---|---|---|---|
| A | 7648 | 6463 | 2 | 2 | 0.03% | 0.03% | 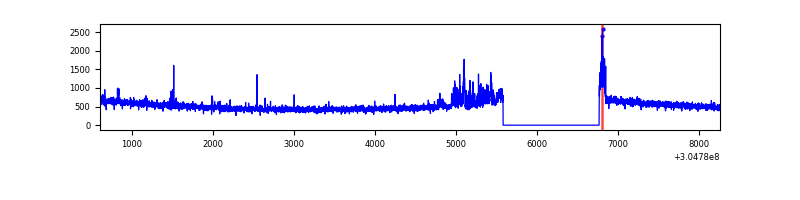 |
| B | 7649 | 6464 | 6 | 6 | 0.08% | 0.09% |  |
| C | 7648 | 6464 | 12 | 12 | 0.16% | 0.19% | 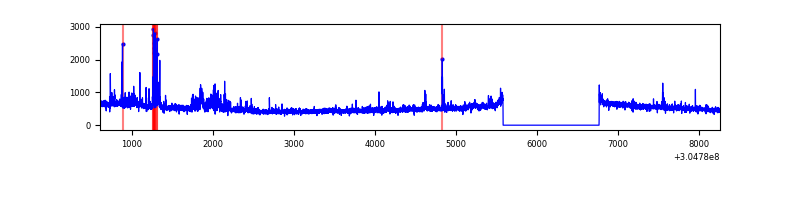 |
| D | 7648 | 6463 | 336 | 336 | 4.39% | 5.20% | 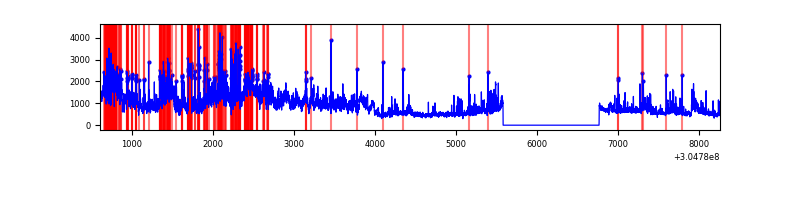 |
Top three noisy pixels from each quadrant. If the there are fewer than three noisy pixels in the level2.evt file, extra rows are filled as -1
| Pixel properties | Quadrant properties | ||||||
|---|---|---|---|---|---|---|---|
| Quadrant | DetID | PixID | Counts | Sigma | Mean | Median | Sigma |
| A | 13 | 252 | 181164 | 1068.45 | 839 | 825 | 168.8 |
| A | 5 | 16 | 14024 | 78.2 | 839 | 825 | 168.8 |
| A | 8 | 6 | 9298 | 50.2 | 839 | 825 | 168.8 |
| B | 0 | 182 | 71209 | 447.87 | 829 | 812 | 157.2 |
| B | 0 | 190 | 49137 | 307.45 | 829 | 812 | 157.2 |
| B | 3 | 64 | 41944 | 261.68 | 829 | 812 | 157.2 |
| C | 3 | 233 | 296590 | 1623.81 | 786 | 791 | 182.2 |
| C | 14 | 238 | 124865 | 681.11 | 786 | 791 | 182.2 |
| C | 13 | 61 | 5581 | 26.3 | 786 | 791 | 182.2 |
| D | 7 | 238 | 1388279 | 7255.44 | 785 | 763 | 191.2 |
| D | 1 | 20 | 1191299 | 6225.41 | 785 | 763 | 191.2 |
| D | 1 | 52 | 547944 | 2861.26 | 785 | 763 | 191.2 |
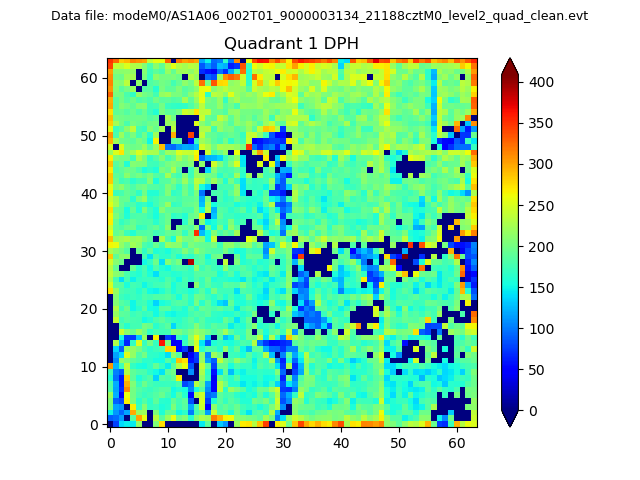
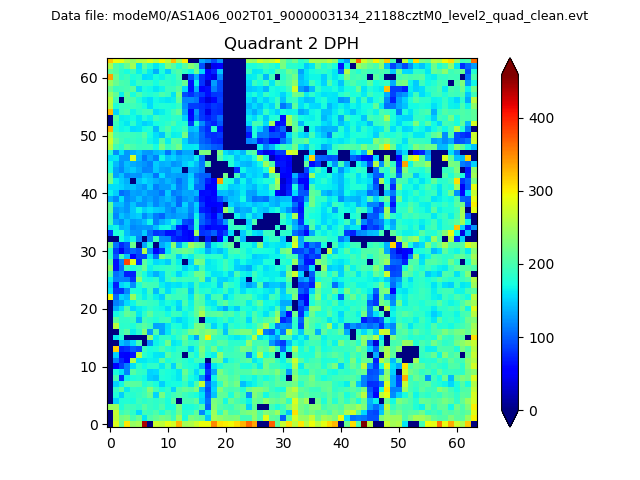
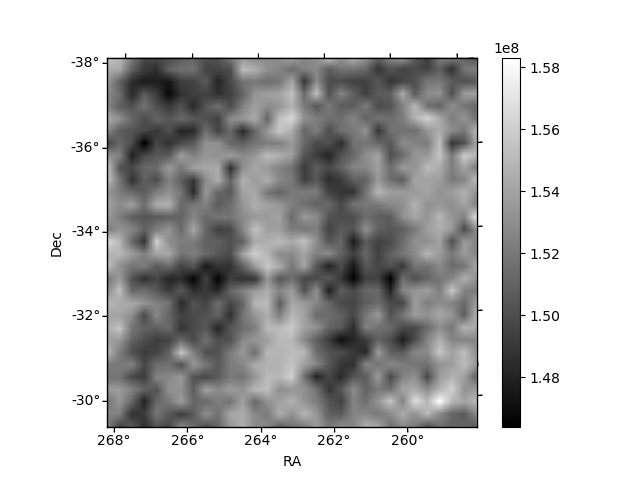
Histogram calculated using DETX and DETY for each event in the final _common_clean file
| Quadrant A | 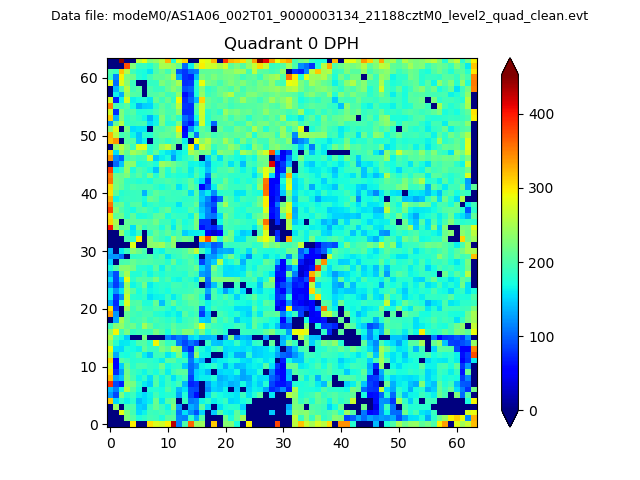 |
 |
Quadrant B |
|---|---|---|---|
| Quadrant D | 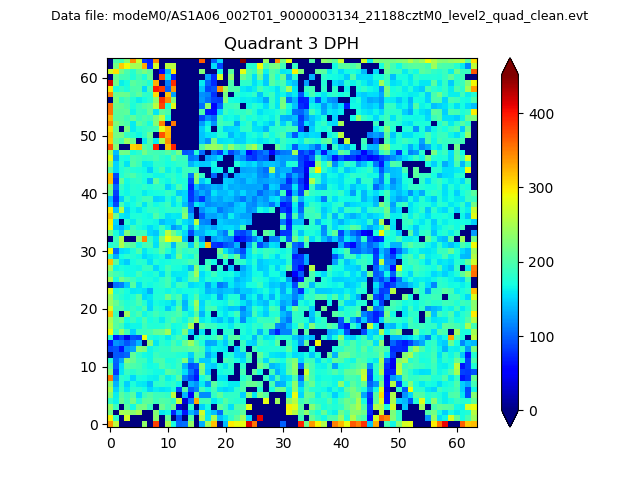 |
 |
Quadrant C |
| Plot type | Count rate plots | Images |
|---|---|---|
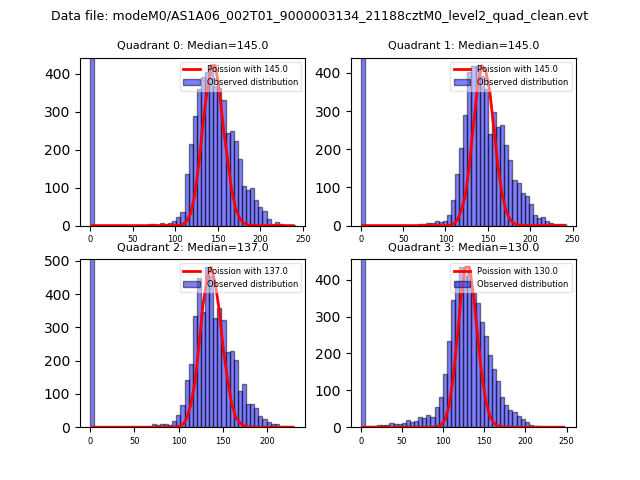
| Comparison with Poisson distribution Blue bars denote a histogram of data divided into 1 sec bins. Red curve is a Poisson curve with rate = median count rate of data. |
 |
 |
| Quadrant-wise count rates Data is divided into 100 sec bins |
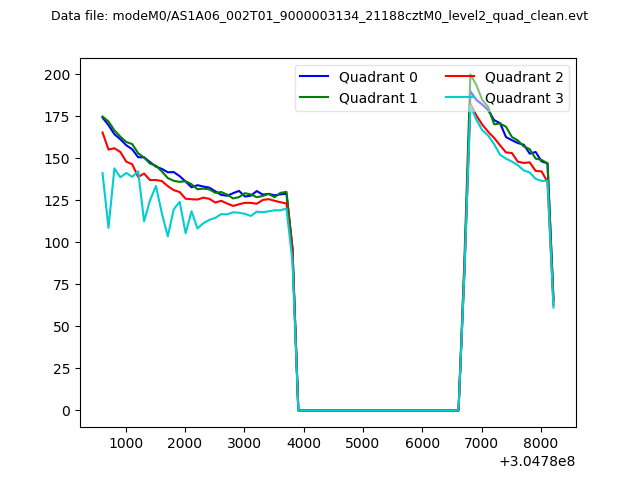 |
|
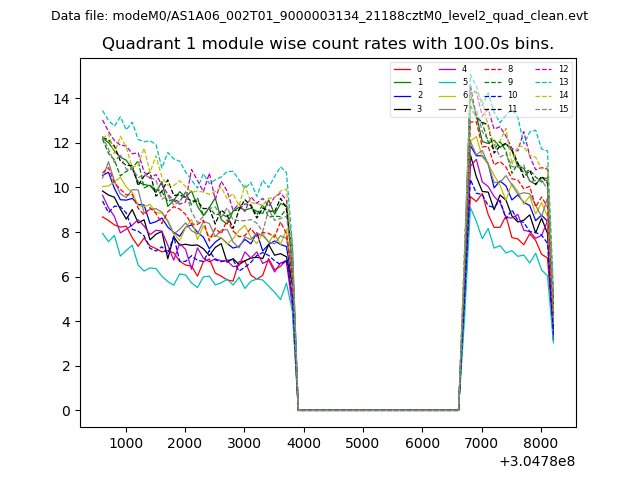
| Module-wise count rates for Quadrant A Data is divided into 100 sec bins |
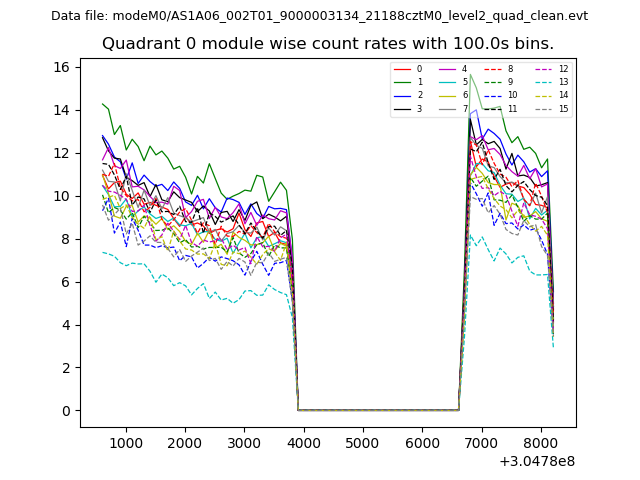 |
 |
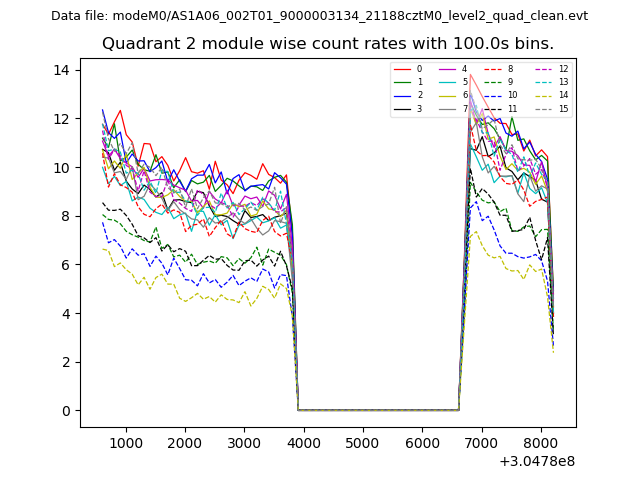
| Module-wise count rates for Quadrant B Data is divided into 100 sec bins |
 |
 |
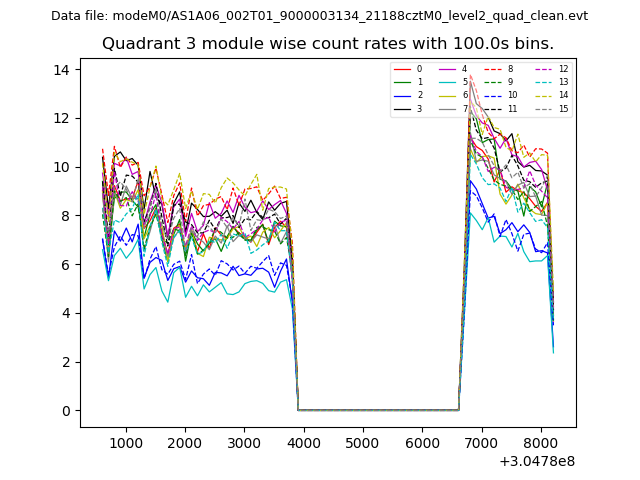
| Module-wise count rates for Quadrant C Data is divided into 100 sec bins |
 |
 |
| Module-wise count rates for Quadrant D Data is divided into 100 sec bins |
 |
 |
| Parameter | Plot |
|---|---|
| CZT HV Monitor | 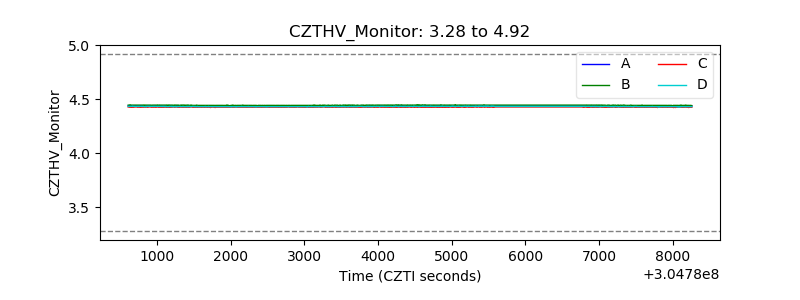 |
| D_VDD | 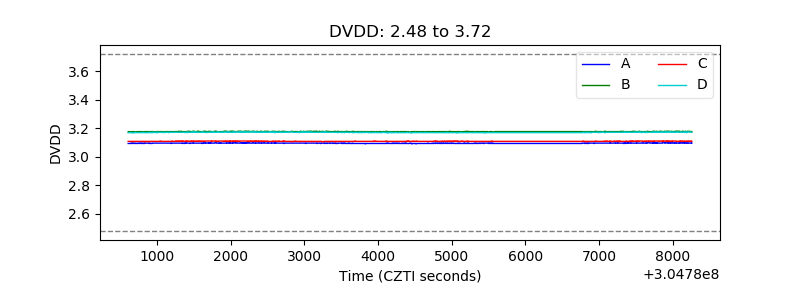 |
| Temperature 1 | 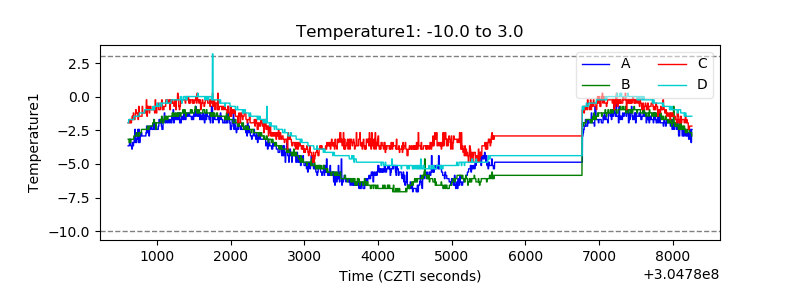 |
| Veto HV Monitor | 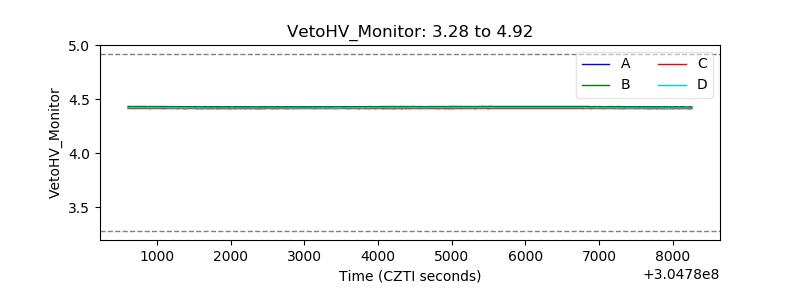 |
| Veto LLD | 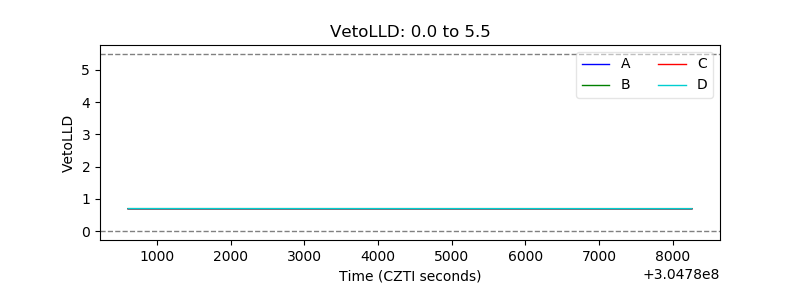 |
| Alpha Counter | 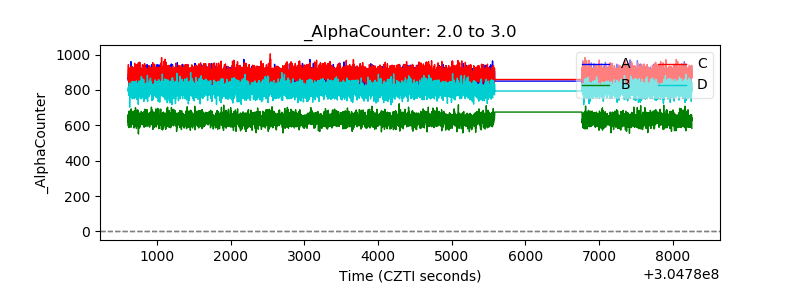 |
| _CPM_Rate | 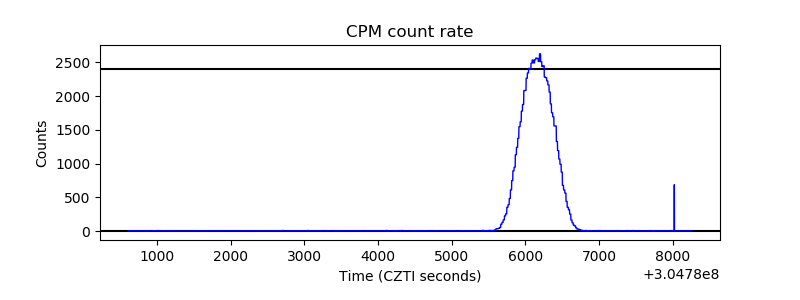 |
| CZT Counter | 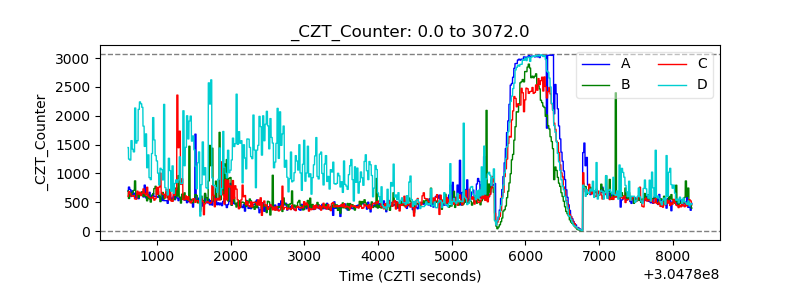 |
| +2.5 Volts monitor |  |
| +5 Volts monitor | 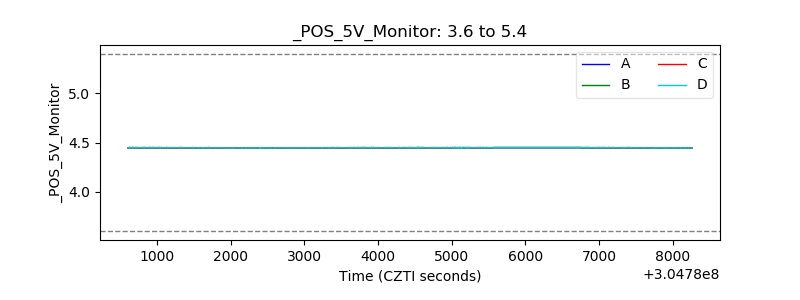 |
| _ROLL_ROT | 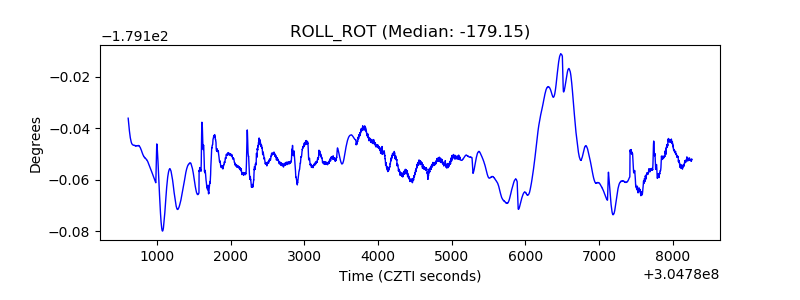 |
| _Roll_DEC | 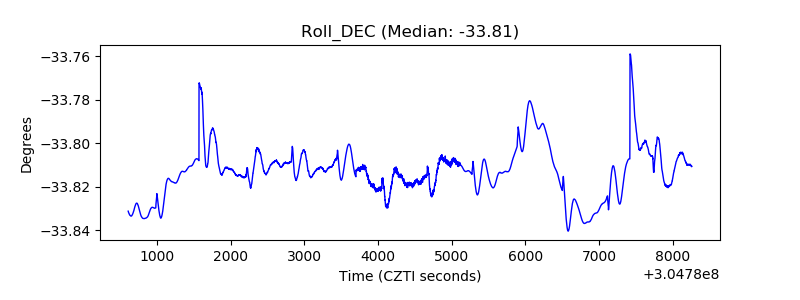 |
| _Roll_RA | 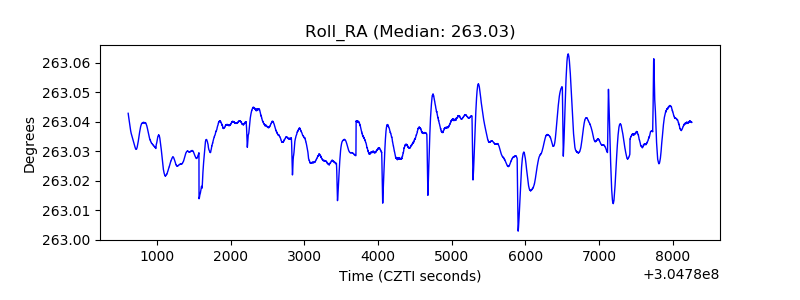 |
| Veto Counter | 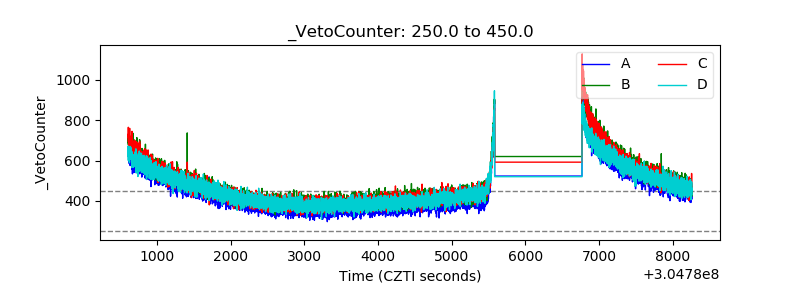 |