| Param | Original file | Final file |
|---|---|---|
| Filename | modeM0/AS1A06_002T01_9000003134_21189cztM0_level2.evt | modeM0/AS1A06_002T01_9000003134_21189cztM0_level2_quad_clean.evt |
| Size (bytes) | 482,993,280 | 102,326,400 |
| Size | 460.6 MB | 97.6 MB |
| Events in quadrant A | 3,386,785 | 686,908 |
| Events in quadrant B | 3,524,906 | 690,991 |
| Events in quadrant C | 3,350,868 | 650,369 |
| Events in quadrant D | 3,936,240 | 629,839 |
| Mode SS | |||
|---|---|---|---|
| Quadrant | BADHDUFLAG | Total packets | Discarded packets |
| A | 0 | 128 | 0 |
| B | 0 | 128 | 0 |
| C | 0 | 128 | 0 |
| D | 0 | 128 | 0 |
| Mode M0 | |||
|---|---|---|---|
| Quadrant | BADHDUFLAG | Total packets | Discarded packets |
| A | 0 | 14201 | 2 |
| B | 0 | 14574 | 2 |
| C | 0 | 14065 | 2 |
| D | 0 | 16011 | 2 |
| Mode M9 | |||
|---|---|---|---|
| Quadrant | BADHDUFLAG | Total packets | Discarded packets |
| A | 0 | 15 | 0 |
| B | 0 | 16 | 0 |
| C | 0 | 16 | 0 |
| D | 0 | 16 | 0 |
| Quadrant | Total seconds | Saturated seconds | Saturation percentage |
|---|---|---|---|
| A | 6320 | 78 | 1.234177% |
| B | 6320 | 84 | 1.329114% |
| C | 6320 | 78 | 1.234177% |
| D | 6320 | 110 | 1.740506% |
Noise dominated data is calculated using 1-second bins in cleaned event files. If a bin has >2000 counts, and if more than 50% of those come from <1% of pixels, then it is considered to be noise-dominated and hence unusable.
| Quadrant | # 1 sec bins | Bins with >0 counts | Bins with >2000 counts | High rate bins dominated by noise | Noise dominated (total time) | Noise dominated (detector-on time) | Marked lightcurve |
|---|---|---|---|---|---|---|---|
| A | 7610 | 6321 | 2 | 2 | 0.03% | 0.03% | 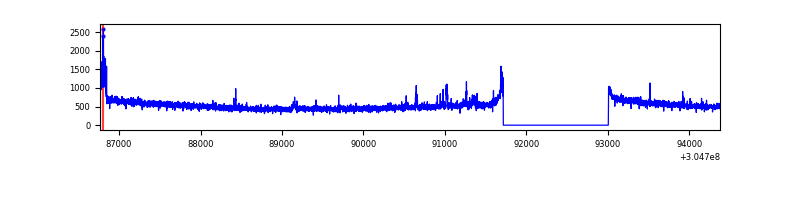 |
| B | 7610 | 6321 | 15 | 15 | 0.20% | 0.24% | 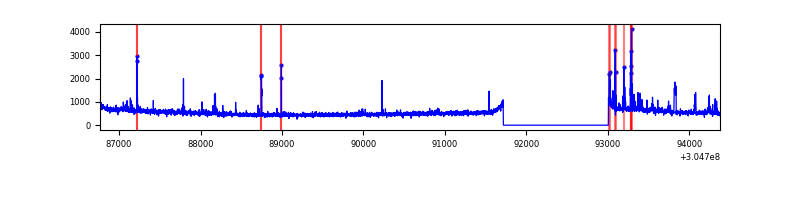 |
| C | 7610 | 6321 | 0 | 0 | 0.00% | 0.00% | 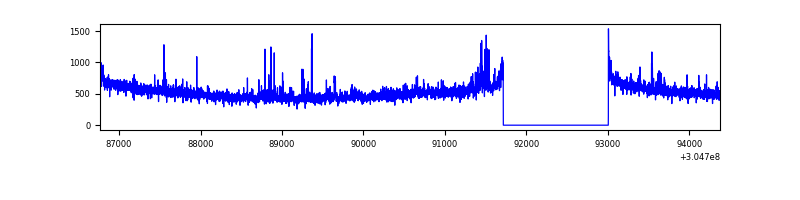 |
| D | 7610 | 6321 | 40 | 40 | 0.53% | 0.63% | 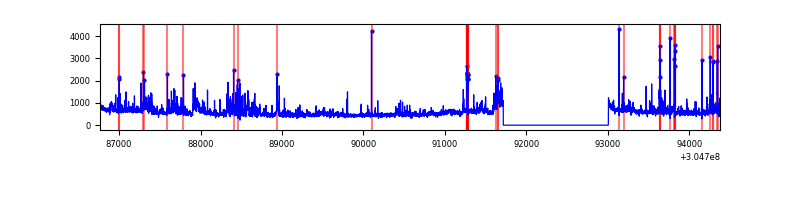 |
Top three noisy pixels from each quadrant. If the there are fewer than three noisy pixels in the level2.evt file, extra rows are filled as -1
| Pixel properties | Quadrant properties | ||||||
|---|---|---|---|---|---|---|---|
| Quadrant | DetID | PixID | Counts | Sigma | Mean | Median | Sigma |
| A | 13 | 252 | 97082 | 568.26 | 847 | 834 | 169.4 |
| A | 8 | 6 | 10060 | 54.47 | 847 | 834 | 169.4 |
| A | 15 | 236 | 9740 | 52.58 | 847 | 834 | 169.4 |
| B | 3 | 64 | 59596 | 373.77 | 835 | 817 | 157.3 |
| B | 0 | 189 | 49650 | 310.52 | 835 | 817 | 157.3 |
| B | 0 | 182 | 47281 | 295.46 | 835 | 817 | 157.3 |
| C | 3 | 233 | 137845 | 753.75 | 789 | 796 | 181.8 |
| C | 14 | 238 | 126658 | 692.23 | 789 | 796 | 181.8 |
| C | 0 | 10 | 7994 | 39.59 | 789 | 796 | 181.8 |
| D | 1 | 52 | 308835 | 1605.52 | 804 | 781 | 191.9 |
| D | 1 | 20 | 188758 | 979.7 | 804 | 781 | 191.9 |
| D | 13 | 153 | 137309 | 711.56 | 804 | 781 | 191.9 |
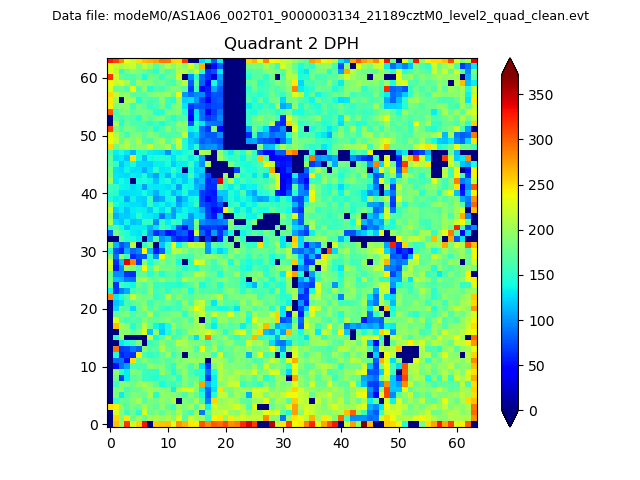
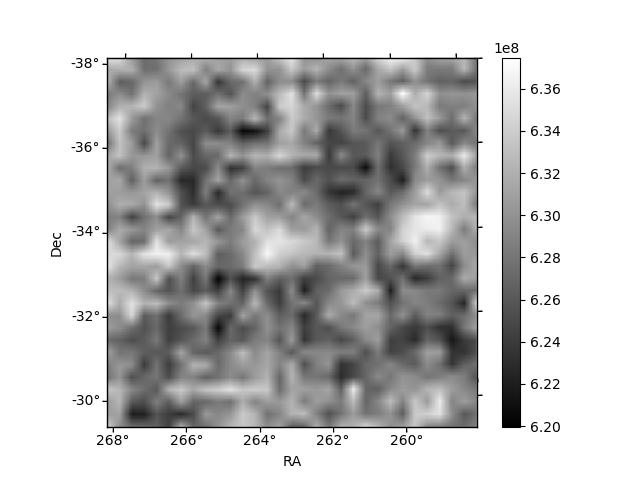
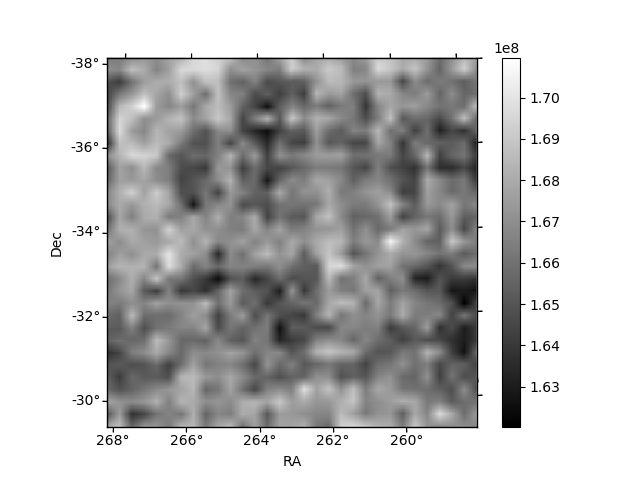
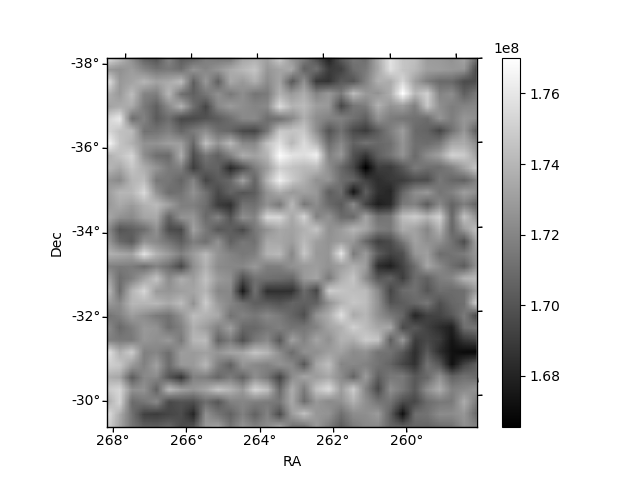
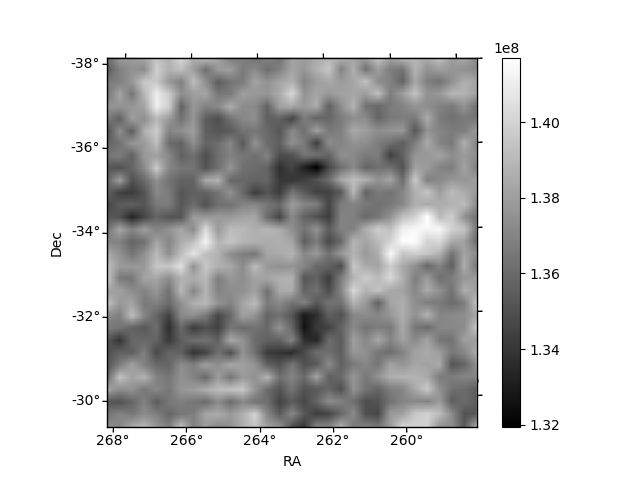
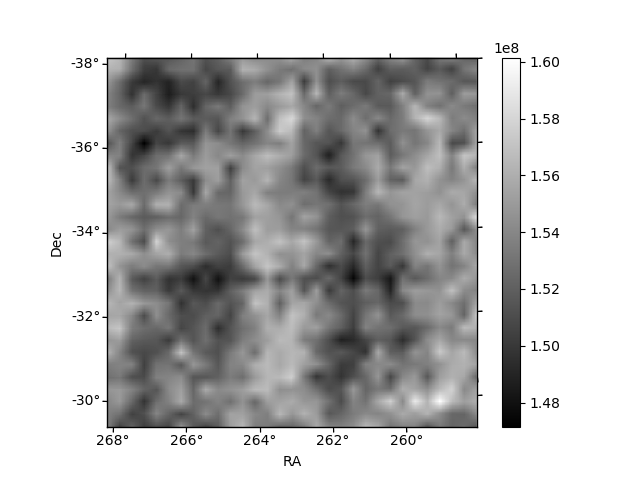
Histogram calculated using DETX and DETY for each event in the final _common_clean file
| Quadrant A | 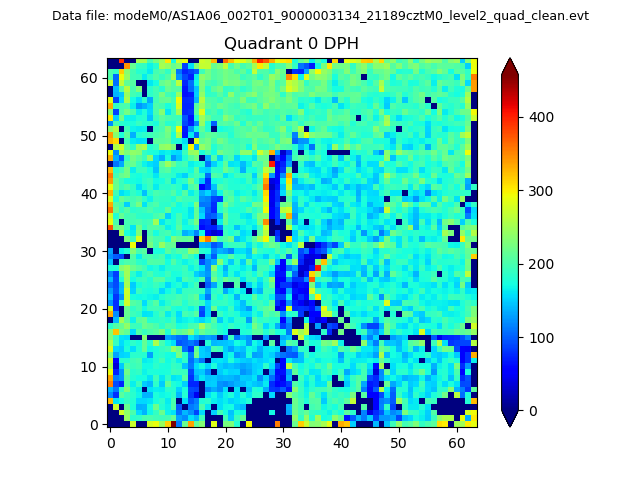 |
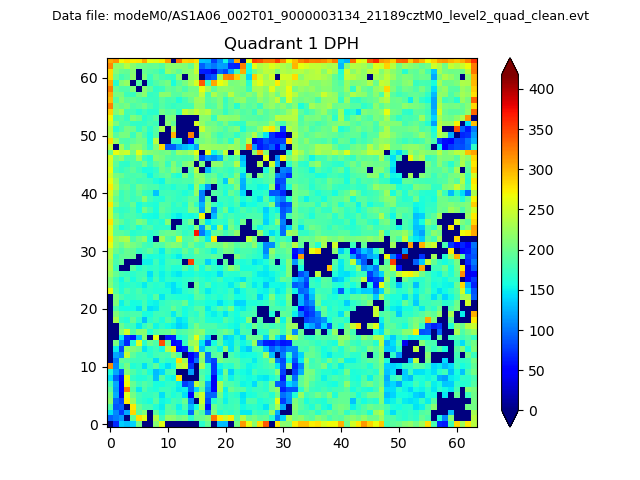 |
Quadrant B |
|---|---|---|---|
| Quadrant D | 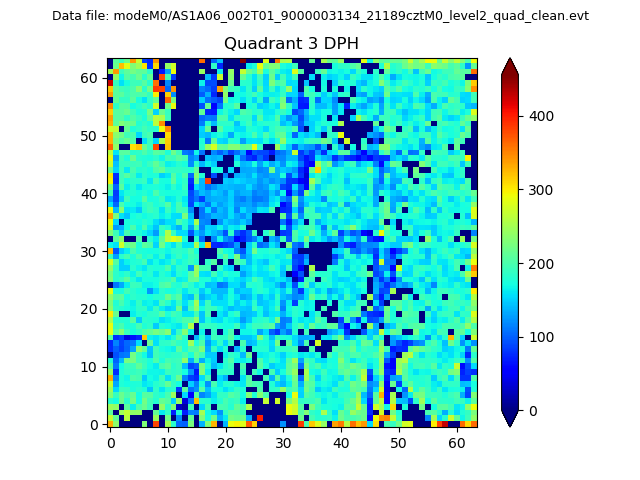 |
 |
Quadrant C |
| Plot type | Count rate plots | Images |
|---|---|---|
| Comparison with Poisson distribution Blue bars denote a histogram of data divided into 1 sec bins. Red curve is a Poisson curve with rate = median count rate of data. |
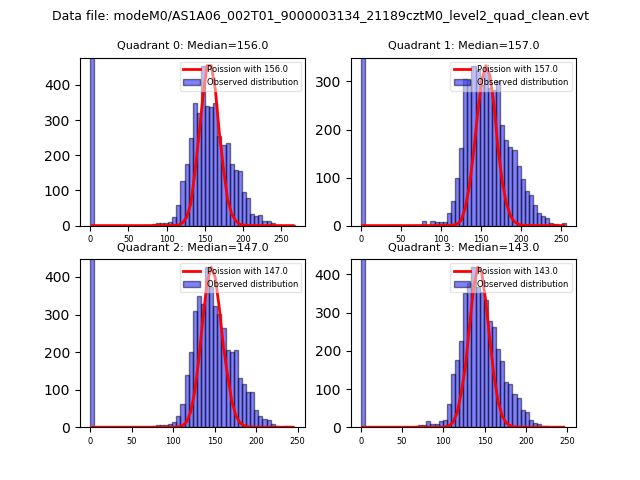 |
 |
| Quadrant-wise count rates Data is divided into 100 sec bins |
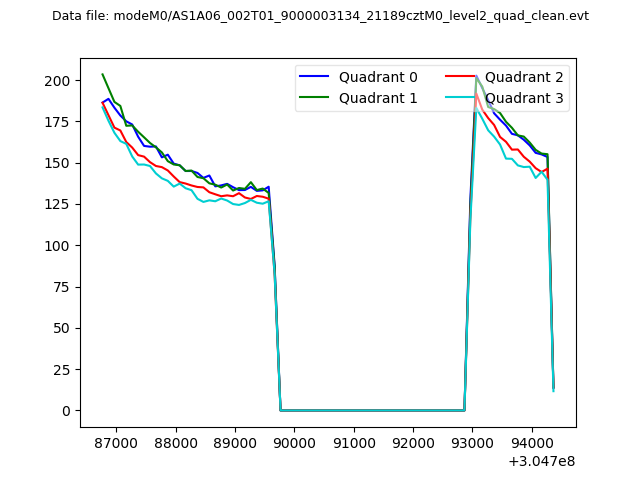 |
|
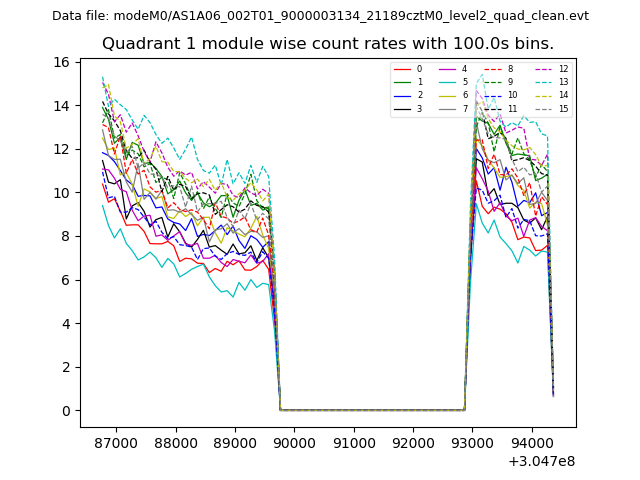
| Module-wise count rates for Quadrant A Data is divided into 100 sec bins |
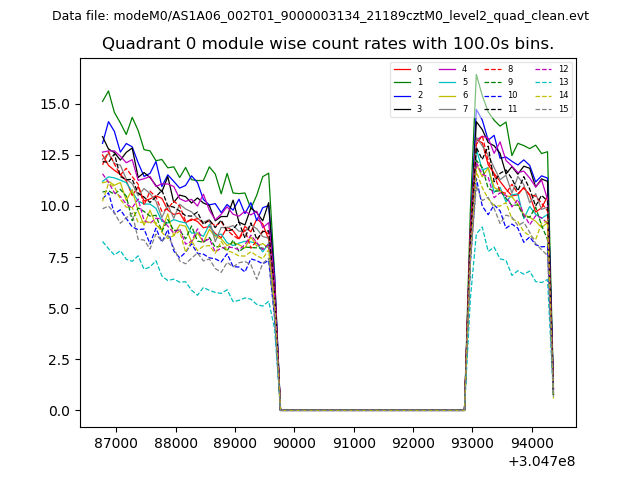 |
 |
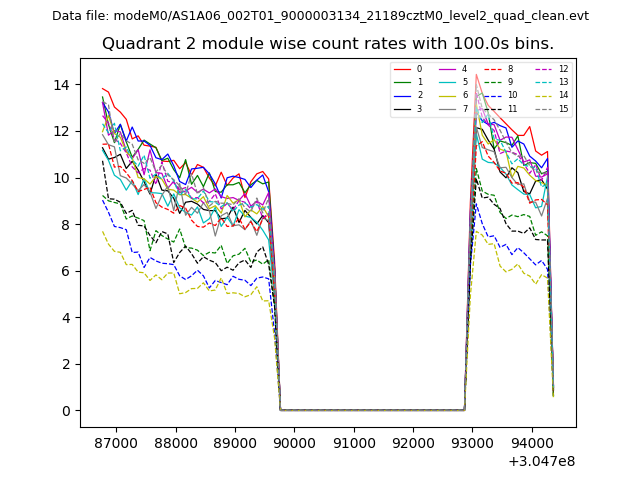
| Module-wise count rates for Quadrant B Data is divided into 100 sec bins |
 |
 |
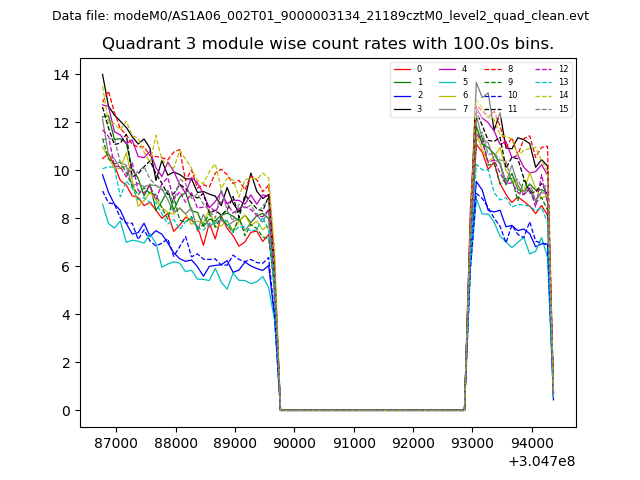
| Module-wise count rates for Quadrant C Data is divided into 100 sec bins |
 |
 |
| Module-wise count rates for Quadrant D Data is divided into 100 sec bins |
 |
 |
| Parameter | Plot |
|---|---|
| CZT HV Monitor | 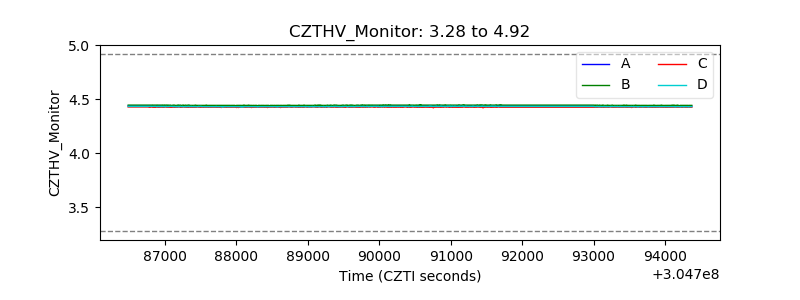 |
| D_VDD | 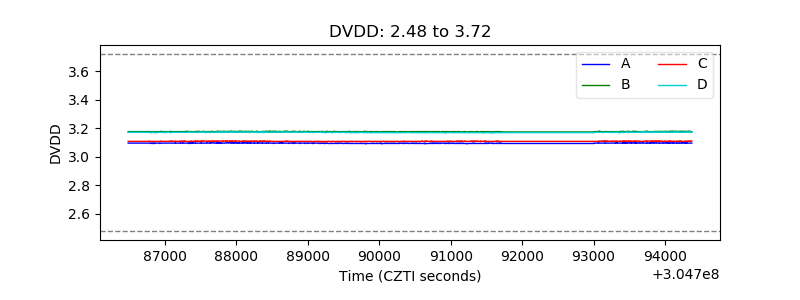 |
| Temperature 1 | 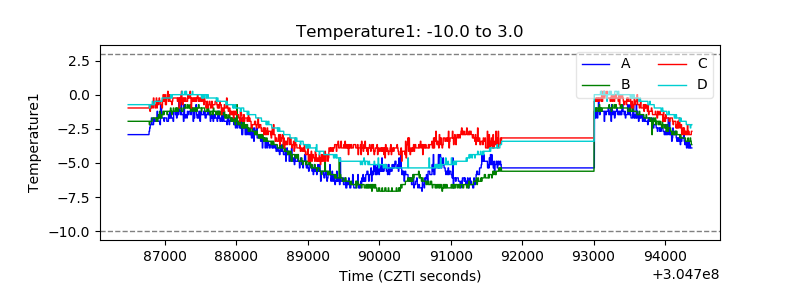 |
| Veto HV Monitor | 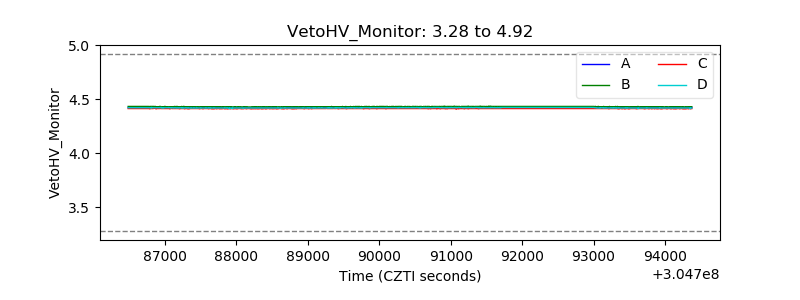 |
| Veto LLD | 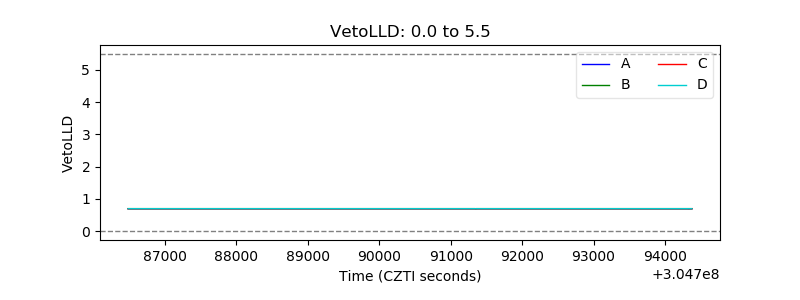 |
| Alpha Counter | 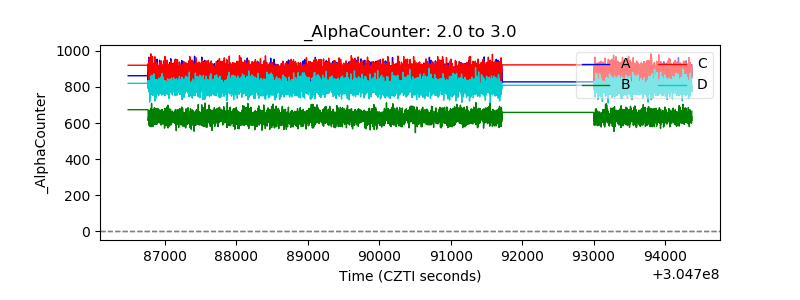 |
| _CPM_Rate | 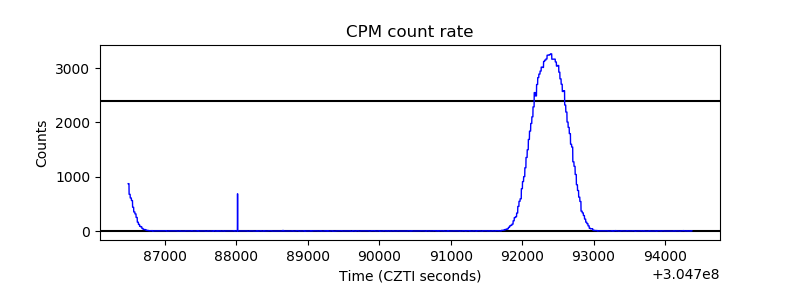 |
| CZT Counter | 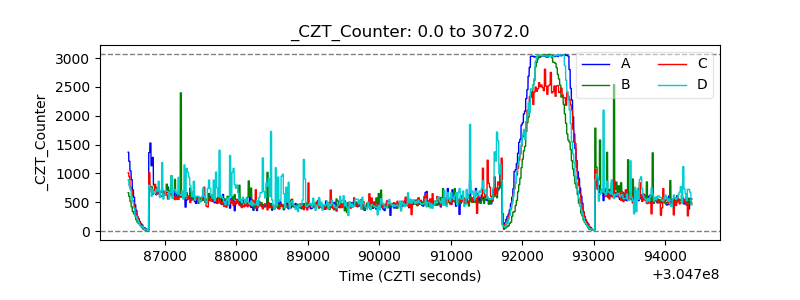 |
| +2.5 Volts monitor |  |
| +5 Volts monitor |  |
| _ROLL_ROT | 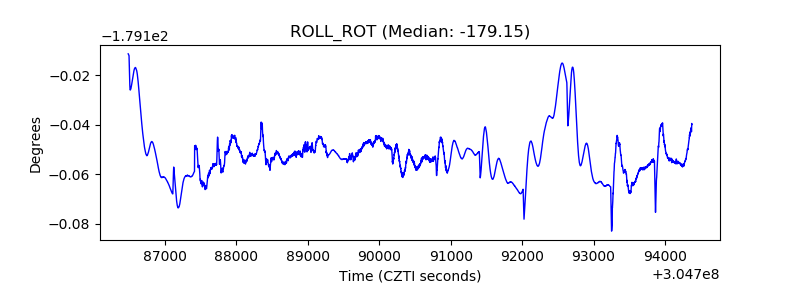 |
| _Roll_DEC | 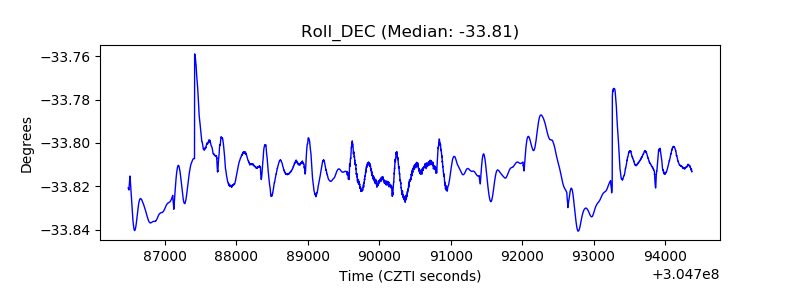 |
| _Roll_RA | 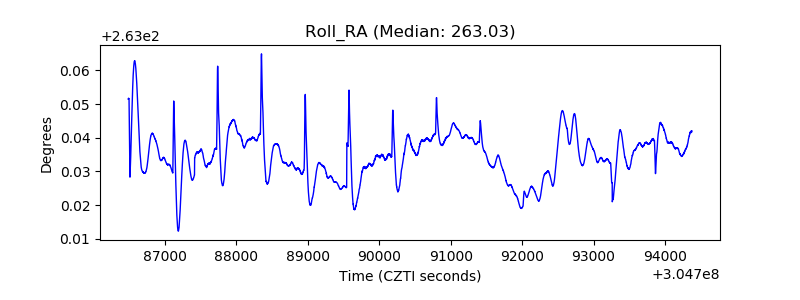 |
| Veto Counter | 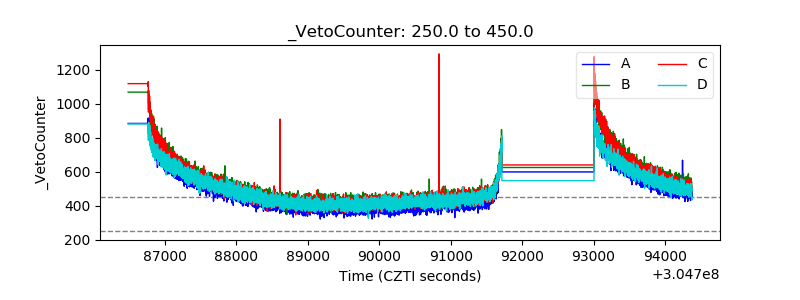 |