| Param | Original file | Final file |
|---|---|---|
| Filename | modeM0/AS1A06_002T01_9000003134_21190cztM0_level2.evt | modeM0/AS1A06_002T01_9000003134_21190cztM0_level2_quad_clean.evt |
| Size (bytes) | 511,320,960 | 95,143,680 |
| Size | 487.6 MB | 90.7 MB |
| Events in quadrant A | 3,884,459 | 634,905 |
| Events in quadrant B | 3,555,483 | 642,527 |
| Events in quadrant C | 3,303,086 | 605,599 |
| Events in quadrant D | 4,331,197 | 574,566 |
| Mode SS | |||
|---|---|---|---|
| Quadrant | BADHDUFLAG | Total packets | Discarded packets |
| A | 0 | 124 | 0 |
| B | 0 | 124 | 0 |
| C | 0 | 124 | 0 |
| D | 0 | 124 | 0 |
| Mode M0 | |||
|---|---|---|---|
| Quadrant | BADHDUFLAG | Total packets | Discarded packets |
| A | 0 | 15444 | 2 |
| B | 0 | 14442 | 2 |
| C | 0 | 13550 | 2 |
| D | 0 | 16990 | 2 |
| Mode M9 | |||
|---|---|---|---|
| Quadrant | BADHDUFLAG | Total packets | Discarded packets |
| A | 0 | 17 | 0 |
| B | 0 | 18 | 0 |
| C | 0 | 18 | 0 |
| D | 0 | 18 | 0 |
| Quadrant | Total seconds | Saturated seconds | Saturation percentage |
|---|---|---|---|
| A | 6065 | 137 | 2.258862% |
| B | 6065 | 117 | 1.929101% |
| C | 6065 | 96 | 1.582852% |
| D | 6065 | 168 | 2.769992% |
Noise dominated data is calculated using 1-second bins in cleaned event files. If a bin has >2000 counts, and if more than 50% of those come from <1% of pixels, then it is considered to be noise-dominated and hence unusable.
| Quadrant | # 1 sec bins | Bins with >0 counts | Bins with >2000 counts | High rate bins dominated by noise | Noise dominated (total time) | Noise dominated (detector-on time) | Marked lightcurve |
|---|---|---|---|---|---|---|---|
| A | 7425 | 6065 | 79 | 79 | 1.06% | 1.30% | 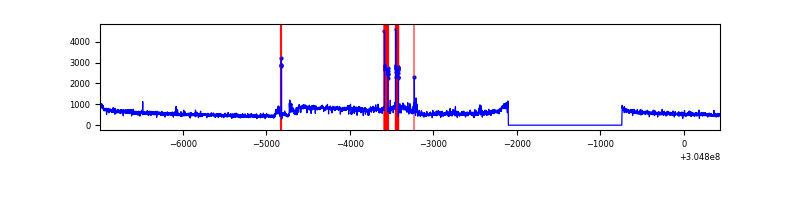 |
| B | 7425 | 6066 | 19 | 19 | 0.26% | 0.31% | 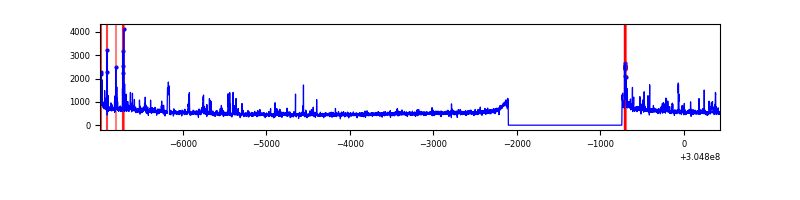 |
| C | 7425 | 6066 | 1 | 1 | 0.01% | 0.02% |  |
| D | 7425 | 6066 | 137 | 137 | 1.85% | 2.26% |  |
Top three noisy pixels from each quadrant. If the there are fewer than three noisy pixels in the level2.evt file, extra rows are filled as -1
| Pixel properties | Quadrant properties | ||||||
|---|---|---|---|---|---|---|---|
| Quadrant | DetID | PixID | Counts | Sigma | Mean | Median | Sigma |
| A | 15 | 236 | 708604 | 4367.03 | 811 | 796 | 162.1 |
| A | 13 | 252 | 49757 | 302.08 | 811 | 796 | 162.1 |
| A | 13 | 254 | 9126 | 51.39 | 811 | 796 | 162.1 |
| B | 0 | 182 | 134422 | 872.64 | 814 | 798 | 153.1 |
| B | 3 | 64 | 74162 | 479.11 | 814 | 798 | 153.1 |
| B | 0 | 219 | 36765 | 234.88 | 814 | 798 | 153.1 |
| C | 3 | 233 | 160245 | 894.97 | 770 | 776 | 178.2 |
| C | 14 | 238 | 122820 | 684.93 | 770 | 776 | 178.2 |
| C | 0 | 10 | 20557 | 111.01 | 770 | 776 | 178.2 |
| D | 1 | 20 | 785935 | 4138.0 | 775 | 750 | 189.8 |
| D | 15 | 0 | 179759 | 943.39 | 775 | 750 | 189.8 |
| D | 1 | 52 | 167095 | 876.65 | 775 | 750 | 189.8 |
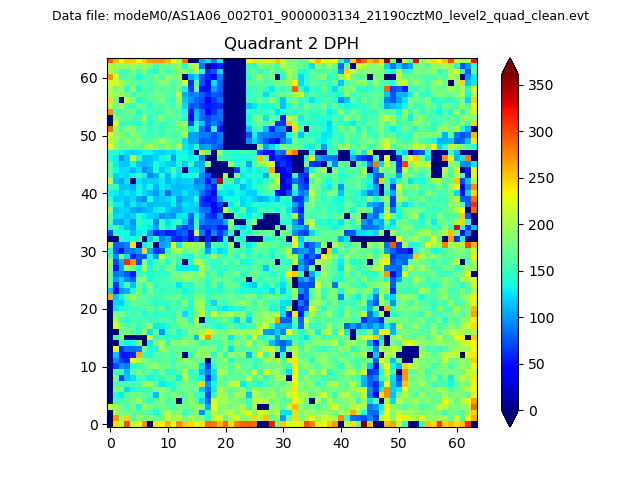
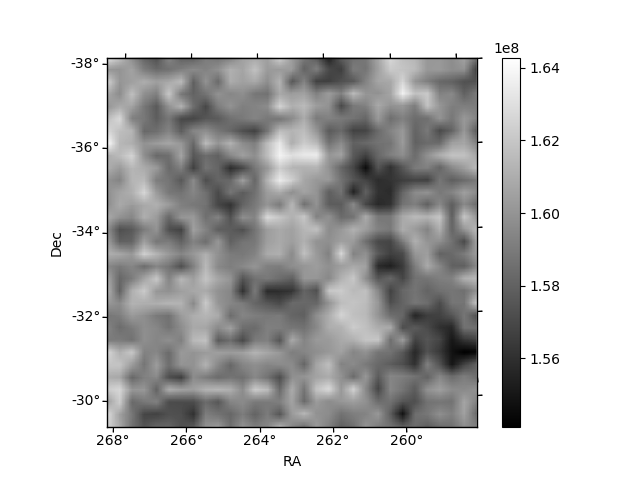
Histogram calculated using DETX and DETY for each event in the final _common_clean file
| Quadrant A | 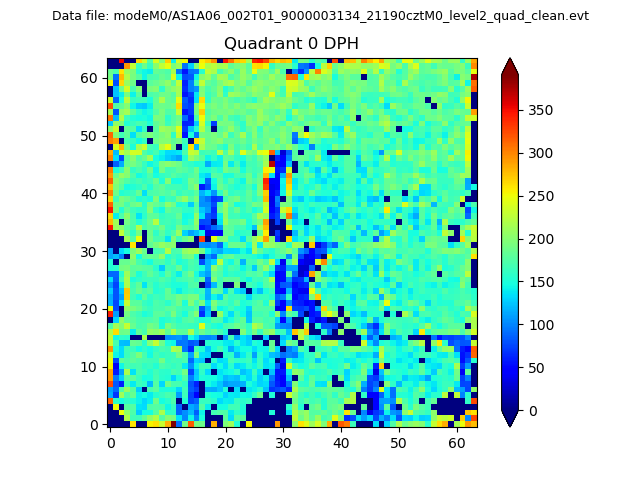 |
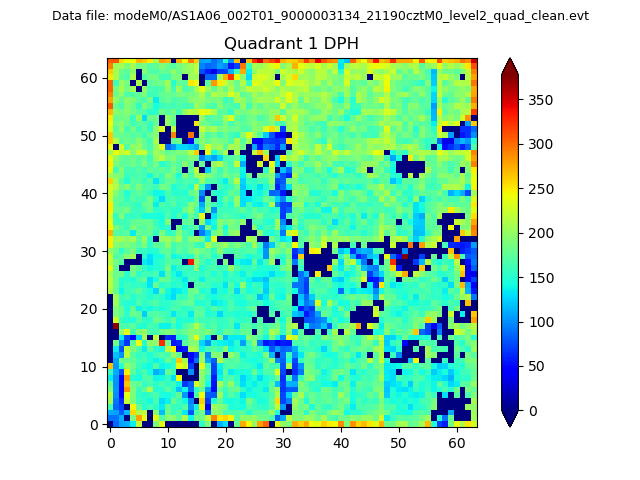 |
Quadrant B |
|---|---|---|---|
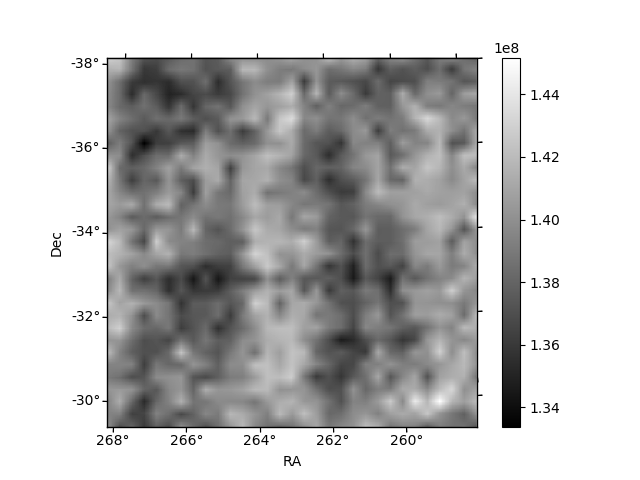
| Quadrant D | 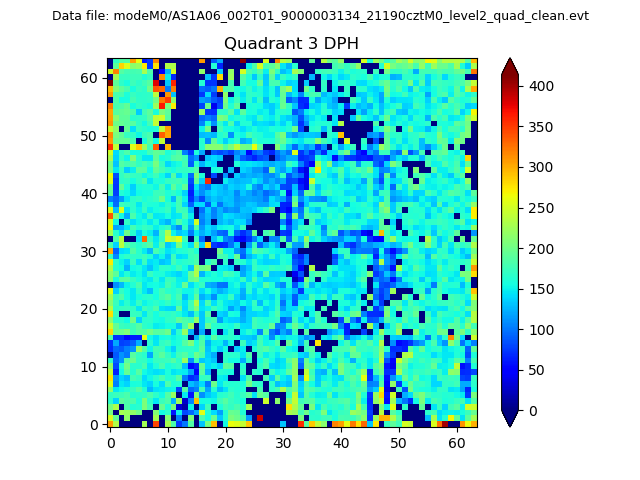 |
 |
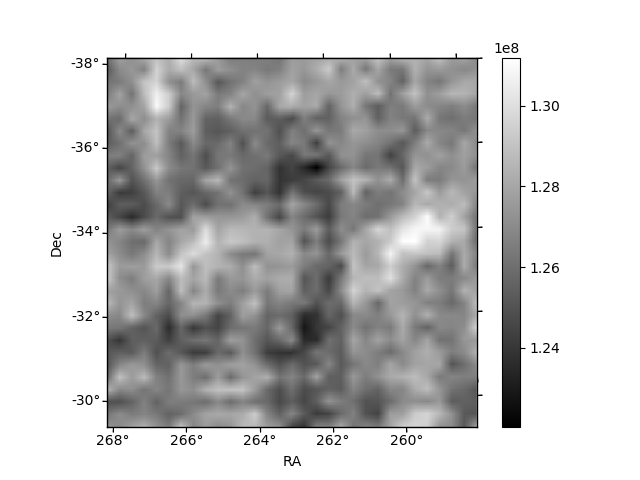
Quadrant C |
| Plot type | Count rate plots | Images |
|---|---|---|
| Comparison with Poisson distribution Blue bars denote a histogram of data divided into 1 sec bins. Red curve is a Poisson curve with rate = median count rate of data. |
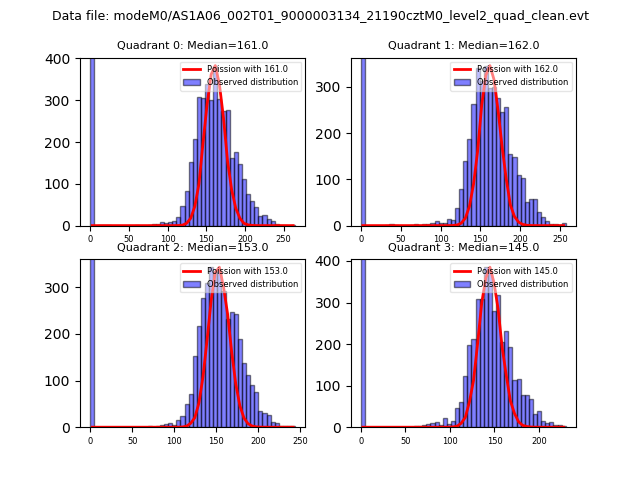 |
 |
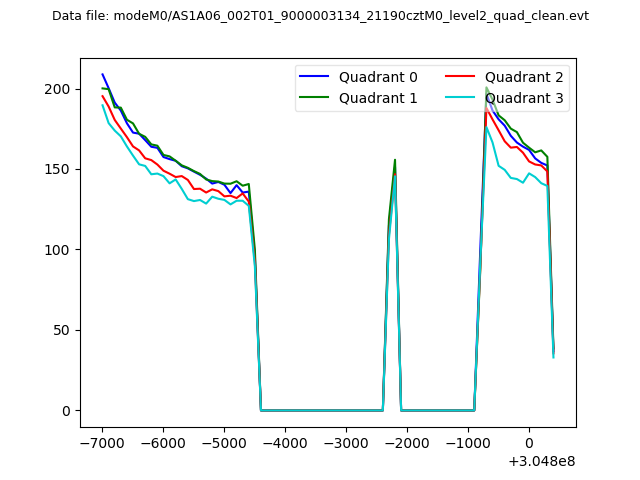
| Quadrant-wise count rates Data is divided into 100 sec bins |
 |
|
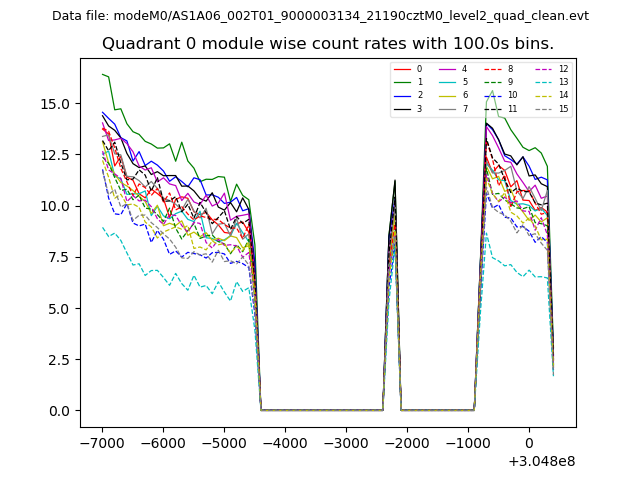
| Module-wise count rates for Quadrant A Data is divided into 100 sec bins |
 |
 |
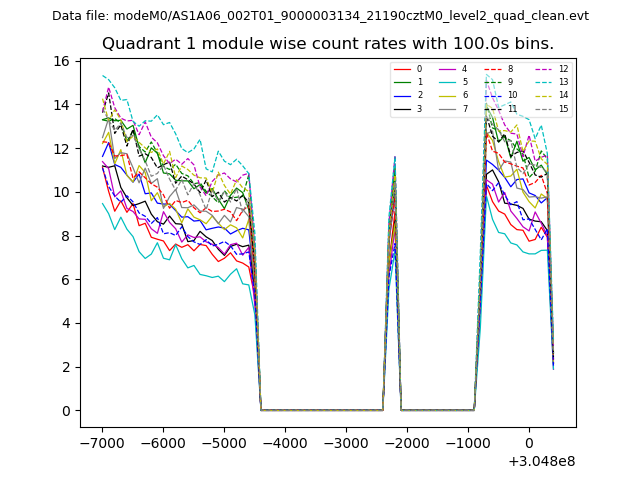
| Module-wise count rates for Quadrant B Data is divided into 100 sec bins |
 |
 |
| Module-wise count rates for Quadrant C Data is divided into 100 sec bins |
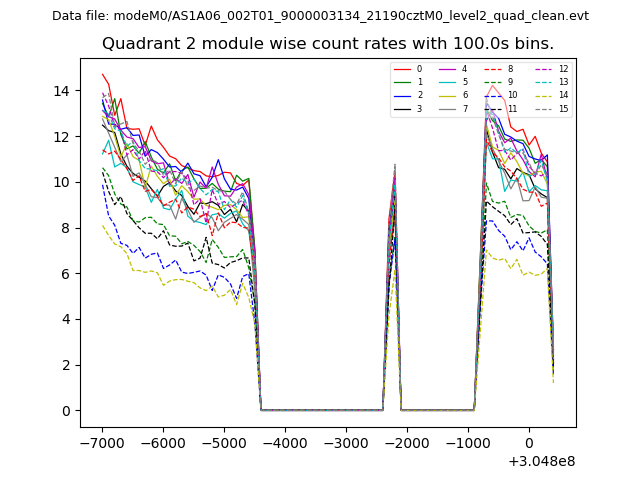 |
 |
| Module-wise count rates for Quadrant D Data is divided into 100 sec bins |
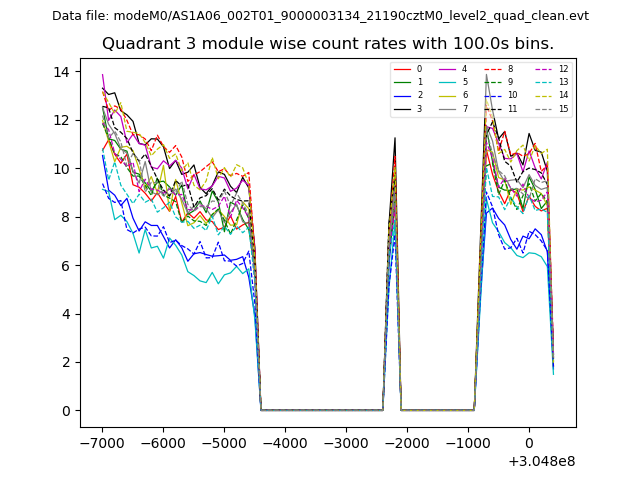 |
 |
| Parameter | Plot |
|---|---|
| CZT HV Monitor | 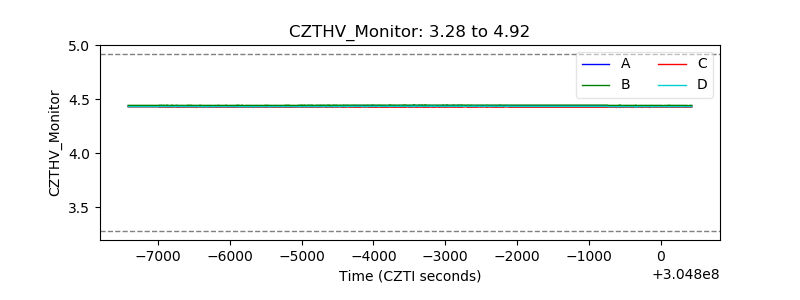 |
| D_VDD | 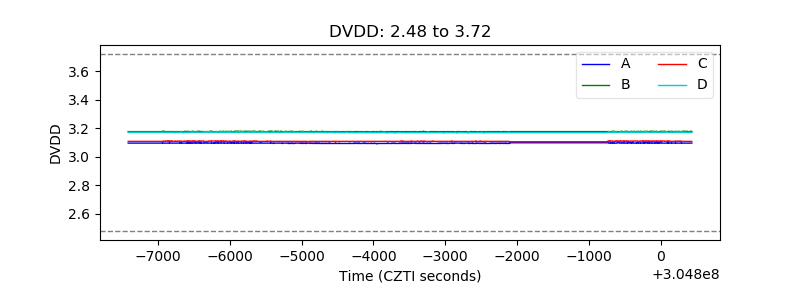 |
| Temperature 1 | 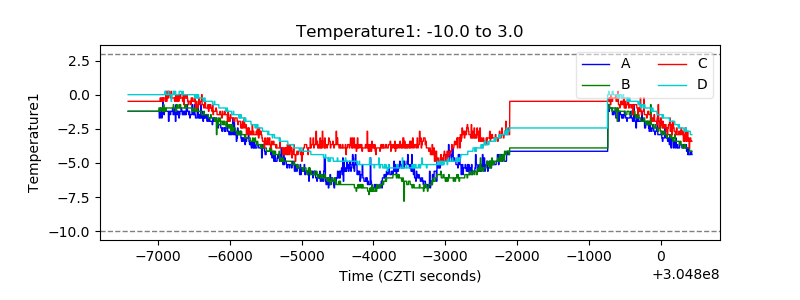 |
| Veto HV Monitor | 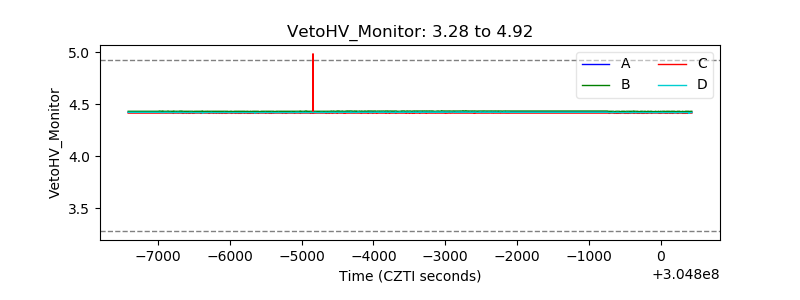 |
| Veto LLD | 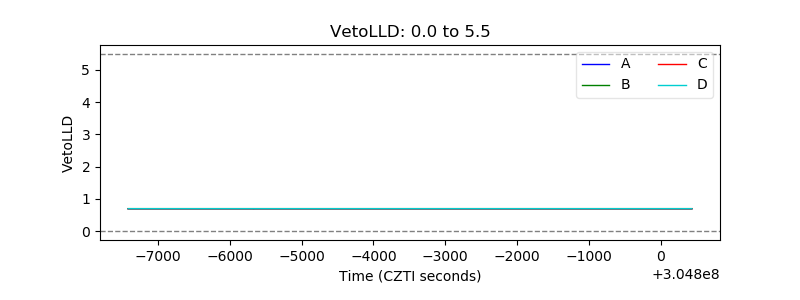 |
| Alpha Counter | 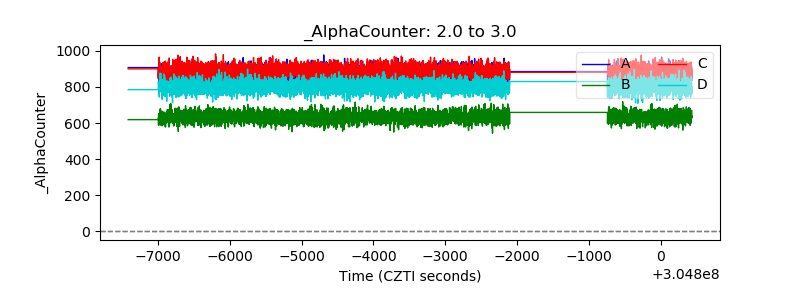 |
| _CPM_Rate | 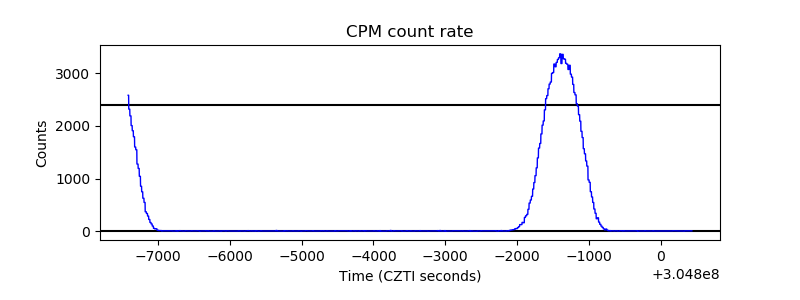 |
| CZT Counter | 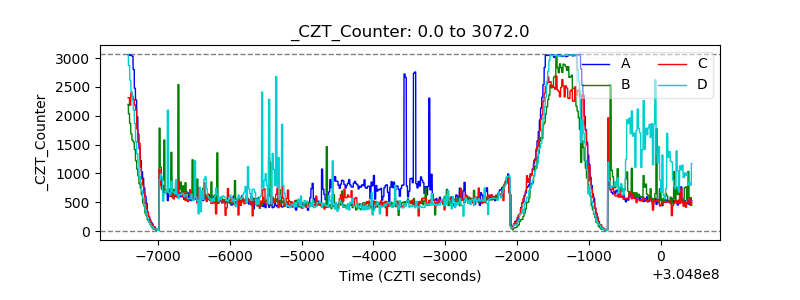 |
| +2.5 Volts monitor |  |
| +5 Volts monitor |  |
| _ROLL_ROT | 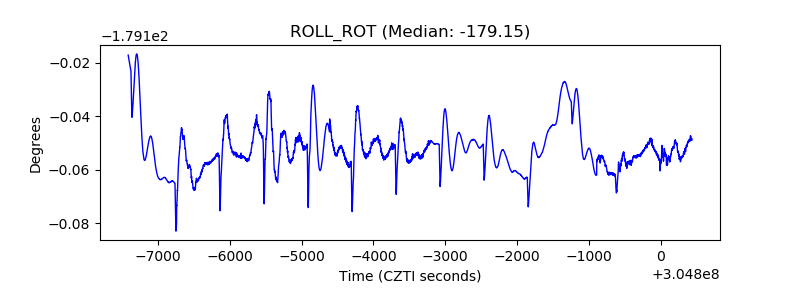 |
| _Roll_DEC | 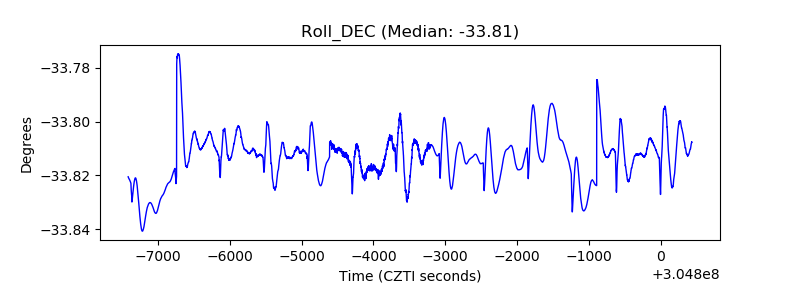 |
| _Roll_RA | 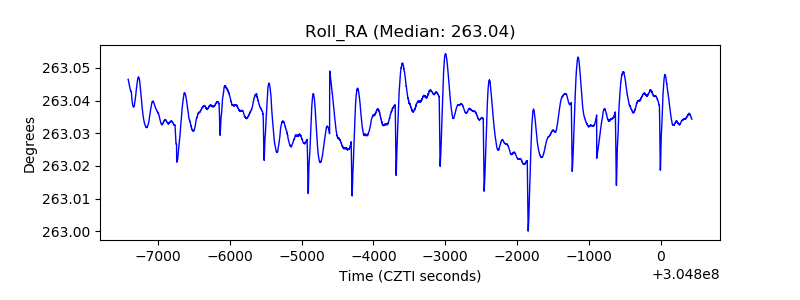 |
| Veto Counter | 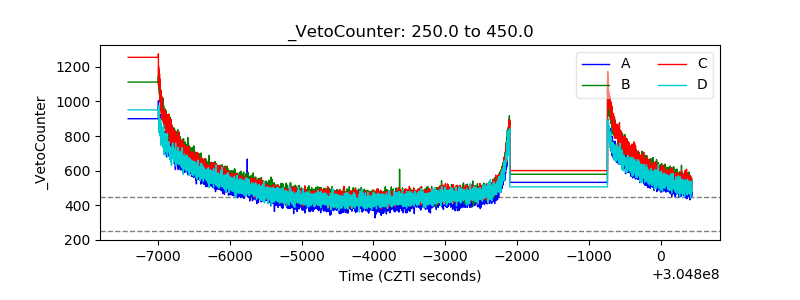 |