| Param | Original file | Final file |
|---|---|---|
| Filename | modeM0/AS1A06_002T01_9000003134_21191cztM0_level2.evt | modeM0/AS1A06_002T01_9000003134_21191cztM0_level2_quad_clean.evt |
| Size (bytes) | 570,176,640 | 95,685,120 |
| Size | 543.8 MB | 91.3 MB |
| Events in quadrant A | 3,168,818 | 637,351 |
| Events in quadrant B | 3,510,307 | 652,584 |
| Events in quadrant C | 3,203,641 | 615,628 |
| Events in quadrant D | 6,965,760 | 559,256 |
| Mode SS | |||
|---|---|---|---|
| Quadrant | BADHDUFLAG | Total packets | Discarded packets |
| A | 0 | 126 | 0 |
| B | 0 | 126 | 0 |
| C | 0 | 126 | 0 |
| D | 0 | 126 | 0 |
| Mode M0 | |||
|---|---|---|---|
| Quadrant | BADHDUFLAG | Total packets | Discarded packets |
| A | 0 | 13272 | 2 |
| B | 0 | 14387 | 2 |
| C | 0 | 13299 | 2 |
| D | 0 | 25167 | 5 |
| Mode M9 | |||
|---|---|---|---|
| Quadrant | BADHDUFLAG | Total packets | Discarded packets |
| A | 0 | 19 | 0 |
| B | 0 | 20 | 0 |
| C | 0 | 20 | 0 |
| D | 0 | 20 | 0 |
| Quadrant | Total seconds | Saturated seconds | Saturation percentage |
|---|---|---|---|
| A | 6201 | 58 | 0.935333% |
| B | 6201 | 101 | 1.628770% |
| C | 6201 | 116 | 1.870666% |
| D | 6200 | 482 | 7.774194% |
Noise dominated data is calculated using 1-second bins in cleaned event files. If a bin has >2000 counts, and if more than 50% of those come from <1% of pixels, then it is considered to be noise-dominated and hence unusable.
| Quadrant | # 1 sec bins | Bins with >0 counts | Bins with >2000 counts | High rate bins dominated by noise | Noise dominated (total time) | Noise dominated (detector-on time) | Marked lightcurve |
|---|---|---|---|---|---|---|---|
| A | 7586 | 6202 | 0 | 0 | 0.00% | 0.00% |  |
| B | 7586 | 6202 | 13 | 13 | 0.17% | 0.21% | 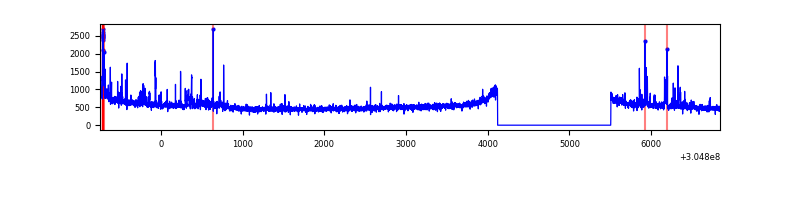 |
| C | 7586 | 6202 | 4 | 4 | 0.05% | 0.06% | 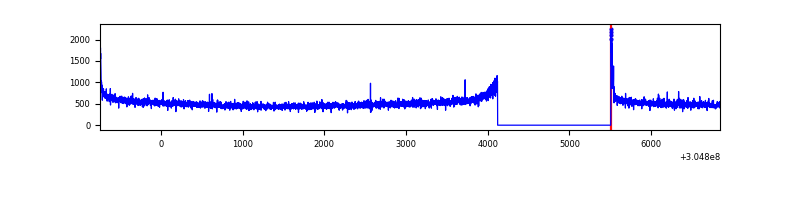 |
| D | 7585 | 6200 | 350 | 350 | 4.61% | 5.65% | 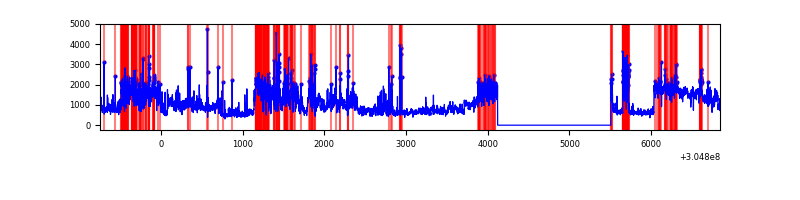 |
Top three noisy pixels from each quadrant. If the there are fewer than three noisy pixels in the level2.evt file, extra rows are filled as -1
| Pixel properties | Quadrant properties | ||||||
|---|---|---|---|---|---|---|---|
| Quadrant | DetID | PixID | Counts | Sigma | Mean | Median | Sigma |
| A | 13 | 254 | 10598 | 59.65 | 818 | 806 | 164.2 |
| A | 13 | 252 | 7975 | 43.67 | 818 | 806 | 164.2 |
| A | 0 | 226 | 7400 | 40.17 | 818 | 806 | 164.2 |
| B | 0 | 182 | 174518 | 1124.08 | 822 | 802 | 154.5 |
| B | 0 | 219 | 34601 | 218.71 | 822 | 802 | 154.5 |
| B | 3 | 64 | 31117 | 196.16 | 822 | 802 | 154.5 |
| C | 14 | 238 | 122947 | 675.46 | 777 | 783 | 180.9 |
| C | 0 | 10 | 44000 | 238.95 | 777 | 783 | 180.9 |
| C | 3 | 233 | 6564 | 31.96 | 777 | 783 | 180.9 |
| D | 1 | 20 | 2706077 | 14795.17 | 755 | 734 | 182.9 |
| D | 1 | 52 | 806850 | 4408.54 | 755 | 734 | 182.9 |
| D | 12 | 233 | 213558 | 1163.91 | 755 | 734 | 182.9 |
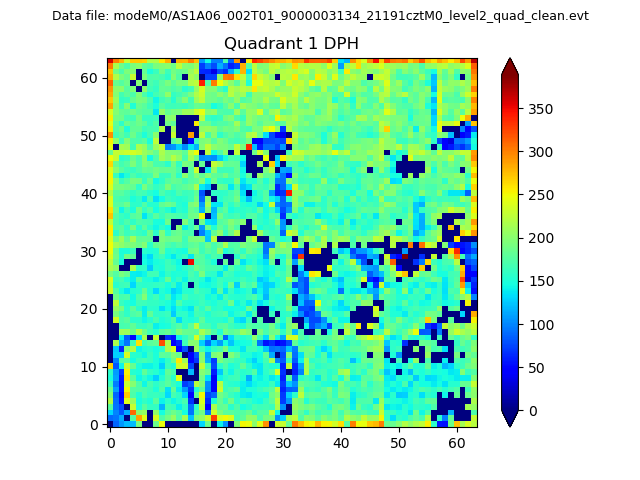
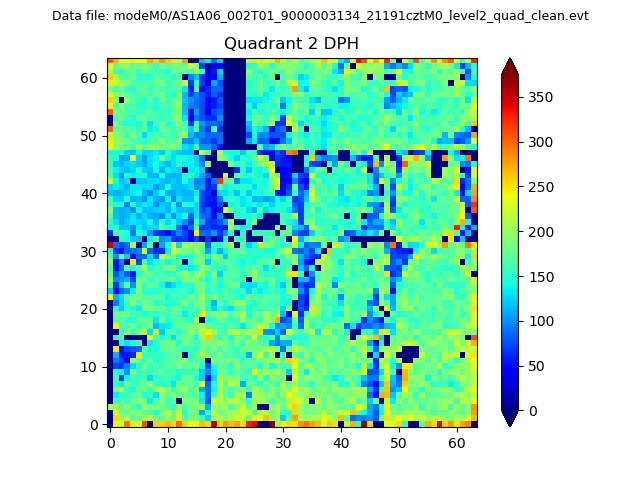
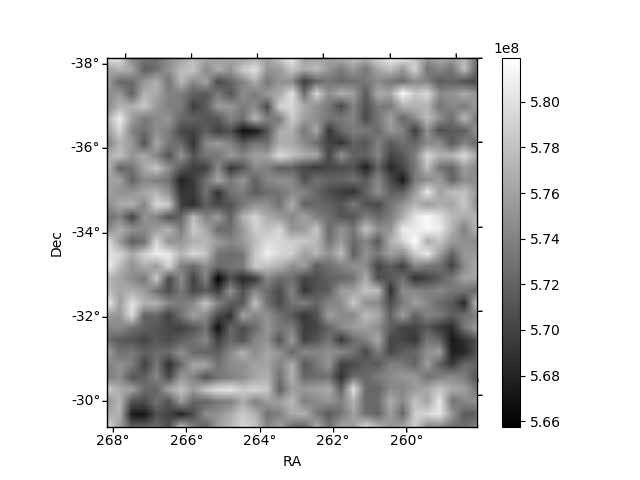
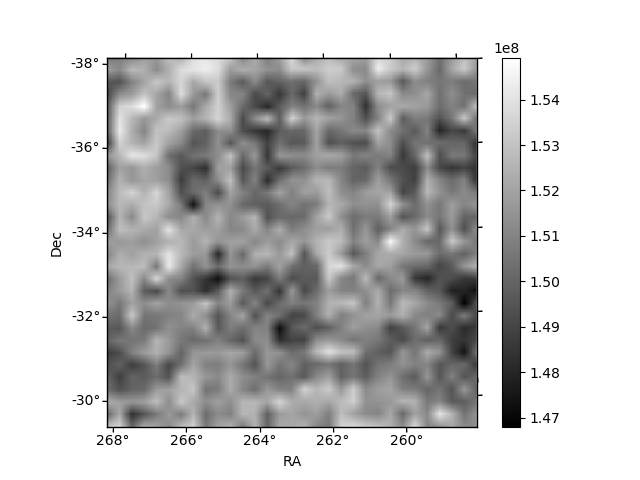
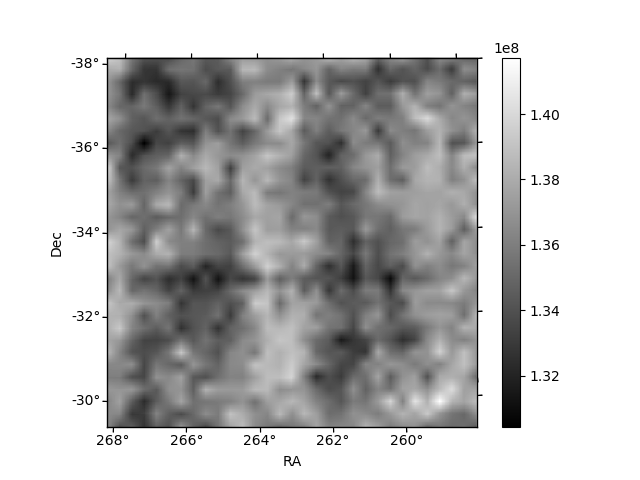
Histogram calculated using DETX and DETY for each event in the final _common_clean file
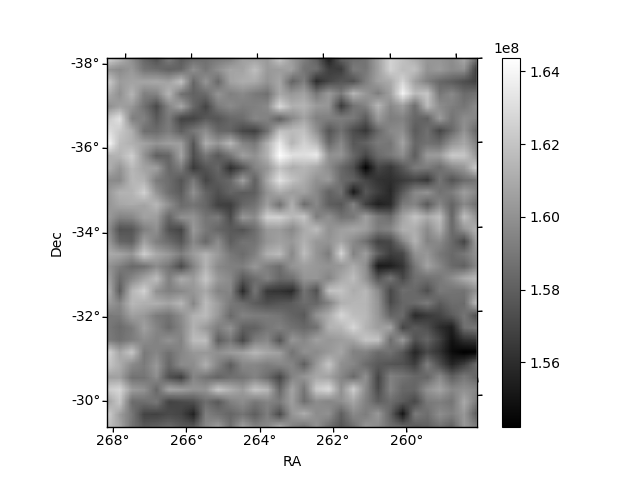
| Quadrant A | 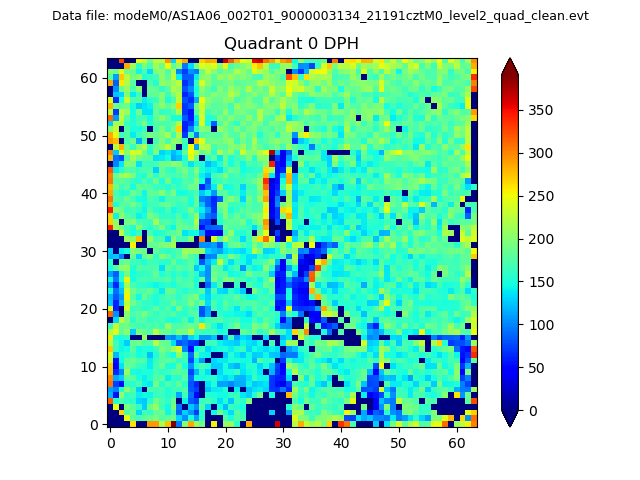 |
 |
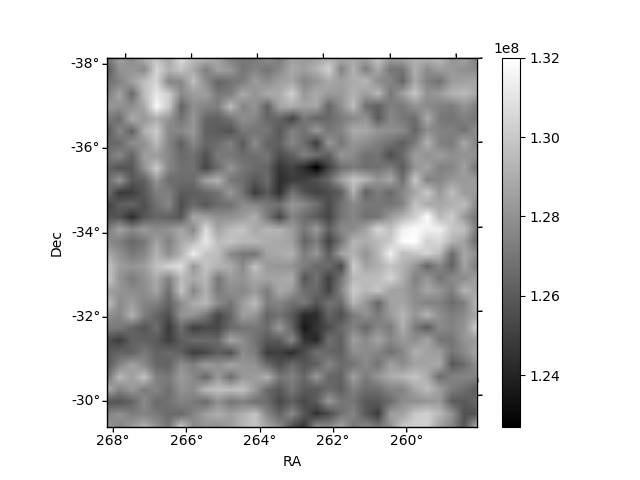
Quadrant B |
|---|---|---|---|
| Quadrant D | 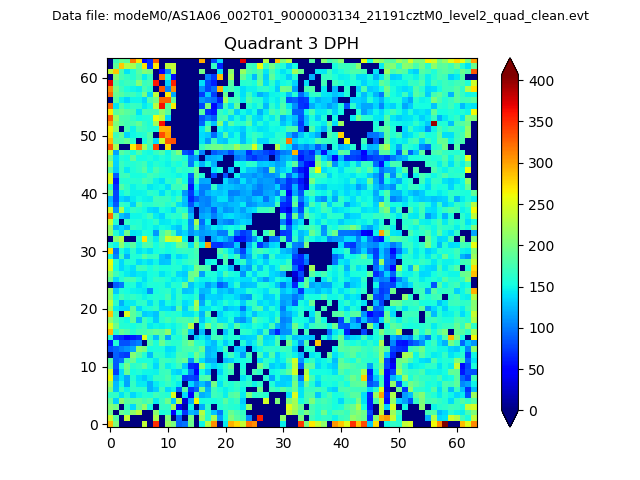 |
 |
Quadrant C |
| Plot type | Count rate plots | Images |
|---|---|---|
| Comparison with Poisson distribution Blue bars denote a histogram of data divided into 1 sec bins. Red curve is a Poisson curve with rate = median count rate of data. |
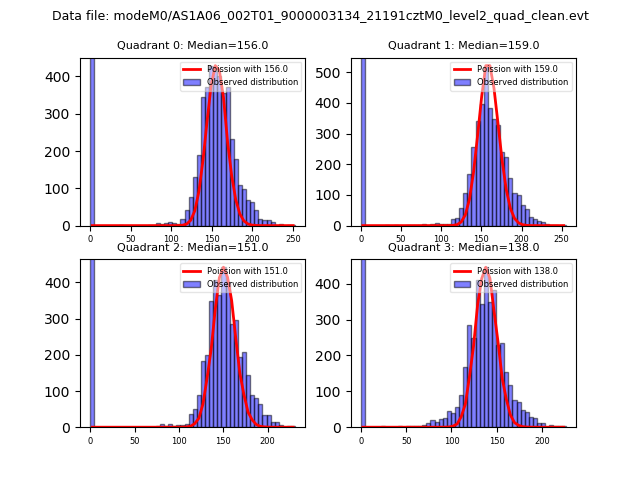 |
 |
| Quadrant-wise count rates Data is divided into 100 sec bins |
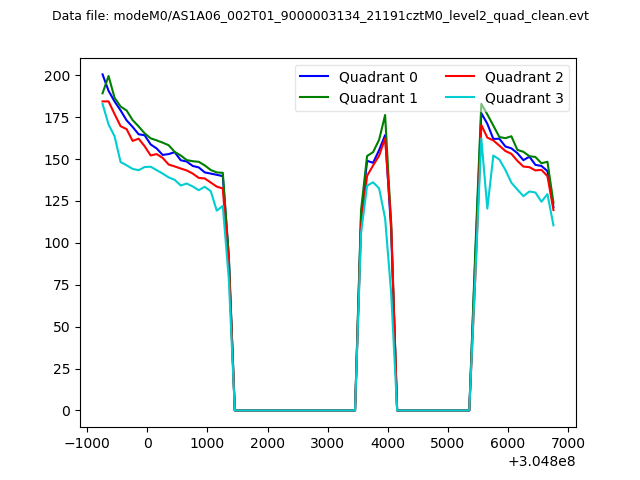 |
|
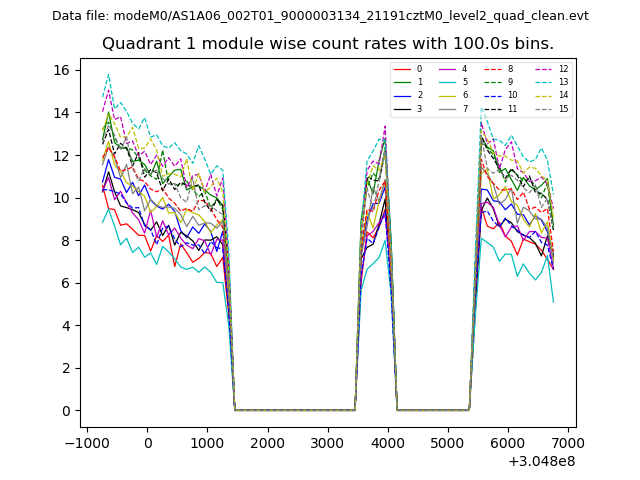
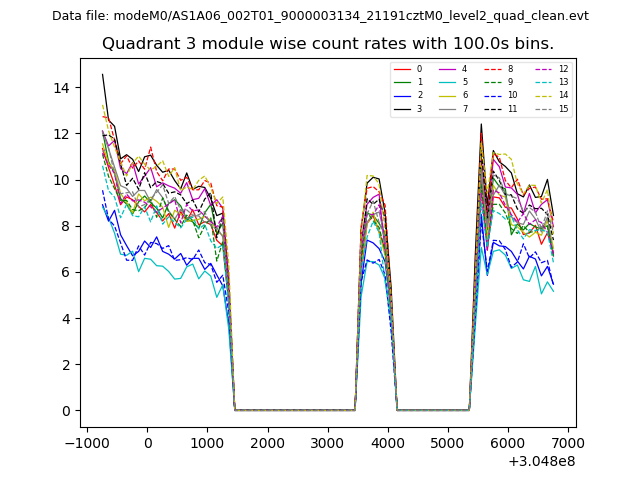
| Module-wise count rates for Quadrant A Data is divided into 100 sec bins |
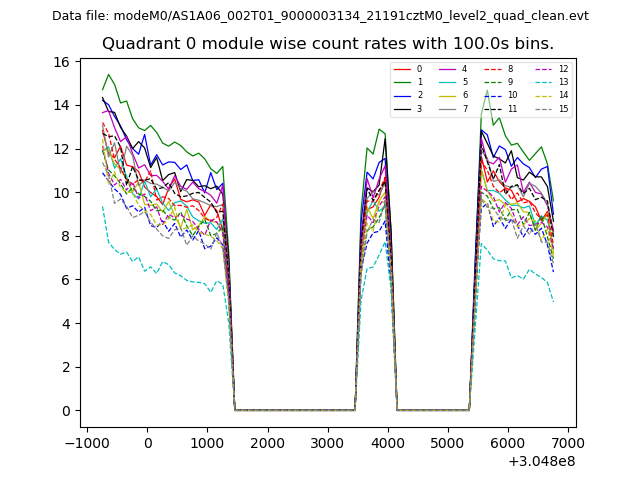 |
 |
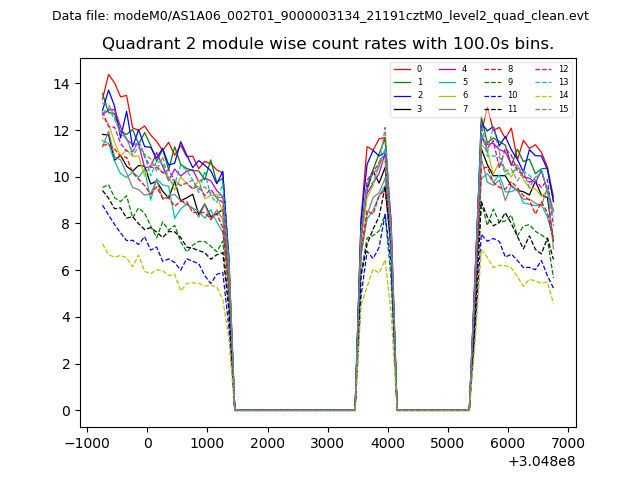
| Module-wise count rates for Quadrant B Data is divided into 100 sec bins |
 |
 |
| Module-wise count rates for Quadrant C Data is divided into 100 sec bins |
 |
 |
| Module-wise count rates for Quadrant D Data is divided into 100 sec bins |
 |
 |
| Parameter | Plot |
|---|---|
| CZT HV Monitor | 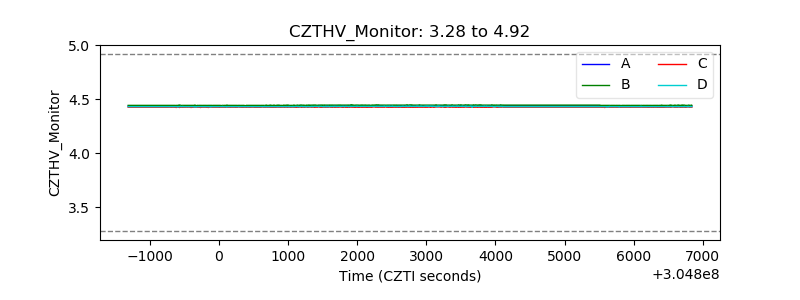 |
| D_VDD | 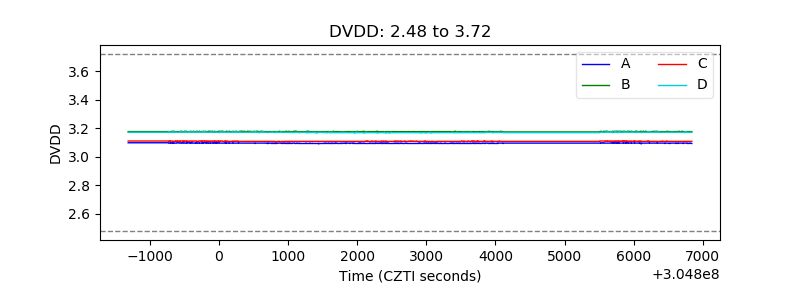 |
| Temperature 1 | 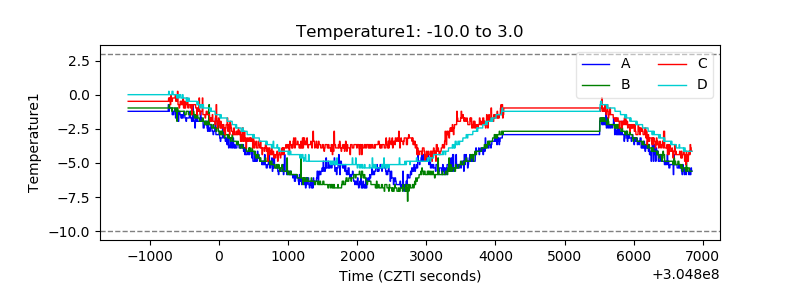 |
| Veto HV Monitor | 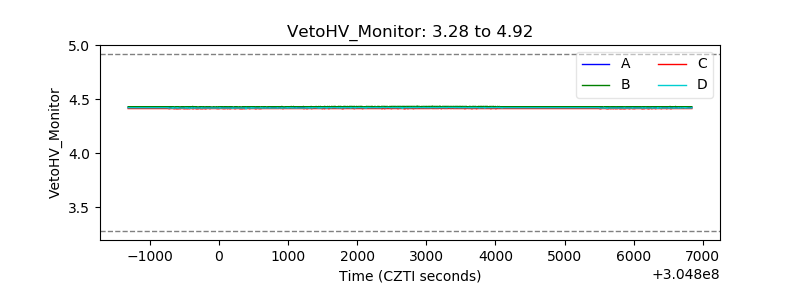 |
| Veto LLD | 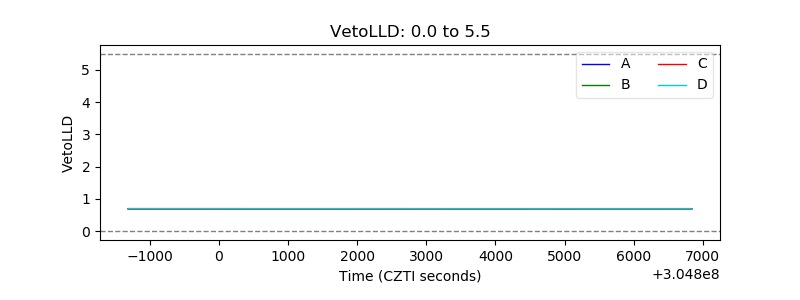 |
| Alpha Counter | 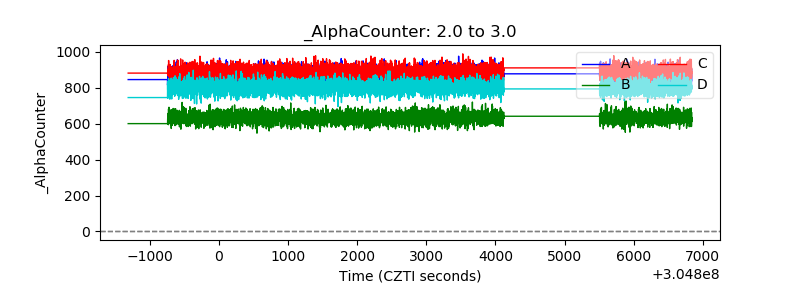 |
| _CPM_Rate | 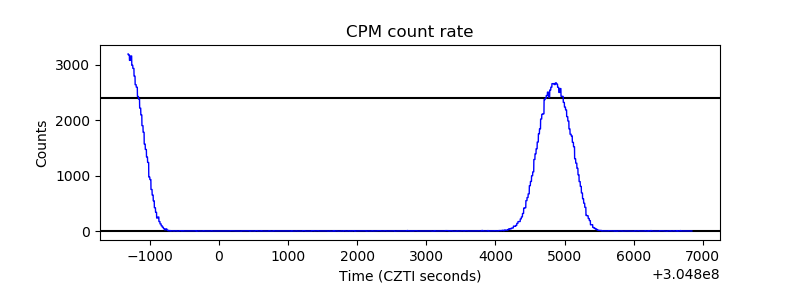 |
| CZT Counter | 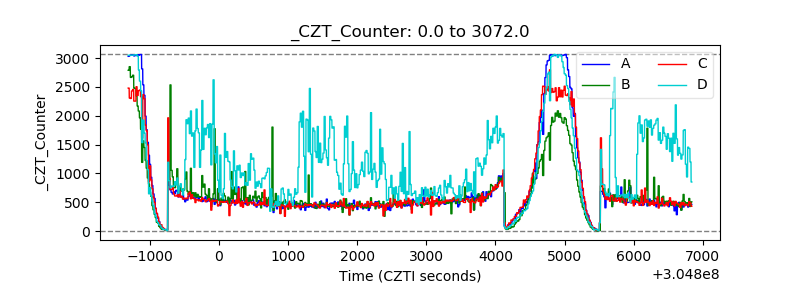 |
| +2.5 Volts monitor |  |
| +5 Volts monitor |  |
| _ROLL_ROT | 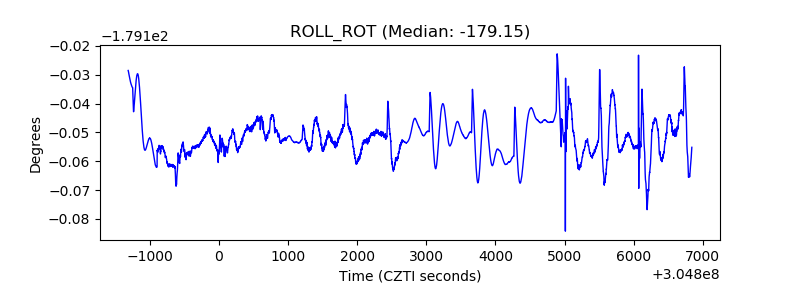 |
| _Roll_DEC | 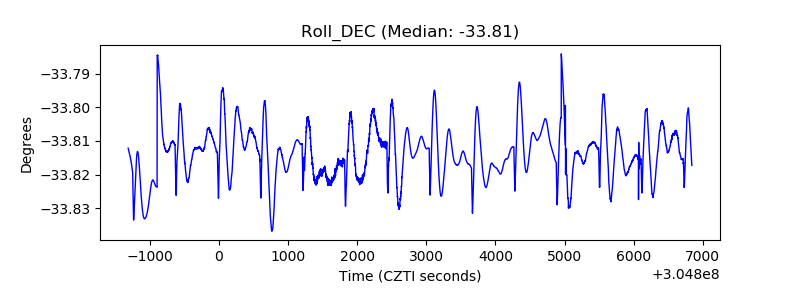 |
| _Roll_RA | 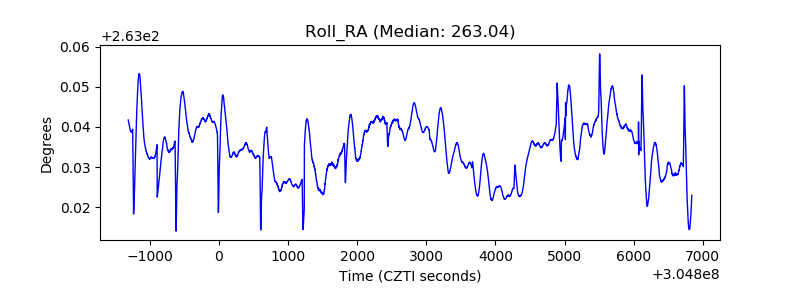 |
| Veto Counter | 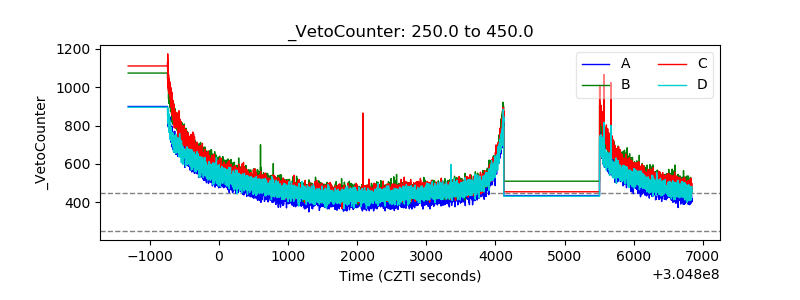 |