| Param | Original file | Final file |
|---|---|---|
| Filename | modeM0/AS1A06_002T01_9000003134_21192cztM0_level2.evt | modeM0/AS1A06_002T01_9000003134_21192cztM0_level2_quad_clean.evt |
| Size (bytes) | 483,399,360 | 92,347,200 |
| Size | 461.0 MB | 88.1 MB |
| Events in quadrant A | 3,105,112 | 604,369 |
| Events in quadrant B | 3,268,249 | 620,110 |
| Events in quadrant C | 3,168,755 | 586,036 |
| Events in quadrant D | 4,673,790 | 549,913 |
| Mode SS | |||
|---|---|---|---|
| Quadrant | BADHDUFLAG | Total packets | Discarded packets |
| A | 0 | 128 | 0 |
| B | 0 | 128 | 0 |
| C | 0 | 128 | 0 |
| D | 0 | 128 | 0 |
| Mode M0 | |||
|---|---|---|---|
| Quadrant | BADHDUFLAG | Total packets | Discarded packets |
| A | 0 | 13241 | 2 |
| B | 0 | 13643 | 2 |
| C | 0 | 13217 | 2 |
| D | 0 | 18107 | 3 |
| Mode M9 | |||
|---|---|---|---|
| Quadrant | BADHDUFLAG | Total packets | Discarded packets |
| A | 0 | 22 | 0 |
| B | 0 | 23 | 0 |
| C | 0 | 23 | 0 |
| D | 0 | 23 | 0 |
| Quadrant | Total seconds | Saturated seconds | Saturation percentage |
|---|---|---|---|
| A | 6244 | 19 | 0.304292% |
| B | 6244 | 36 | 0.576553% |
| C | 6244 | 84 | 1.345291% |
| D | 6243 | 145 | 2.322601% |
Noise dominated data is calculated using 1-second bins in cleaned event files. If a bin has >2000 counts, and if more than 50% of those come from <1% of pixels, then it is considered to be noise-dominated and hence unusable.
| Quadrant | # 1 sec bins | Bins with >0 counts | Bins with >2000 counts | High rate bins dominated by noise | Noise dominated (total time) | Noise dominated (detector-on time) | Marked lightcurve |
|---|---|---|---|---|---|---|---|
| A | 7584 | 6245 | 0 | 0 | 0.00% | 0.00% | 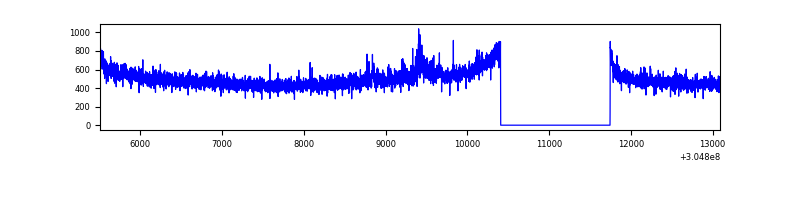 |
| B | 7584 | 6245 | 7 | 7 | 0.09% | 0.11% |  |
| C | 7584 | 6245 | 6 | 6 | 0.08% | 0.10% | 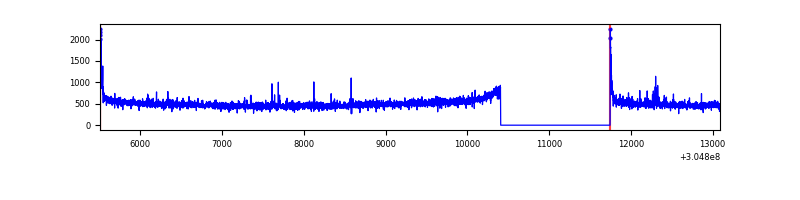 |
| D | 7583 | 6244 | 131 | 131 | 1.73% | 2.10% | 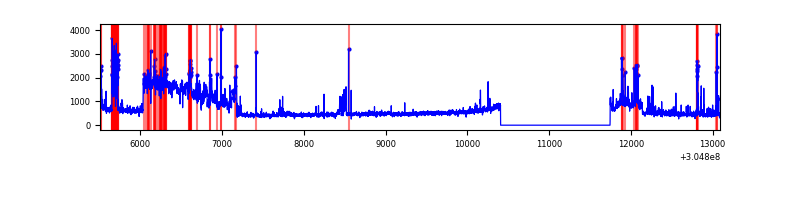 |
Top three noisy pixels from each quadrant. If the there are fewer than three noisy pixels in the level2.evt file, extra rows are filled as -1
| Pixel properties | Quadrant properties | ||||||
|---|---|---|---|---|---|---|---|
| Quadrant | DetID | PixID | Counts | Sigma | Mean | Median | Sigma |
| A | 13 | 252 | 50280 | 310.27 | 792 | 779 | 159.5 |
| A | 13 | 254 | 9828 | 56.72 | 792 | 779 | 159.5 |
| A | 0 | 226 | 6971 | 38.81 | 792 | 779 | 159.5 |
| B | 0 | 182 | 65967 | 433.35 | 797 | 780 | 150.4 |
| B | 3 | 64 | 21494 | 137.7 | 797 | 780 | 150.4 |
| B | 0 | 190 | 18291 | 116.41 | 797 | 780 | 150.4 |
| C | 14 | 238 | 121891 | 683.13 | 756 | 763 | 177.3 |
| C | 0 | 10 | 49677 | 275.86 | 756 | 763 | 177.3 |
| C | 3 | 233 | 42593 | 235.91 | 756 | 763 | 177.3 |
| D | 1 | 20 | 1270679 | 6966.58 | 750 | 729 | 182.3 |
| D | 12 | 233 | 196428 | 1073.55 | 750 | 729 | 182.3 |
| D | 7 | 238 | 122278 | 666.78 | 750 | 729 | 182.3 |
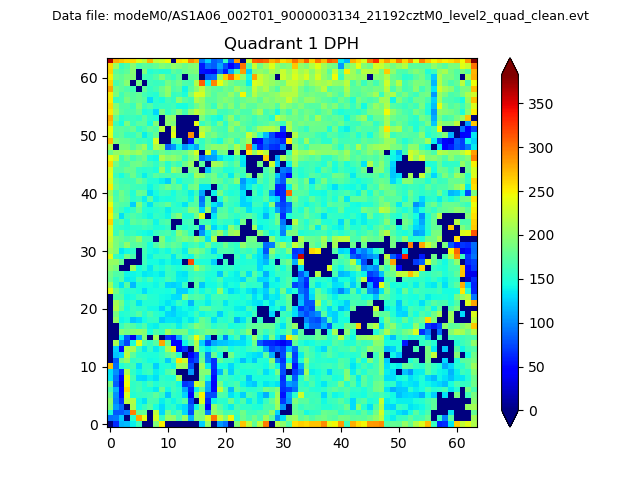
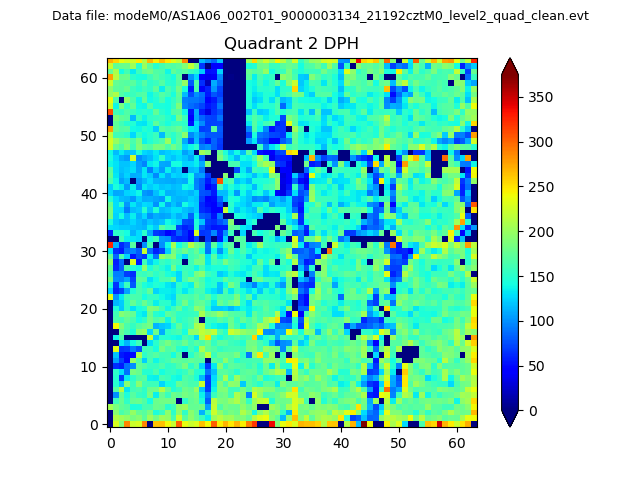
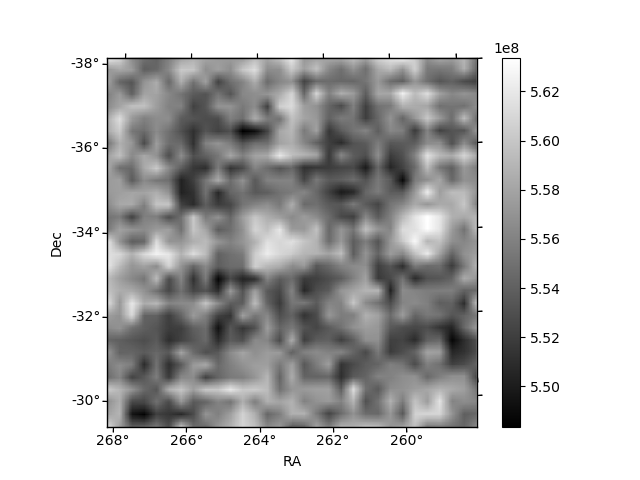
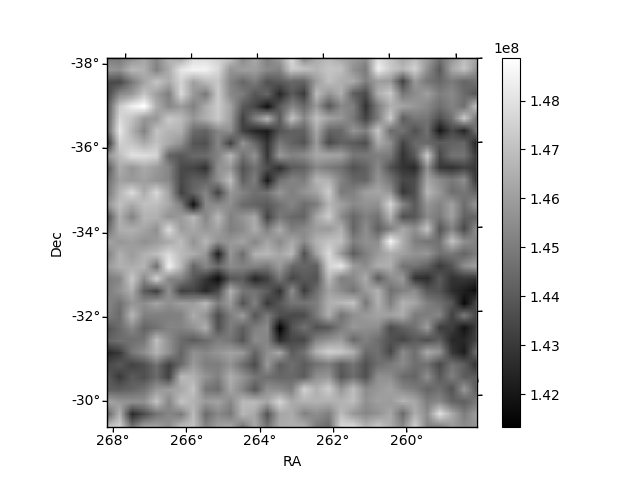
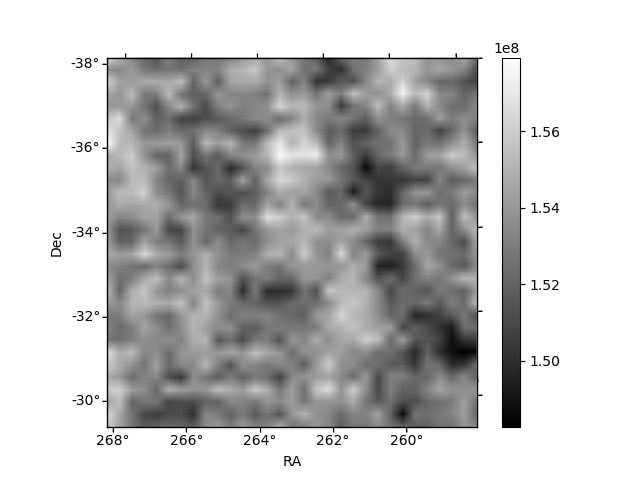
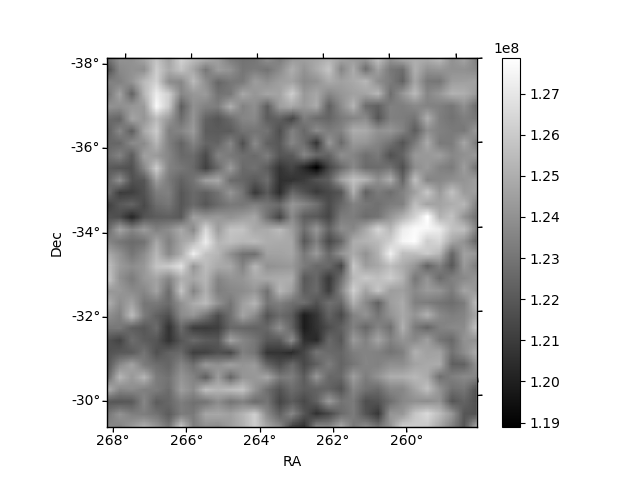
Histogram calculated using DETX and DETY for each event in the final _common_clean file
| Quadrant A | 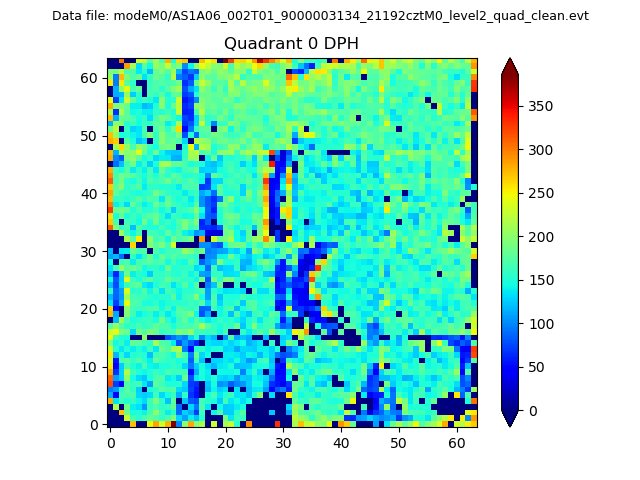 |
 |
Quadrant B |
|---|---|---|---|
| Quadrant D | 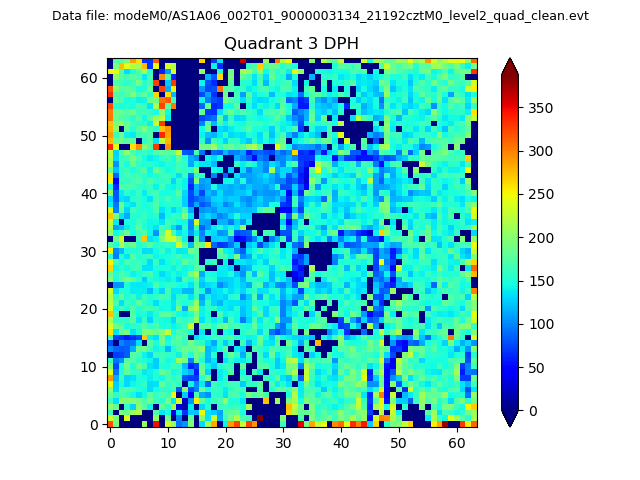 |
 |
Quadrant C |
| Plot type | Count rate plots | Images |
|---|---|---|
| Comparison with Poisson distribution Blue bars denote a histogram of data divided into 1 sec bins. Red curve is a Poisson curve with rate = median count rate of data. |
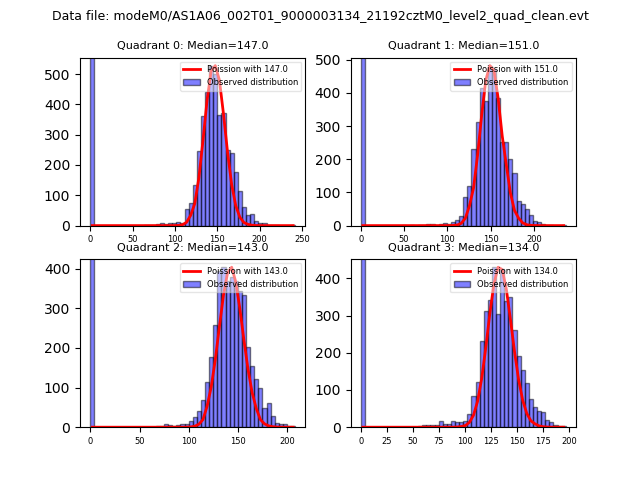 |
 |
| Quadrant-wise count rates Data is divided into 100 sec bins |
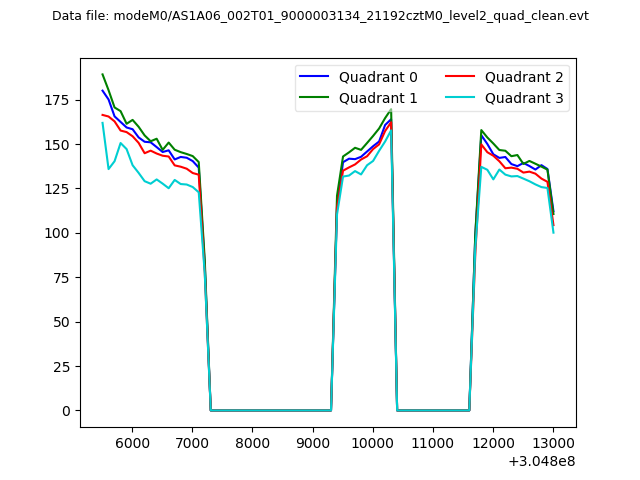 |
|
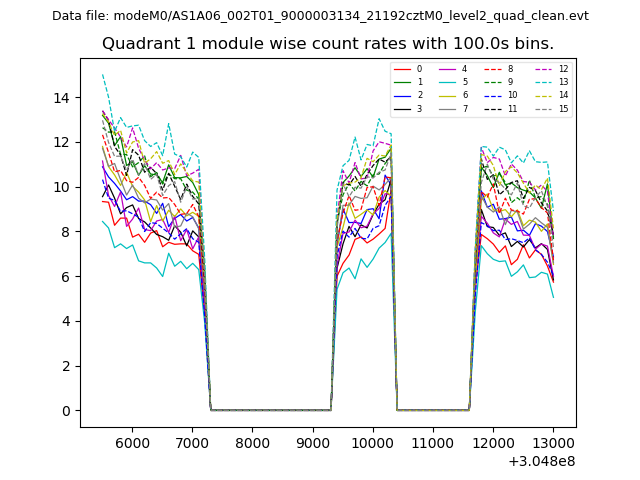
| Module-wise count rates for Quadrant A Data is divided into 100 sec bins |
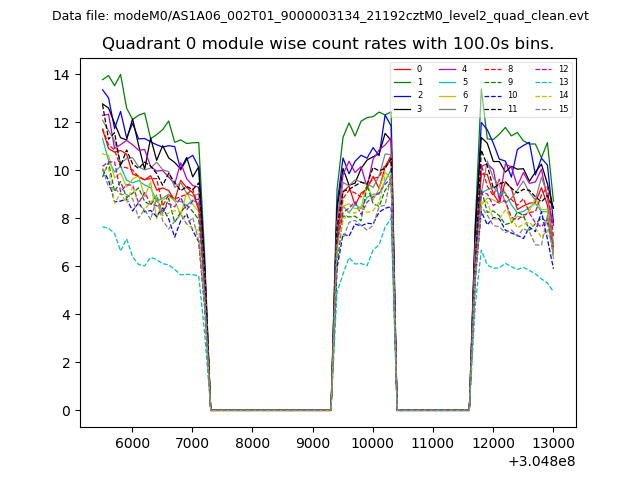 |
 |
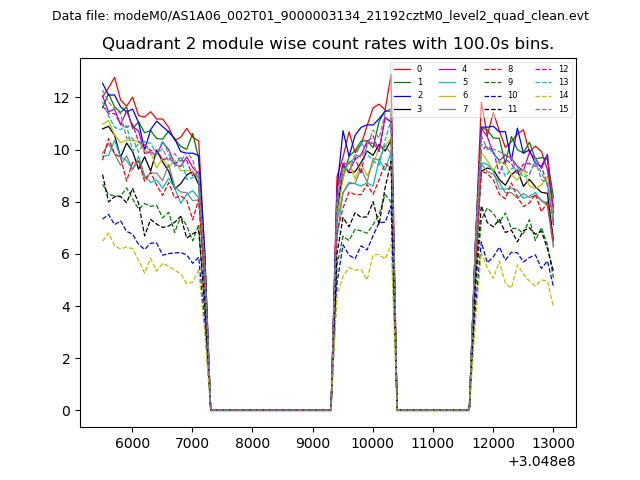
| Module-wise count rates for Quadrant B Data is divided into 100 sec bins |
 |
 |
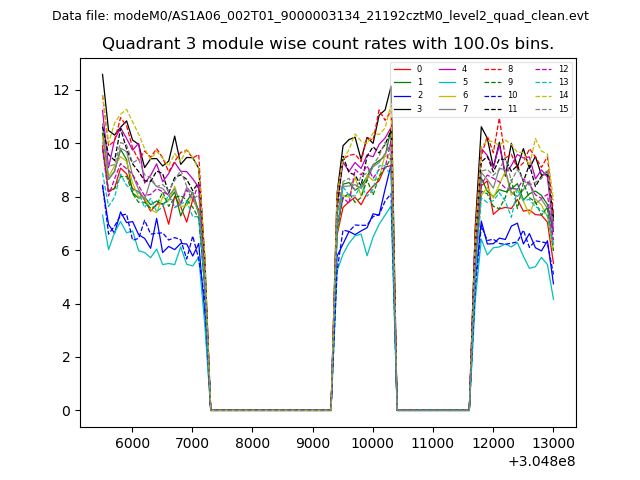
| Module-wise count rates for Quadrant C Data is divided into 100 sec bins |
 |
 |
| Module-wise count rates for Quadrant D Data is divided into 100 sec bins |
 |
 |
| Parameter | Plot |
|---|---|
| CZT HV Monitor | 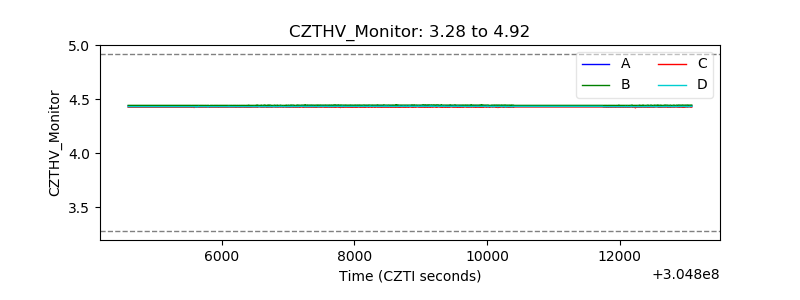 |
| D_VDD | 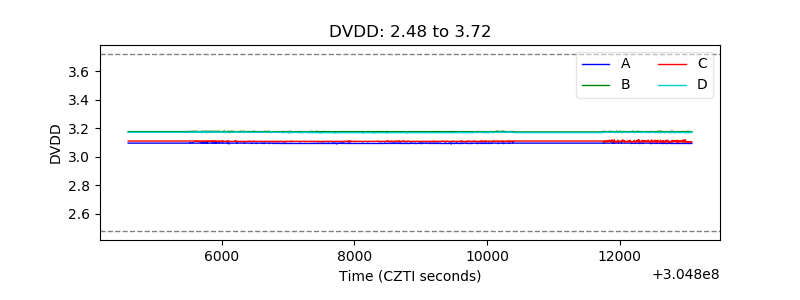 |
| Temperature 1 | 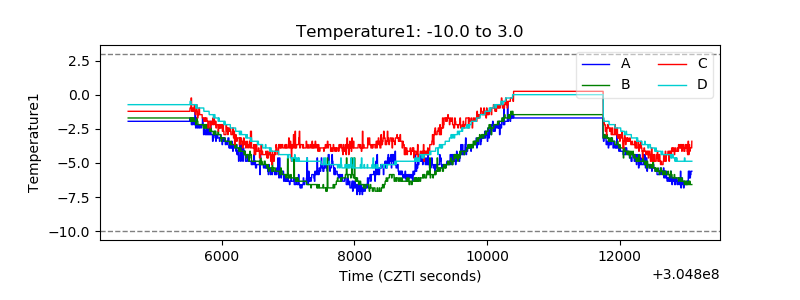 |
| Veto HV Monitor | 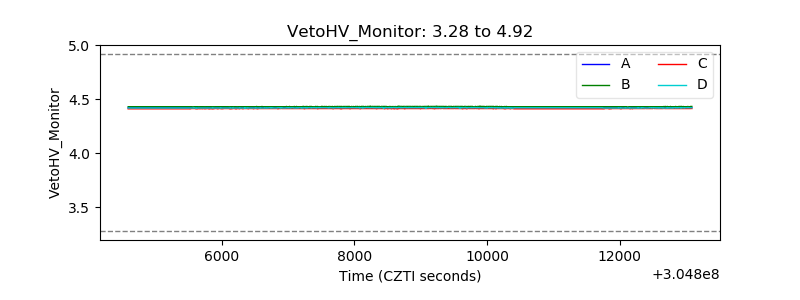 |
| Veto LLD | 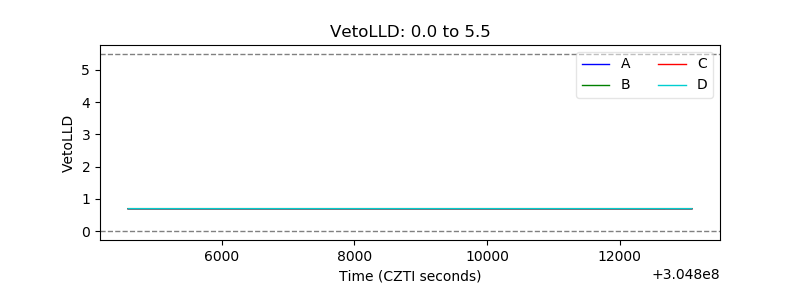 |
| Alpha Counter | 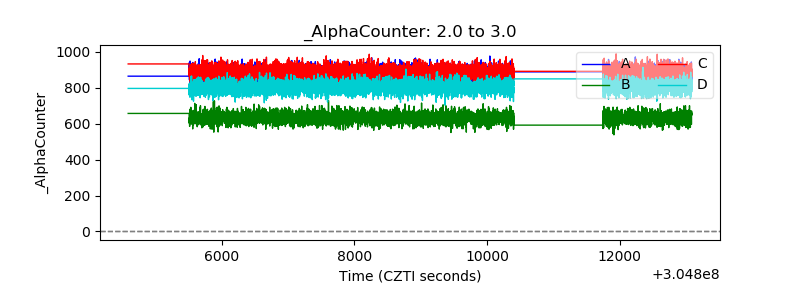 |
| _CPM_Rate | 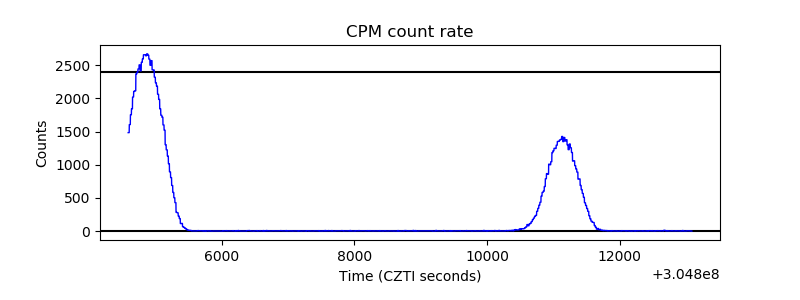 |
| CZT Counter | 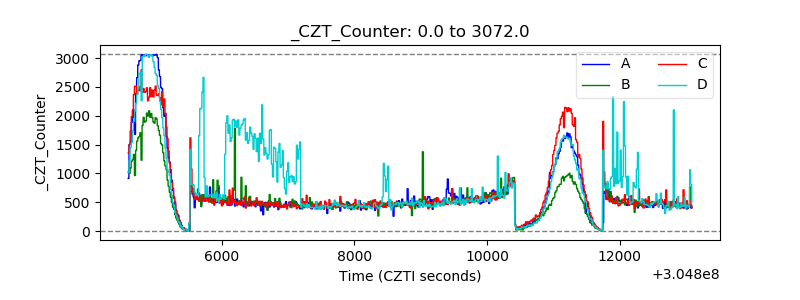 |
| +2.5 Volts monitor |  |
| +5 Volts monitor | 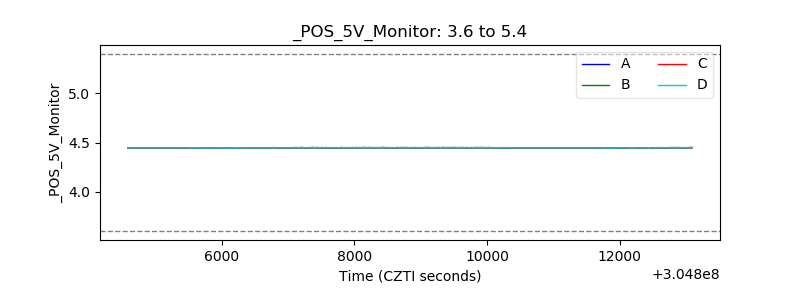 |
| _ROLL_ROT | 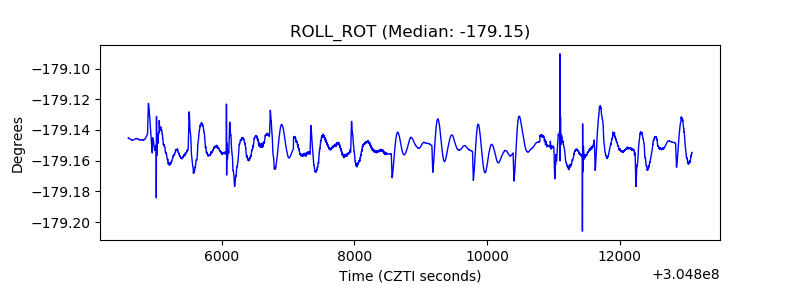 |
| _Roll_DEC | 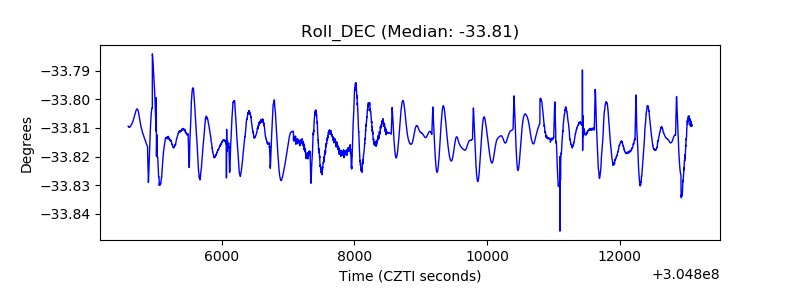 |
| _Roll_RA | 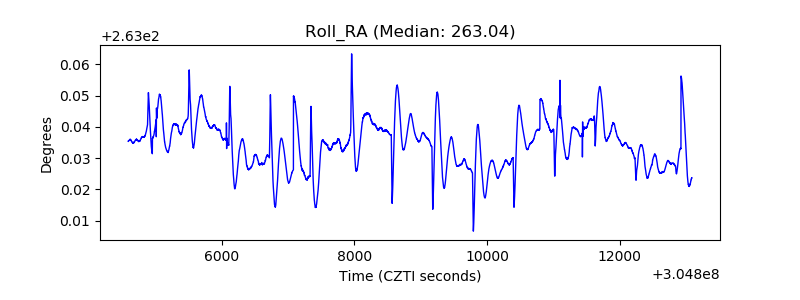 |
| Veto Counter | 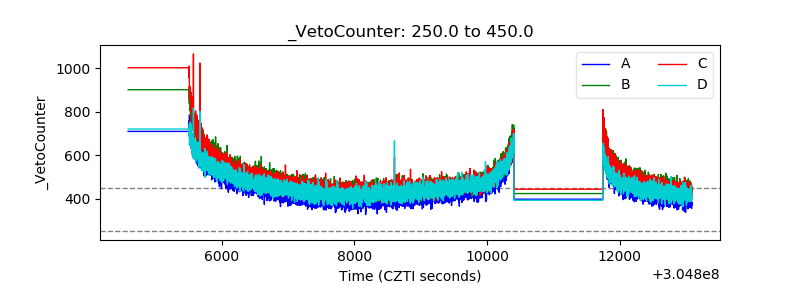 |