| Param | Original file | Final file |
|---|---|---|
| Filename | modeM0/AS1A06_002T01_9000003134_21194cztM0_level2.evt | modeM0/AS1A06_002T01_9000003134_21194cztM0_level2_quad_clean.evt |
| Size (bytes) | 610,583,040 | 97,174,080 |
| Size | 582.3 MB | 92.7 MB |
| Events in quadrant A | 3,680,024 | 630,518 |
| Events in quadrant B | 3,892,617 | 639,064 |
| Events in quadrant C | 3,727,532 | 614,845 |
| Events in quadrant D | 6,669,995 | 523,249 |
| Mode SS | |||
|---|---|---|---|
| Quadrant | BADHDUFLAG | Total packets | Discarded packets |
| A | 0 | 160 | 0 |
| B | 0 | 160 | 0 |
| C | 0 | 160 | 0 |
| D | 0 | 160 | 0 |
| Mode M0 | |||
|---|---|---|---|
| Quadrant | BADHDUFLAG | Total packets | Discarded packets |
| A | 0 | 15870 | 2 |
| B | 0 | 16458 | 2 |
| C | 0 | 16057 | 2 |
| D | 0 | 24996 | 2 |
| Mode M9 | |||
|---|---|---|---|
| Quadrant | BADHDUFLAG | Total packets | Discarded packets |
| A | 0 | 14 | 0 |
| B | 0 | 14 | 0 |
| C | 0 | 14 | 0 |
| D | 0 | 14 | 0 |
| Quadrant | Total seconds | Saturated seconds | Saturation percentage |
|---|---|---|---|
| A | 7680 | 55 | 0.716146% |
| B | 7681 | 91 | 1.184742% |
| C | 7681 | 118 | 1.536258% |
| D | 7681 | 1040 | 13.539904% |
Noise dominated data is calculated using 1-second bins in cleaned event files. If a bin has >2000 counts, and if more than 50% of those come from <1% of pixels, then it is considered to be noise-dominated and hence unusable.
| Quadrant | # 1 sec bins | Bins with >0 counts | Bins with >2000 counts | High rate bins dominated by noise | Noise dominated (total time) | Noise dominated (detector-on time) | Marked lightcurve |
|---|---|---|---|---|---|---|---|
| A | 9240 | 7682 | 0 | 0 | 0.00% | 0.00% | 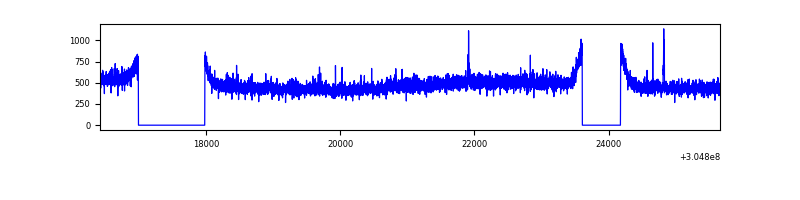 |
| B | 9241 | 7683 | 8 | 8 | 0.09% | 0.10% | 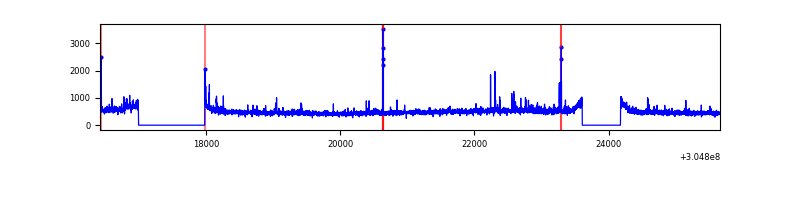 |
| C | 9241 | 7683 | 1 | 1 | 0.01% | 0.01% | 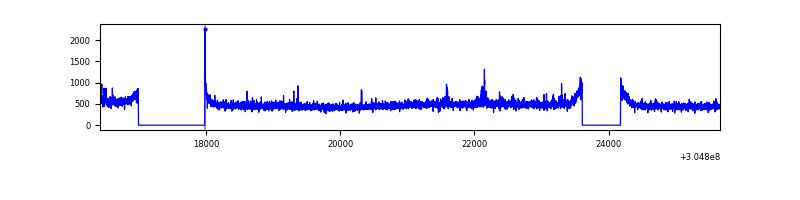 |
| D | 9241 | 7682 | 913 | 913 | 9.88% | 11.88% | 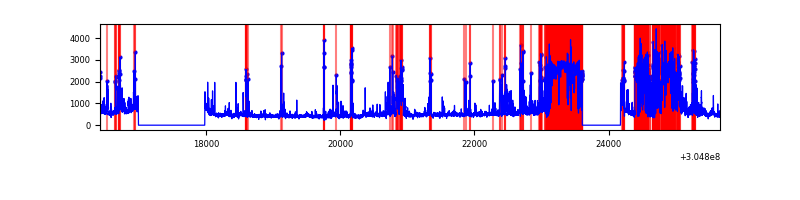 |
Top three noisy pixels from each quadrant. If the there are fewer than three noisy pixels in the level2.evt file, extra rows are filled as -1
| Pixel properties | Quadrant properties | ||||||
|---|---|---|---|---|---|---|---|
| Quadrant | DetID | PixID | Counts | Sigma | Mean | Median | Sigma |
| A | 13 | 252 | 21755 | 109.31 | 940 | 920 | 190.6 |
| A | 5 | 16 | 16173 | 80.02 | 940 | 920 | 190.6 |
| A | 13 | 254 | 11613 | 56.1 | 940 | 920 | 190.6 |
| B | 0 | 190 | 45307 | 245.51 | 942 | 918 | 180.8 |
| B | 3 | 64 | 36534 | 196.99 | 942 | 918 | 180.8 |
| B | 0 | 230 | 26556 | 141.8 | 942 | 918 | 180.8 |
| C | 14 | 238 | 139653 | 654.27 | 898 | 902 | 212.1 |
| C | 3 | 233 | 80173 | 373.79 | 898 | 902 | 212.1 |
| C | 0 | 10 | 8970 | 38.04 | 898 | 902 | 212.1 |
| D | 7 | 238 | 2635074 | 13014.78 | 828 | 802 | 202.4 |
| D | 1 | 52 | 290113 | 1429.36 | 828 | 802 | 202.4 |
| D | 12 | 233 | 177215 | 871.58 | 828 | 802 | 202.4 |
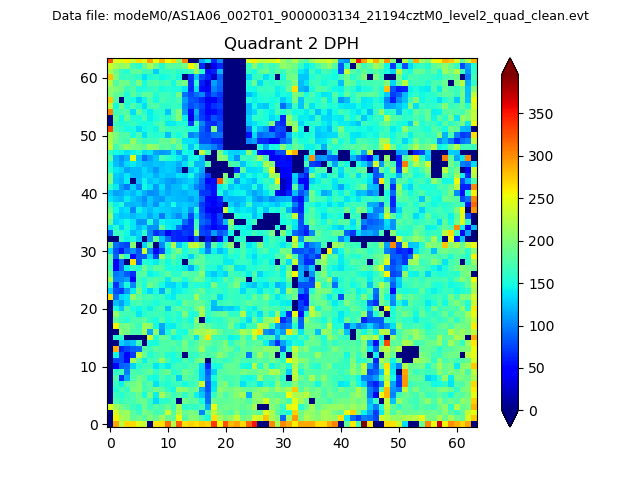
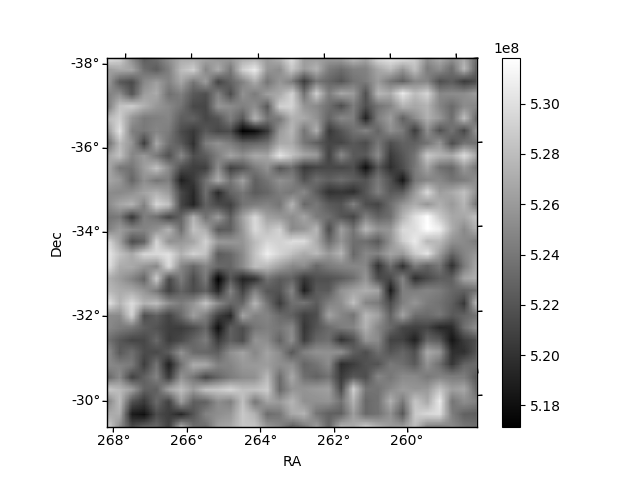
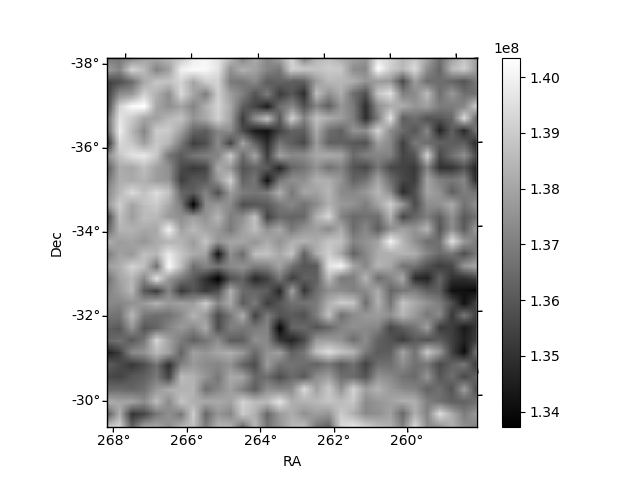
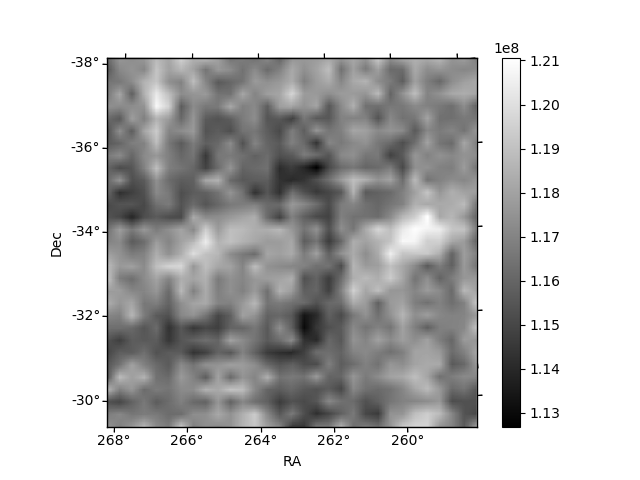
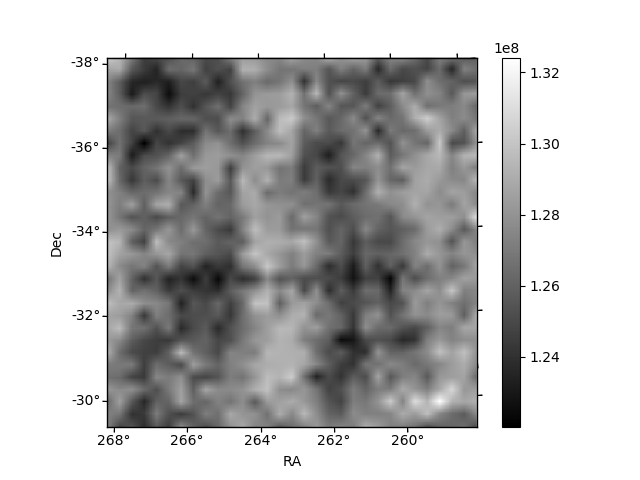
Histogram calculated using DETX and DETY for each event in the final _common_clean file
| Quadrant A | 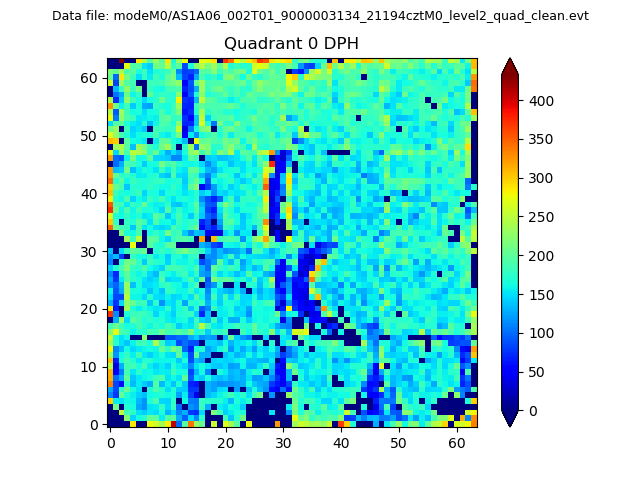 |
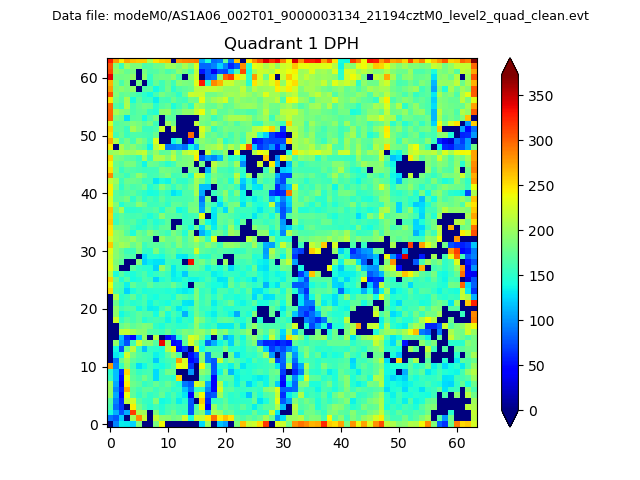 |
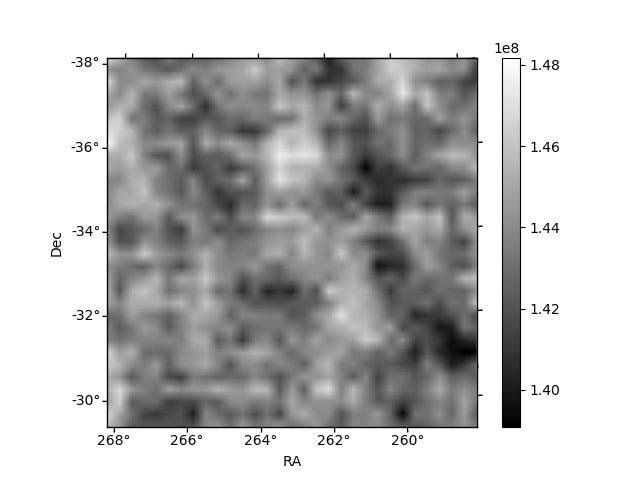
Quadrant B |
|---|---|---|---|
| Quadrant D | 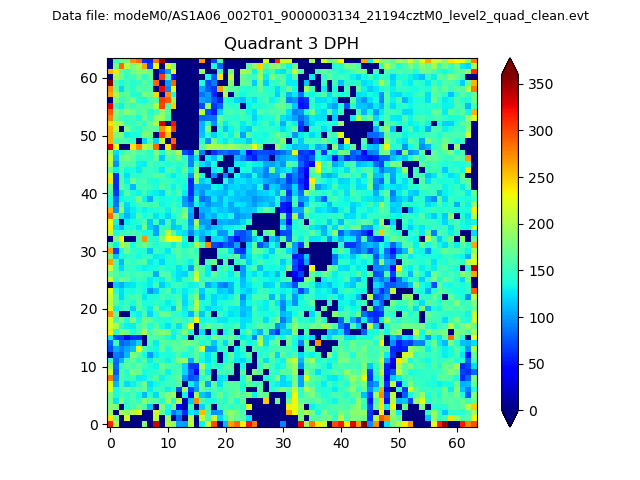 |
 |
Quadrant C |
| Plot type | Count rate plots | Images |
|---|---|---|
| Comparison with Poisson distribution Blue bars denote a histogram of data divided into 1 sec bins. Red curve is a Poisson curve with rate = median count rate of data. |
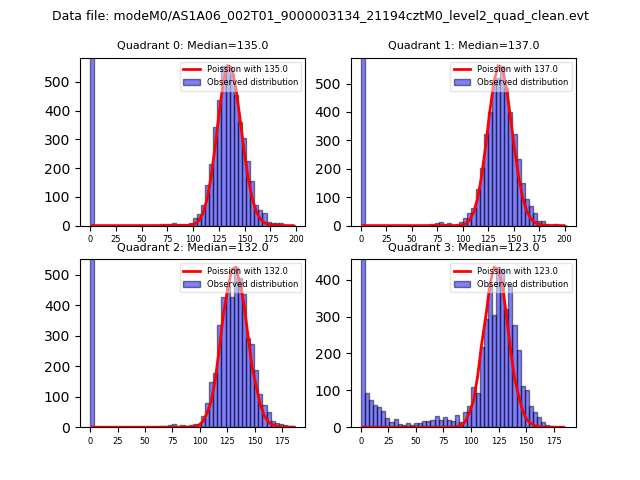 |
 |
| Quadrant-wise count rates Data is divided into 100 sec bins |
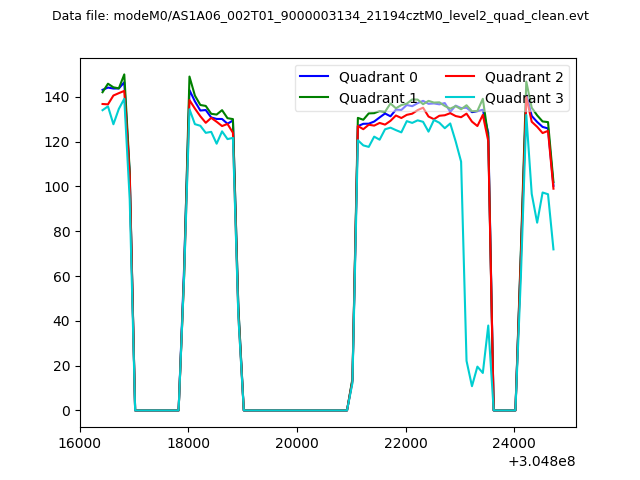 |
|
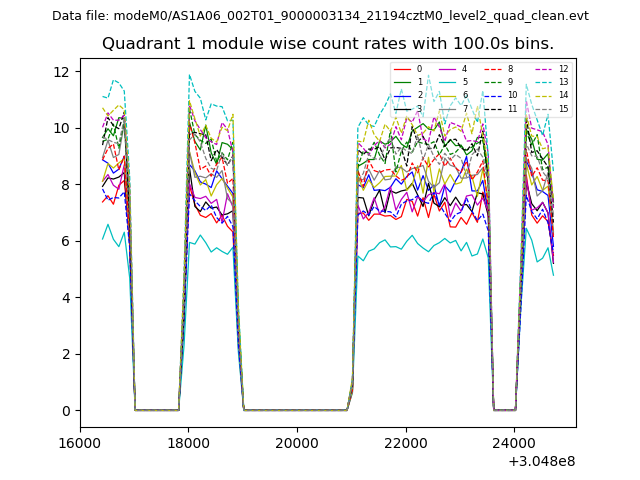
| Module-wise count rates for Quadrant A Data is divided into 100 sec bins |
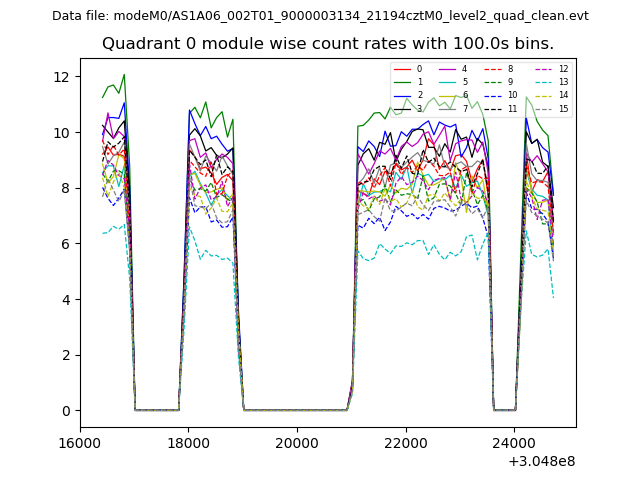 |
 |
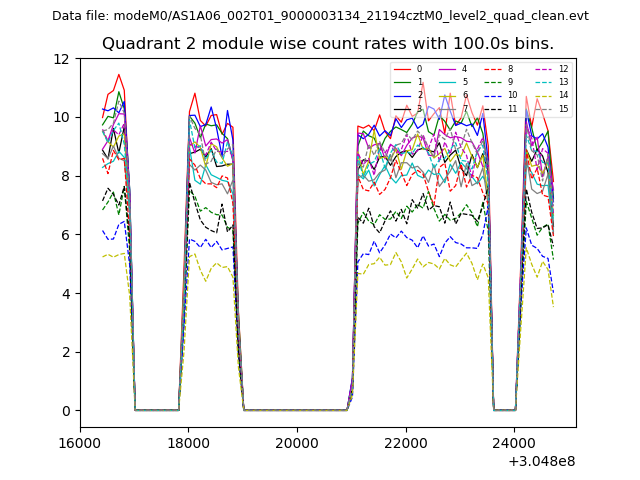
| Module-wise count rates for Quadrant B Data is divided into 100 sec bins |
 |
 |
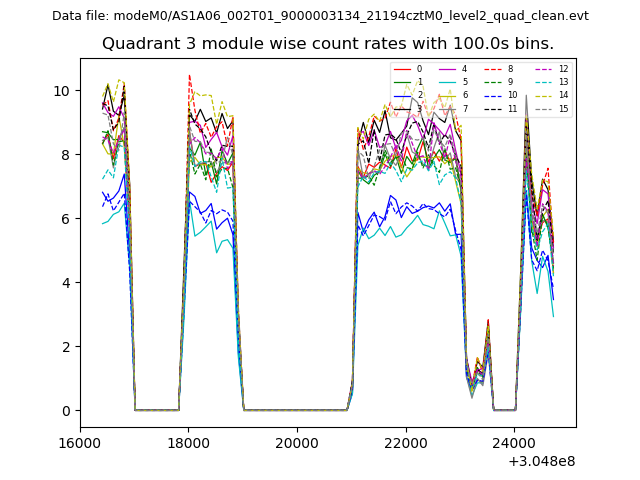
| Module-wise count rates for Quadrant C Data is divided into 100 sec bins |
 |
 |
| Module-wise count rates for Quadrant D Data is divided into 100 sec bins |
 |
 |
| Parameter | Plot |
|---|---|
| CZT HV Monitor | 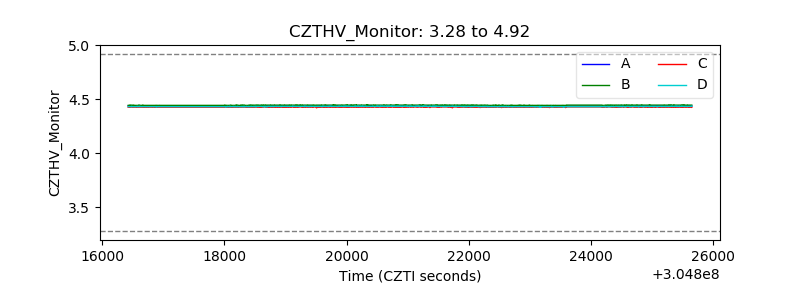 |
| D_VDD | 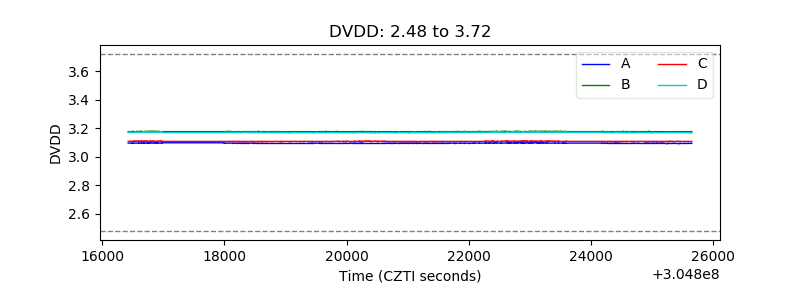 |
| Temperature 1 |  |
| Veto HV Monitor | 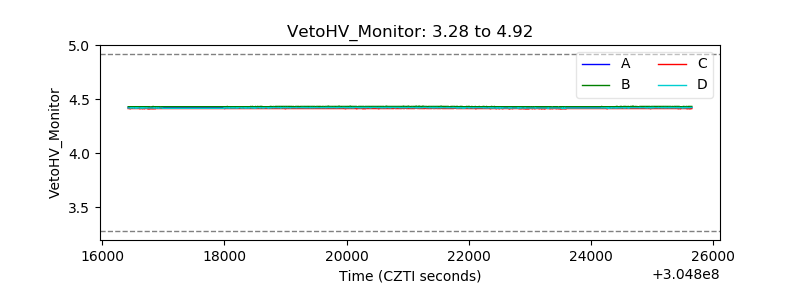 |
| Veto LLD | 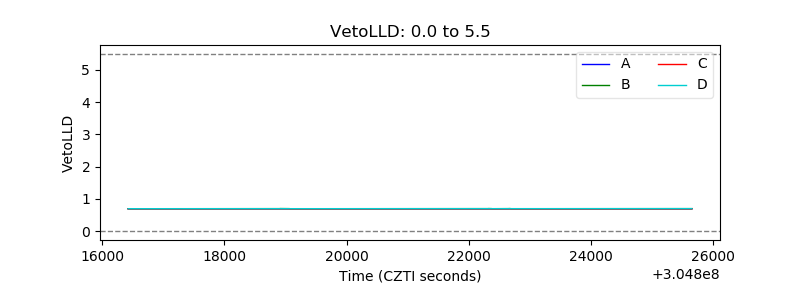 |
| Alpha Counter | 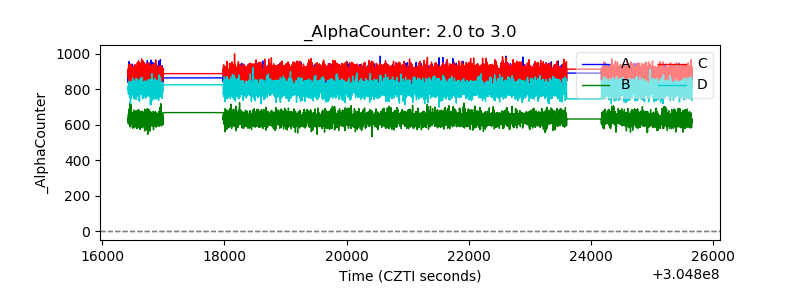 |
| _CPM_Rate | 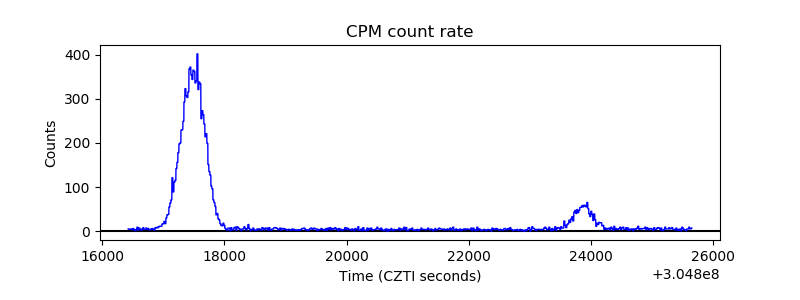 |
| CZT Counter | 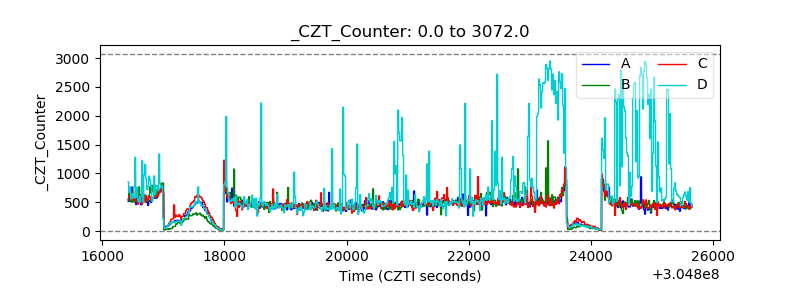 |
| +2.5 Volts monitor | 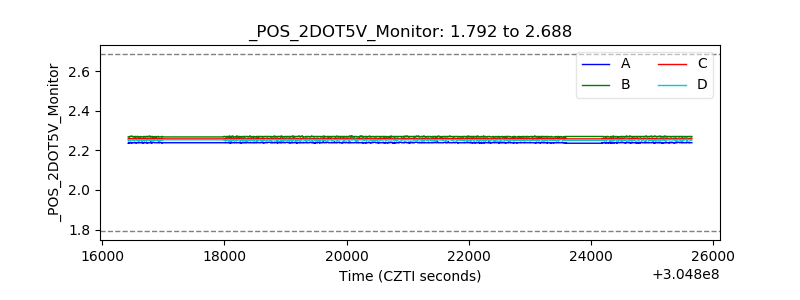 |
| +5 Volts monitor |  |
| _ROLL_ROT | 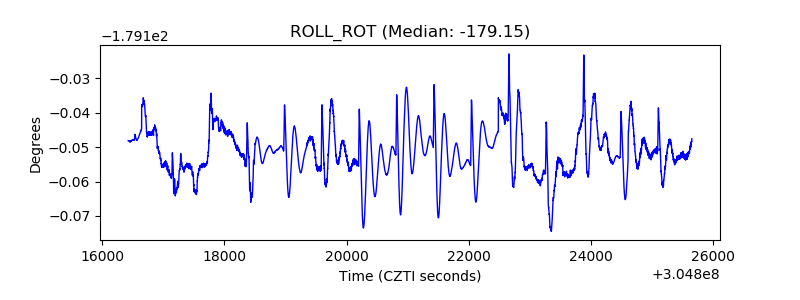 |
| _Roll_DEC | 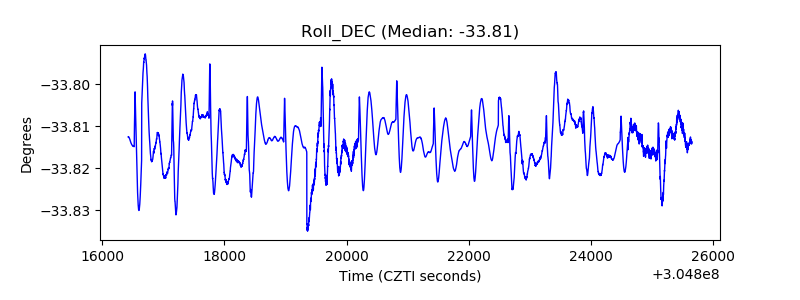 |
| _Roll_RA | 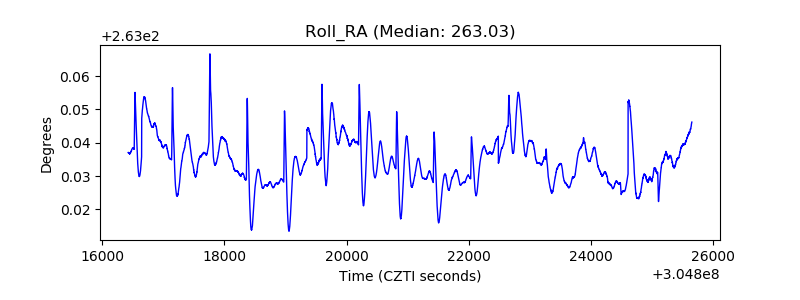 |
| Veto Counter | 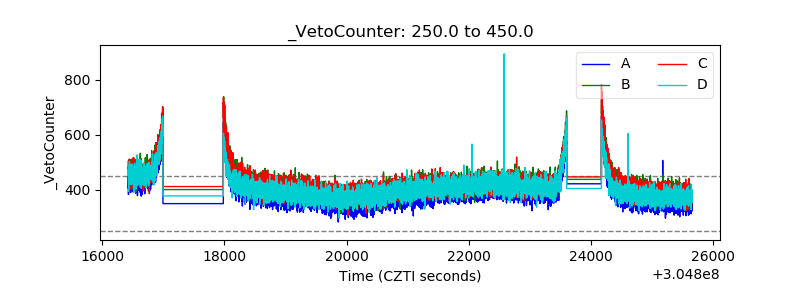 |