| Param | Original file | Final file |
|---|---|---|
| Filename | modeM0/AS1A06_002T01_9000003134_21195cztM0_level2.evt | modeM0/AS1A06_002T01_9000003134_21195cztM0_level2_quad_clean.evt |
| Size (bytes) | 600,540,480 | 87,114,240 |
| Size | 572.7 MB | 83.1 MB |
| Events in quadrant A | 3,865,603 | 539,386 |
| Events in quadrant B | 3,859,303 | 549,146 |
| Events in quadrant C | 3,745,281 | 527,348 |
| Events in quadrant D | 6,197,787 | 488,948 |
| Mode SS | |||
|---|---|---|---|
| Quadrant | BADHDUFLAG | Total packets | Discarded packets |
| A | 0 | 154 | 0 |
| B | 0 | 154 | 0 |
| C | 0 | 154 | 0 |
| D | 0 | 154 | 0 |
| Mode M0 | |||
|---|---|---|---|
| Quadrant | BADHDUFLAG | Total packets | Discarded packets |
| A | 0 | 16503 | 2 |
| B | 0 | 16423 | 2 |
| C | 0 | 16168 | 2 |
| D | 0 | 23571 | 2 |
| Mode M9 | |||
|---|---|---|---|
| Quadrant | BADHDUFLAG | Total packets | Discarded packets |
| A | 0 | 2 | 0 |
| B | 0 | 2 | 0 |
| C | 0 | 2 | 0 |
| D | 0 | 2 | 0 |
| Quadrant | Total seconds | Saturated seconds | Saturation percentage |
|---|---|---|---|
| A | 7663 | 136 | 1.774762% |
| B | 7664 | 189 | 2.466075% |
| C | 7663 | 211 | 2.753491% |
| D | 7663 | 670 | 8.743312% |
Noise dominated data is calculated using 1-second bins in cleaned event files. If a bin has >2000 counts, and if more than 50% of those come from <1% of pixels, then it is considered to be noise-dominated and hence unusable.
| Quadrant | # 1 sec bins | Bins with >0 counts | Bins with >2000 counts | High rate bins dominated by noise | Noise dominated (total time) | Noise dominated (detector-on time) | Marked lightcurve |
|---|---|---|---|---|---|---|---|
| A | 7833 | 7666 | 4 | 4 | 0.05% | 0.05% | 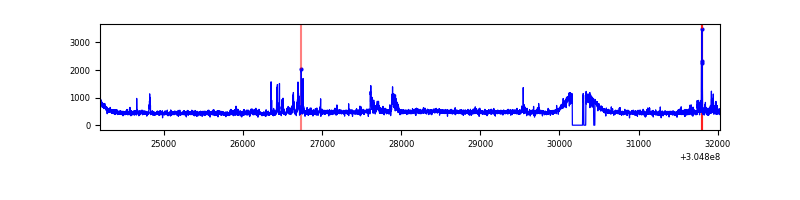 |
| B | 7834 | 7667 | 15 | 15 | 0.19% | 0.20% | 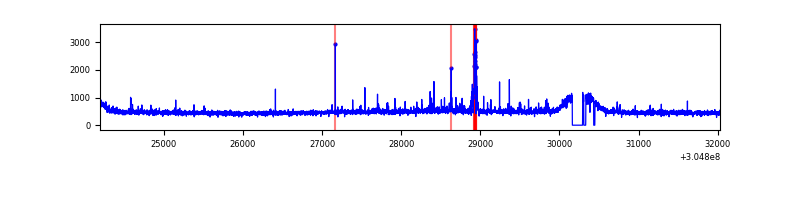 |
| C | 7833 | 7665 | 0 | 0 | 0.00% | 0.00% | 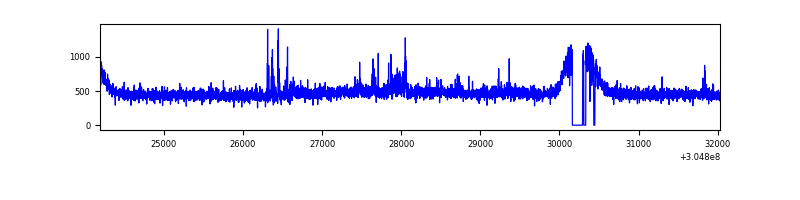 |
| D | 7833 | 7665 | 487 | 487 | 6.22% | 6.35% | 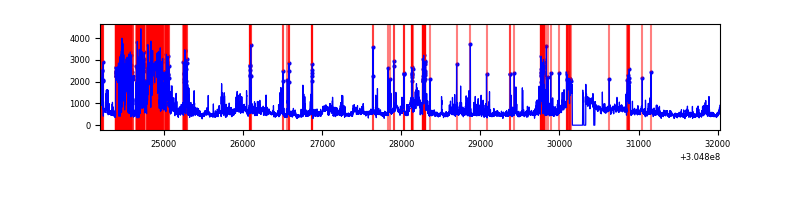 |
Top three noisy pixels from each quadrant. If the there are fewer than three noisy pixels in the level2.evt file, extra rows are filled as -1
| Pixel properties | Quadrant properties | ||||||
|---|---|---|---|---|---|---|---|
| Quadrant | DetID | PixID | Counts | Sigma | Mean | Median | Sigma |
| A | 13 | 252 | 214405 | 1117.31 | 935 | 915 | 191.1 |
| A | 11 | 47 | 37684 | 192.43 | 935 | 915 | 191.1 |
| A | 13 | 254 | 11895 | 57.46 | 935 | 915 | 191.1 |
| B | 3 | 64 | 88800 | 478.82 | 937 | 913 | 183.5 |
| B | 0 | 197 | 26165 | 137.58 | 937 | 913 | 183.5 |
| B | 0 | 190 | 25470 | 133.79 | 937 | 913 | 183.5 |
| C | 14 | 238 | 138797 | 645.04 | 897 | 901 | 213.8 |
| C | 3 | 233 | 105010 | 486.99 | 897 | 901 | 213.8 |
| C | 13 | 61 | 6389 | 25.67 | 897 | 901 | 213.8 |
| D | 7 | 238 | 1300022 | 6132.99 | 870 | 843 | 211.8 |
| D | 1 | 20 | 698691 | 3294.3 | 870 | 843 | 211.8 |
| D | 12 | 235 | 246767 | 1160.92 | 870 | 843 | 211.8 |
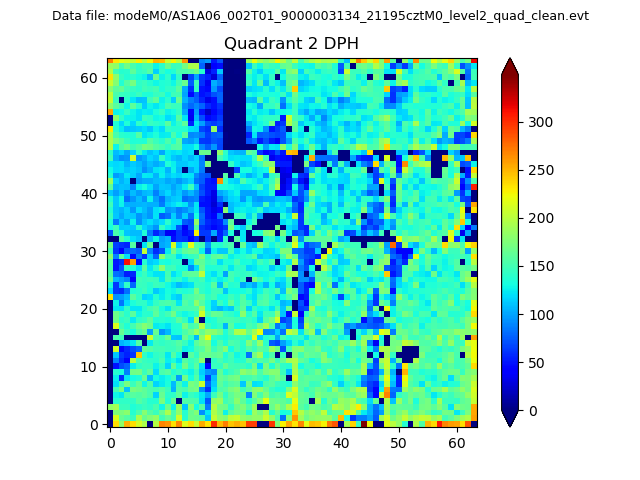
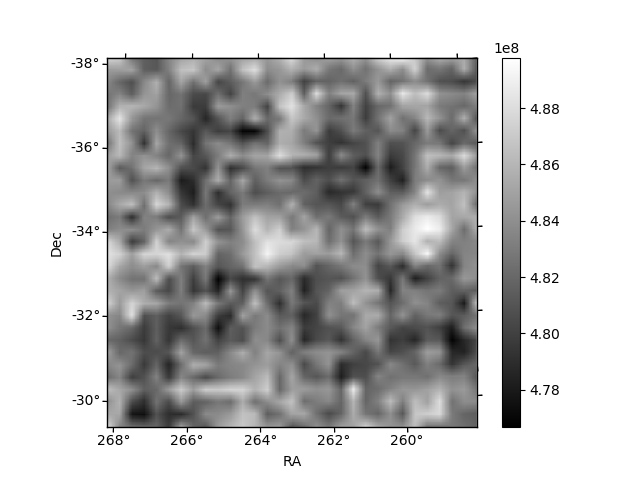
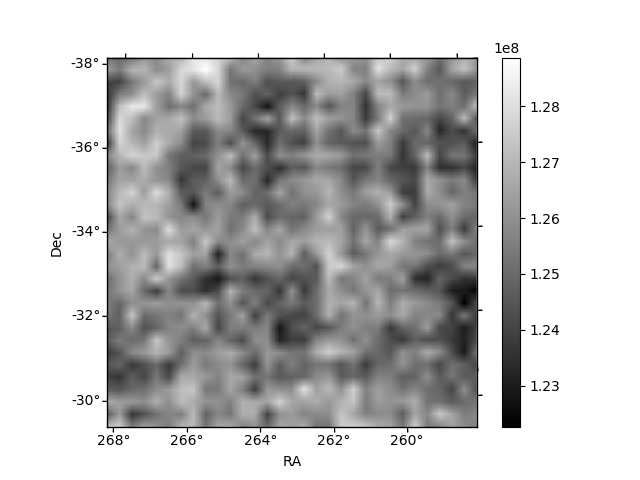
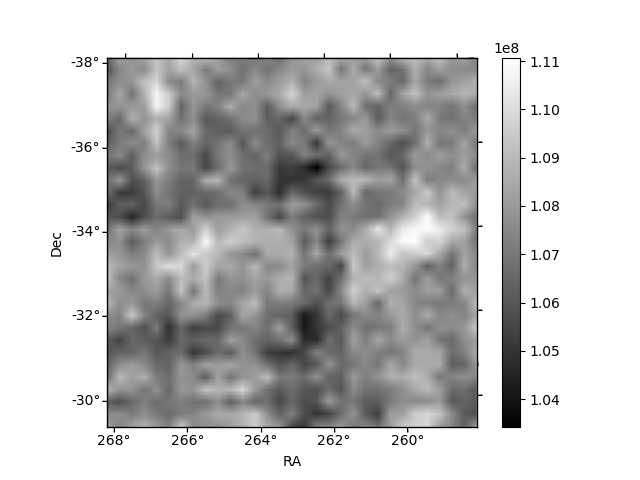
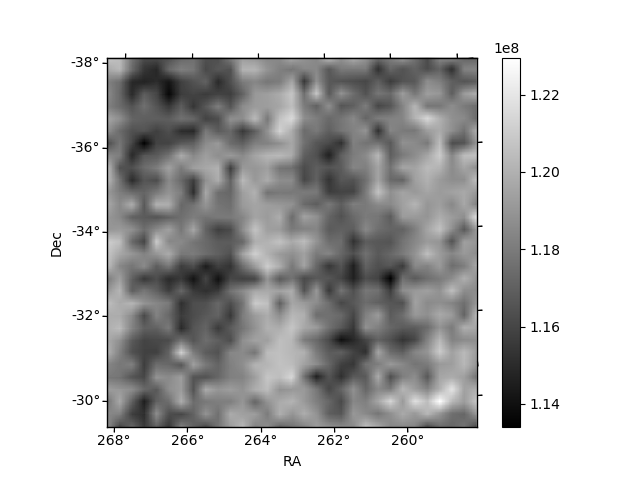
Histogram calculated using DETX and DETY for each event in the final _common_clean file
| Quadrant A | 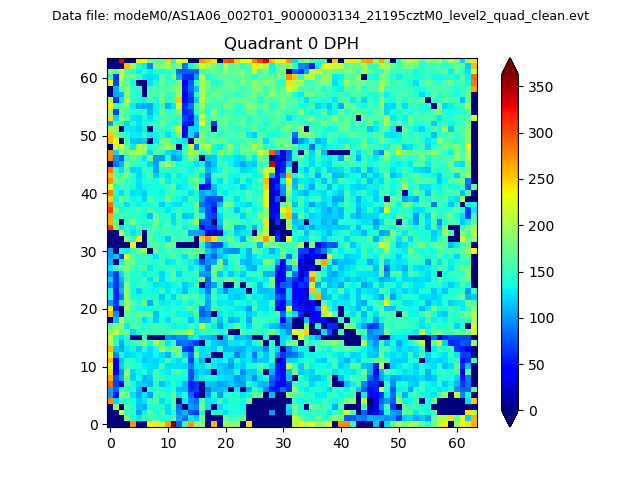 |
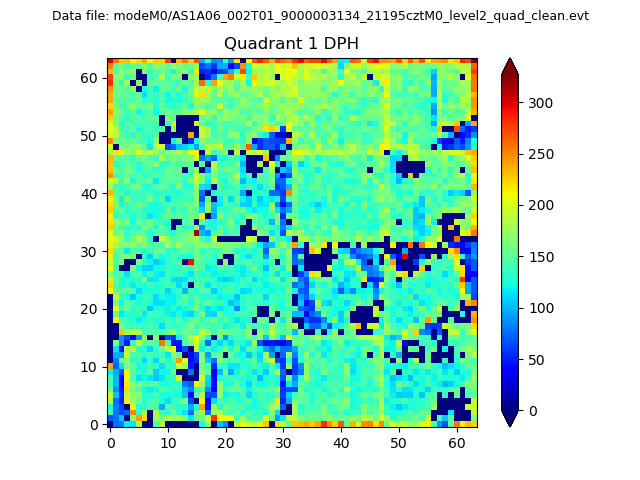 |
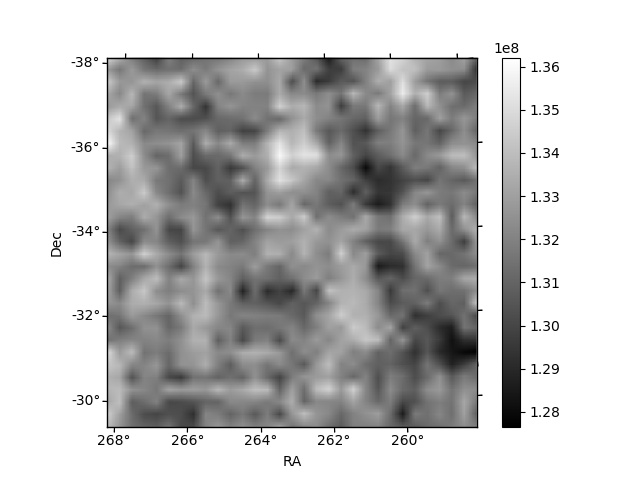
Quadrant B |
|---|---|---|---|
| Quadrant D | 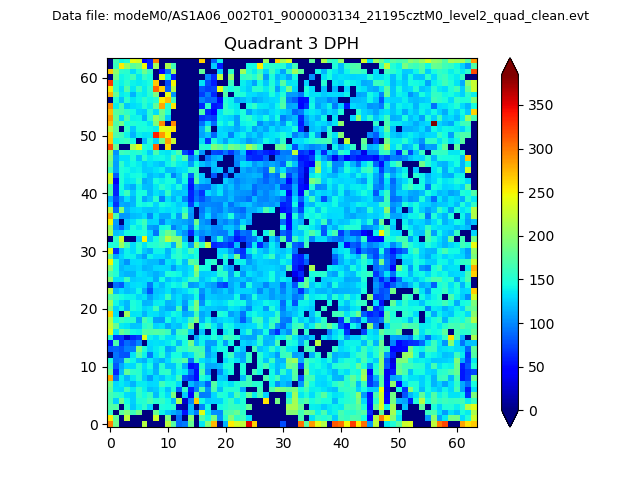 |
 |
Quadrant C |
| Plot type | Count rate plots | Images |
|---|---|---|
| Comparison with Poisson distribution Blue bars denote a histogram of data divided into 1 sec bins. Red curve is a Poisson curve with rate = median count rate of data. |
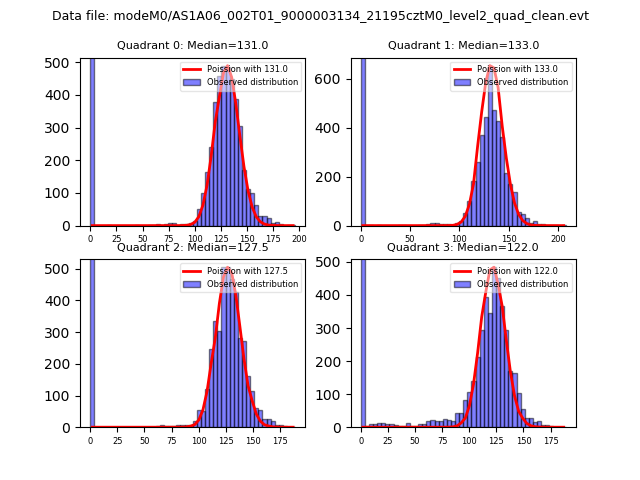 |
 |
| Quadrant-wise count rates Data is divided into 100 sec bins |
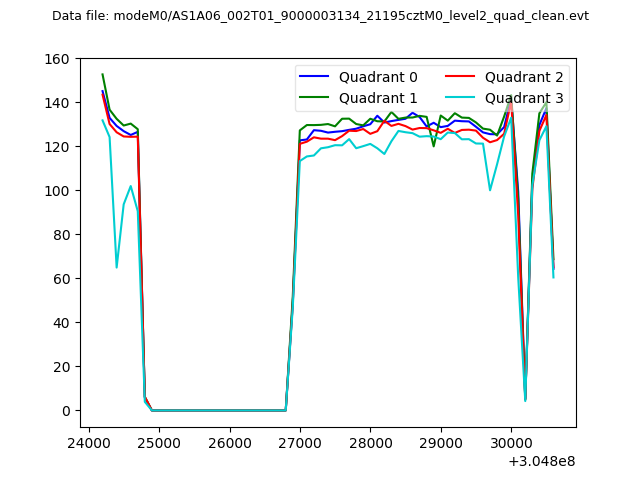 |
|
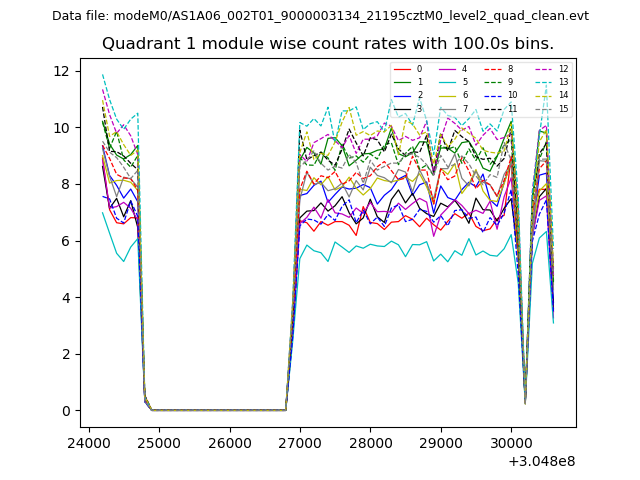
| Module-wise count rates for Quadrant A Data is divided into 100 sec bins |
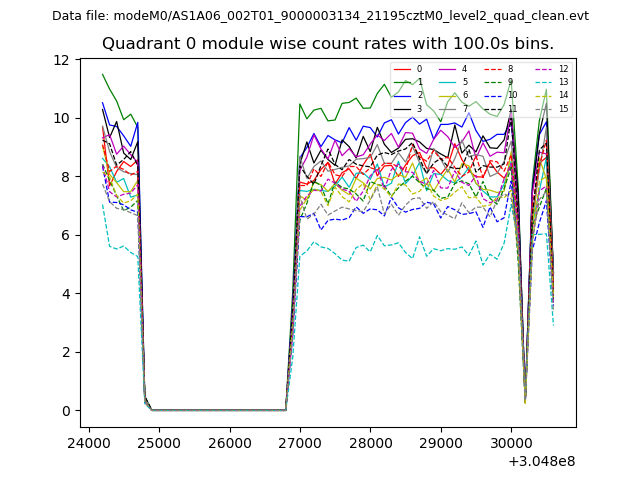 |
 |
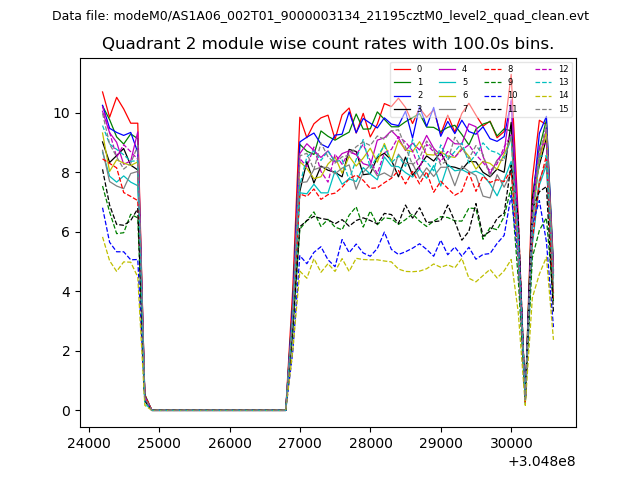
| Module-wise count rates for Quadrant B Data is divided into 100 sec bins |
 |
 |
| Module-wise count rates for Quadrant C Data is divided into 100 sec bins |
 |
 |
| Module-wise count rates for Quadrant D Data is divided into 100 sec bins |
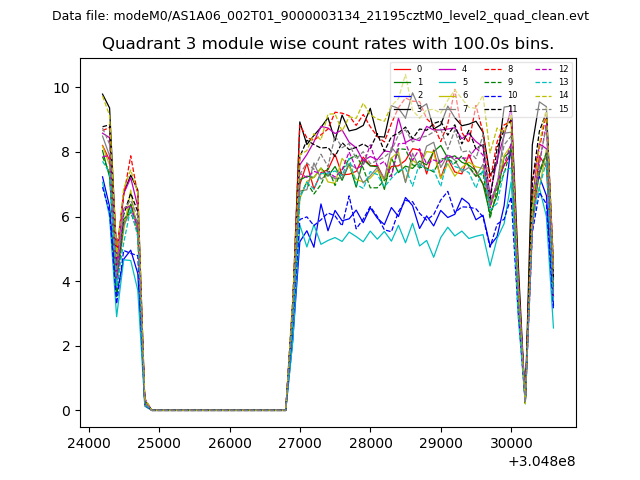 |
 |
| Parameter | Plot |
|---|---|
| CZT HV Monitor | 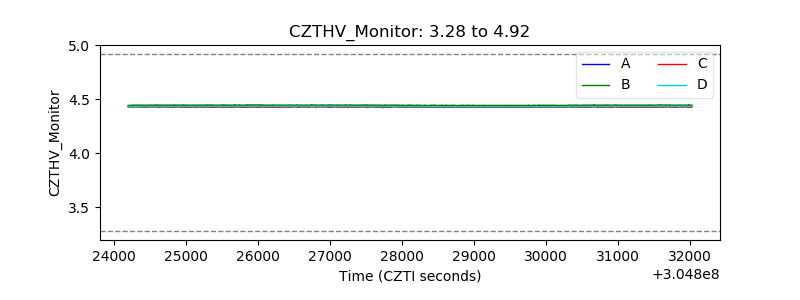 |
| D_VDD | 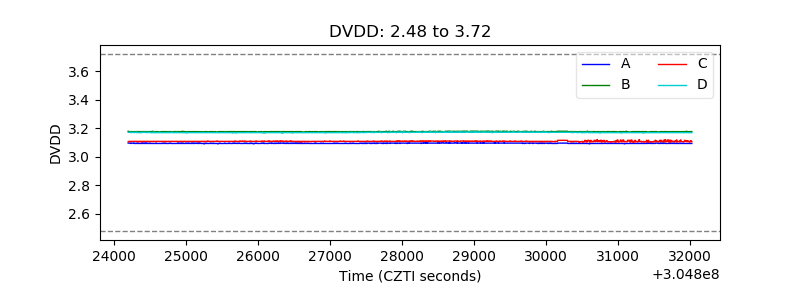 |
| Temperature 1 | 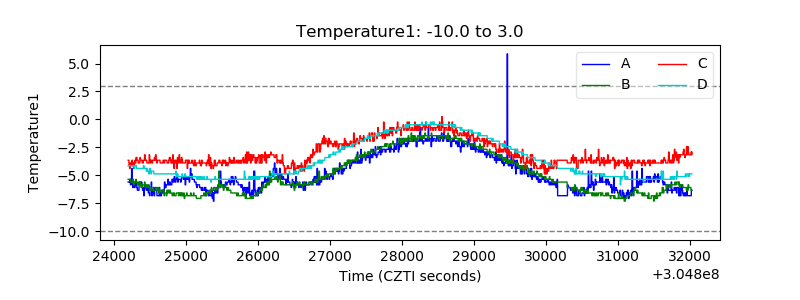 |
| Veto HV Monitor | 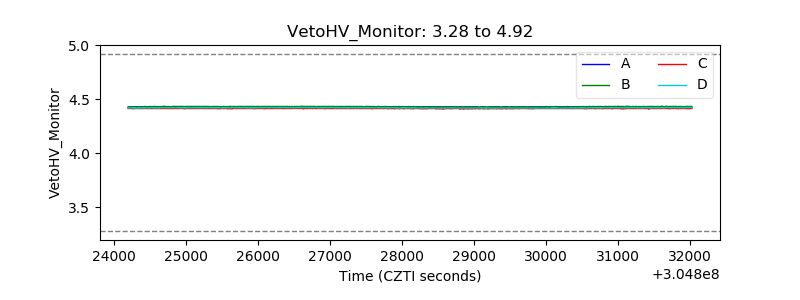 |
| Veto LLD | 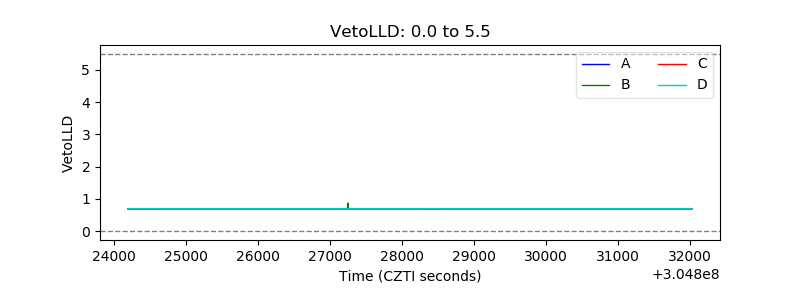 |
| Alpha Counter | 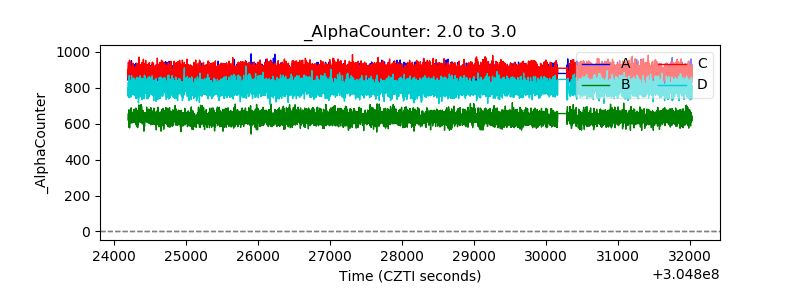 |
| _CPM_Rate | 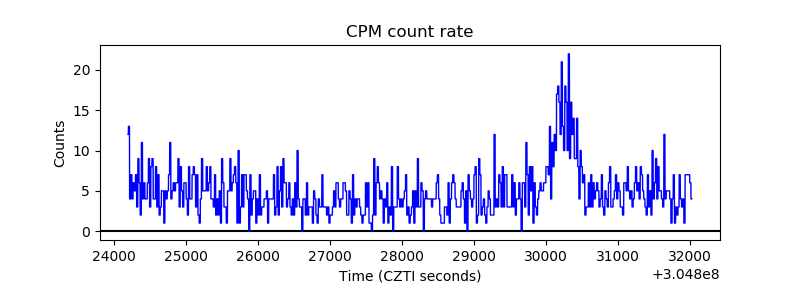 |
| CZT Counter | 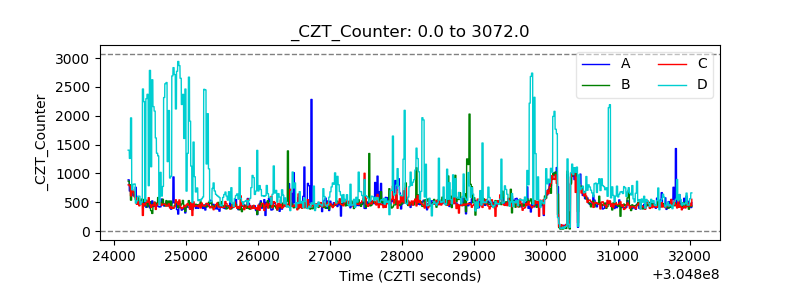 |
| +2.5 Volts monitor | 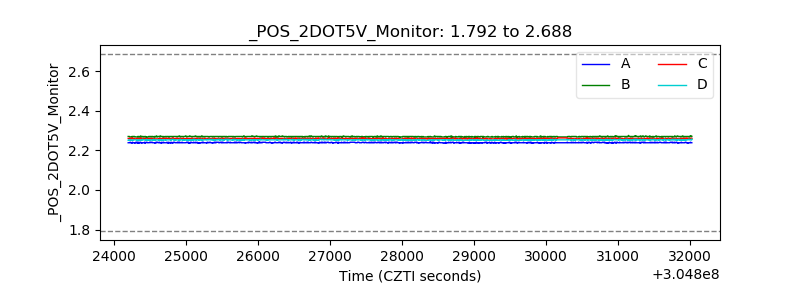 |
| +5 Volts monitor |  |
| _ROLL_ROT | 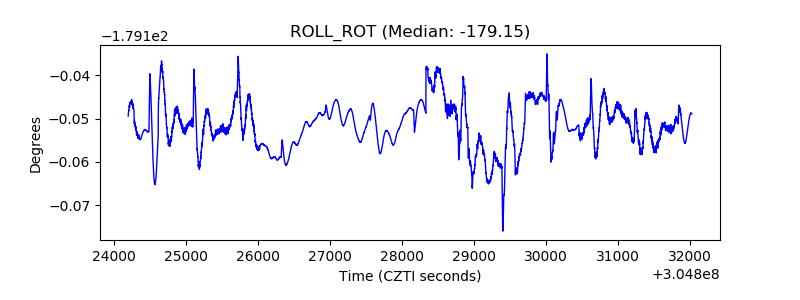 |
| _Roll_DEC | 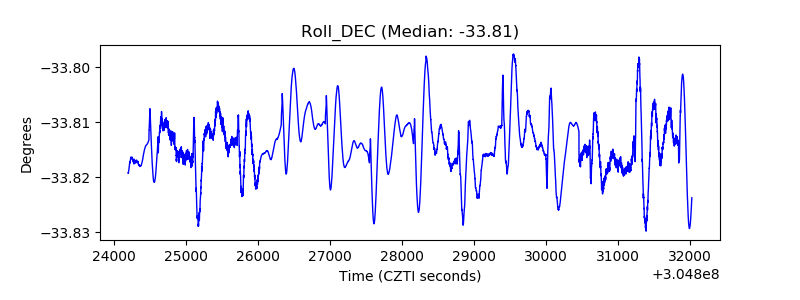 |
| _Roll_RA | 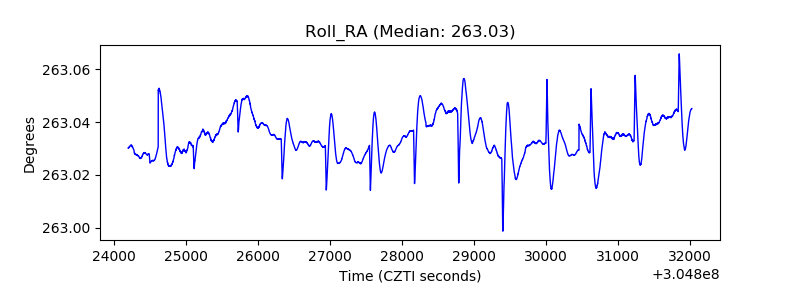 |
| Veto Counter | 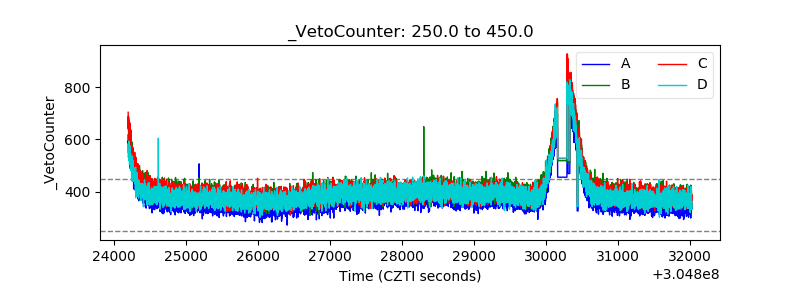 |