| Param | Original file | Final file |
|---|---|---|
| Filename | modeM0/AS1A06_002T01_9000003134_21199cztM0_level2.evt | modeM0/AS1A06_002T01_9000003134_21199cztM0_level2_quad_clean.evt |
| Size (bytes) | 1,407,522,240 | 252,947,520 |
| Size | 1.3 GB | 241.2 MB |
| Events in quadrant A | 10,653,263 | 1,593,044 |
| Events in quadrant B | 9,570,879 | 1,634,336 |
| Events in quadrant C | 9,673,087 | 1,574,975 |
| Events in quadrant D | 11,420,948 | 1,524,468 |
| Mode SS | |||
|---|---|---|---|
| Quadrant | BADHDUFLAG | Total packets | Discarded packets |
| A | 0 | 394 | 0 |
| B | 0 | 394 | 0 |
| C | 0 | 394 | 0 |
| D | 0 | 394 | 0 |
| Mode M0 | |||
|---|---|---|---|
| Quadrant | BADHDUFLAG | Total packets | Discarded packets |
| A | 0 | 44336 | 4 |
| B | 0 | 40499 | 4 |
| C | 0 | 41085 | 4 |
| D | 0 | 46765 | 4 |
| Mode M9 | |||
|---|---|---|---|
| Quadrant | BADHDUFLAG | Total packets | Discarded packets |
| A | 0 | 22 | 0 |
| B | 0 | 22 | 0 |
| C | 0 | 22 | 0 |
| D | 0 | 22 | 0 |
| Quadrant | Total seconds | Saturated seconds | Saturation percentage |
|---|---|---|---|
| A | 19375 | 552 | 2.849032% |
| B | 19375 | 317 | 1.636129% |
| C | 19375 | 434 | 2.240000% |
| D | 19375 | 488 | 2.518710% |
Noise dominated data is calculated using 1-second bins in cleaned event files. If a bin has >2000 counts, and if more than 50% of those come from <1% of pixels, then it is considered to be noise-dominated and hence unusable.
| Quadrant | # 1 sec bins | Bins with >0 counts | Bins with >2000 counts | High rate bins dominated by noise | Noise dominated (total time) | Noise dominated (detector-on time) | Marked lightcurve |
|---|---|---|---|---|---|---|---|
| A | 21515 | 19376 | 204 | 204 | 0.95% | 1.05% | 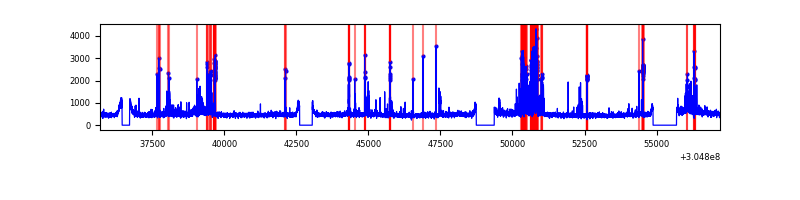 |
| B | 21515 | 19376 | 10 | 10 | 0.05% | 0.05% | 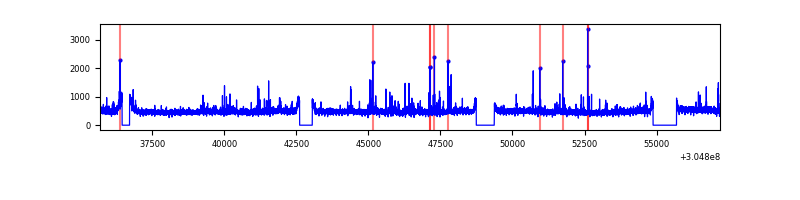 |
| C | 21515 | 19375 | 22 | 22 | 0.10% | 0.11% | 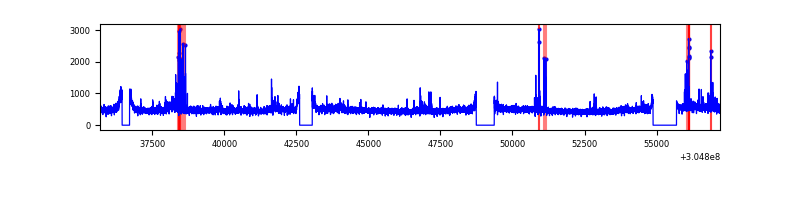 |
| D | 21515 | 19375 | 231 | 231 | 1.07% | 1.19% | 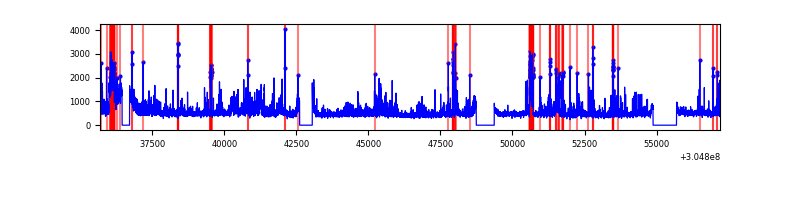 |
Top three noisy pixels from each quadrant. If the there are fewer than three noisy pixels in the level2.evt file, extra rows are filled as -1
| Pixel properties | Quadrant properties | ||||||
|---|---|---|---|---|---|---|---|
| Quadrant | DetID | PixID | Counts | Sigma | Mean | Median | Sigma |
| A | 13 | 252 | 1100985 | 2329.34 | 2336 | 2280 | 471.7 |
| A | 15 | 236 | 385093 | 811.59 | 2336 | 2280 | 471.7 |
| A | 11 | 47 | 73698 | 151.41 | 2336 | 2280 | 471.7 |
| B | 0 | 197 | 110517 | 240.66 | 2342 | 2284 | 449.7 |
| B | 0 | 190 | 61946 | 132.66 | 2342 | 2284 | 449.7 |
| B | 0 | 182 | 55238 | 117.75 | 2342 | 2284 | 449.7 |
| C | 3 | 233 | 477899 | 901.52 | 2246 | 2260 | 527.6 |
| C | 14 | 238 | 349095 | 657.38 | 2246 | 2260 | 527.6 |
| C | 0 | 207 | 83422 | 153.83 | 2246 | 2260 | 527.6 |
| D | 1 | 239 | 1026430 | 1853.84 | 2267 | 2207 | 552.5 |
| D | 1 | 52 | 401670 | 723.03 | 2267 | 2207 | 552.5 |
| D | 7 | 238 | 304951 | 547.97 | 2267 | 2207 | 552.5 |
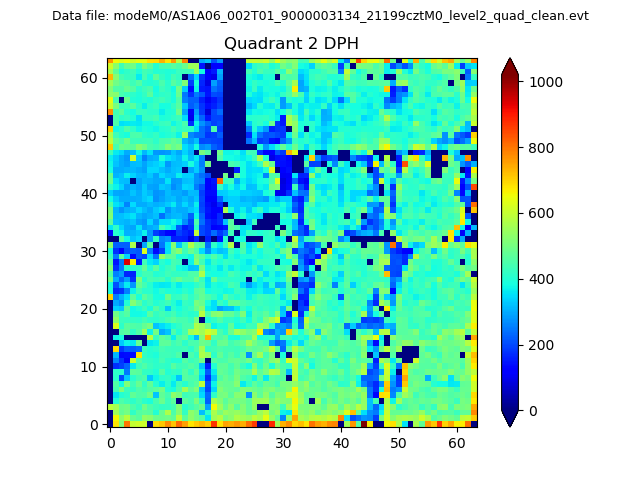
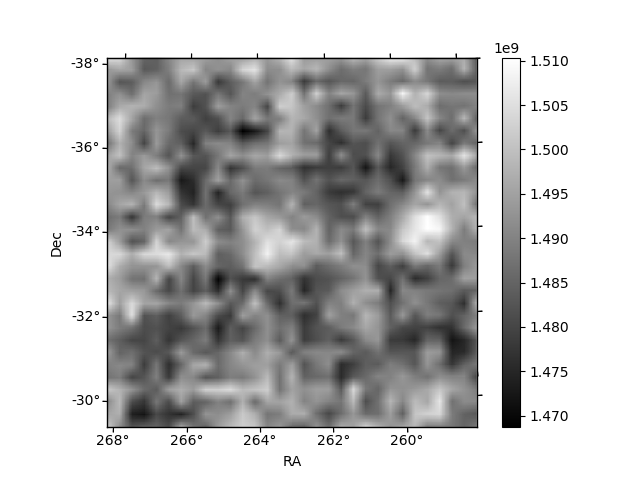
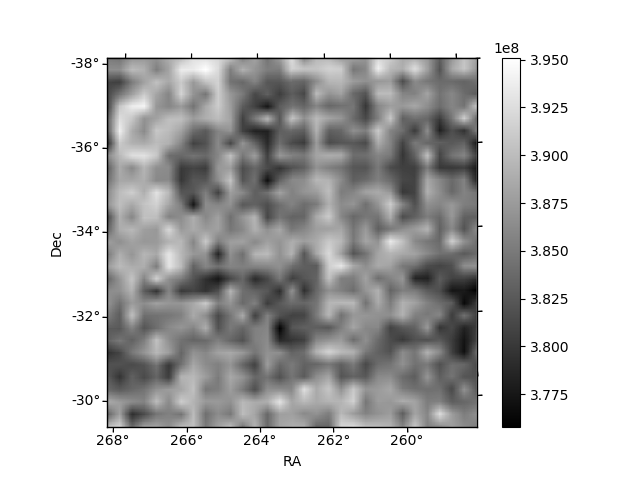
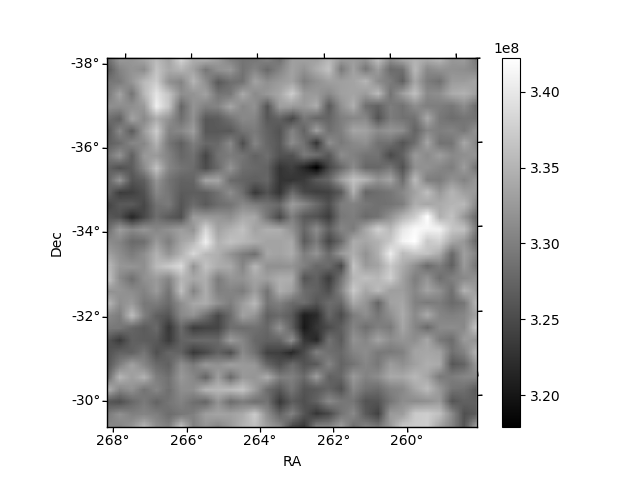
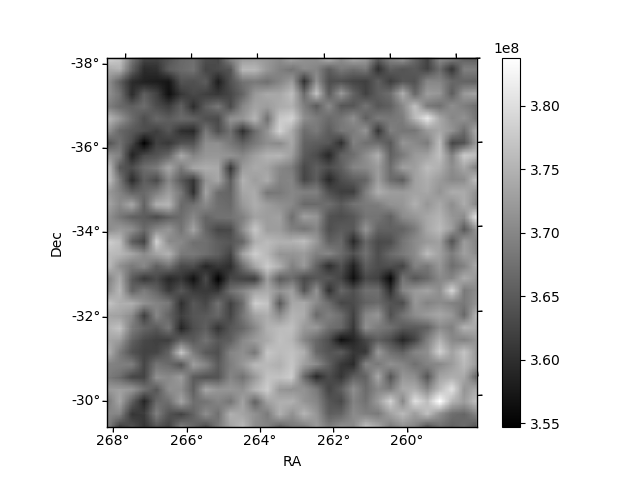
Histogram calculated using DETX and DETY for each event in the final _common_clean file
| Quadrant A | 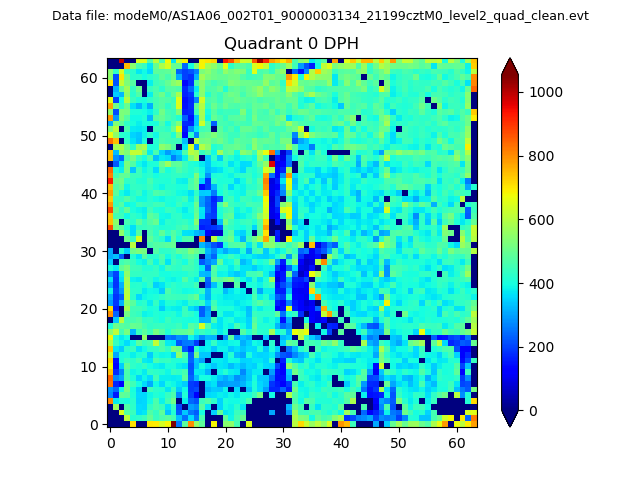 |
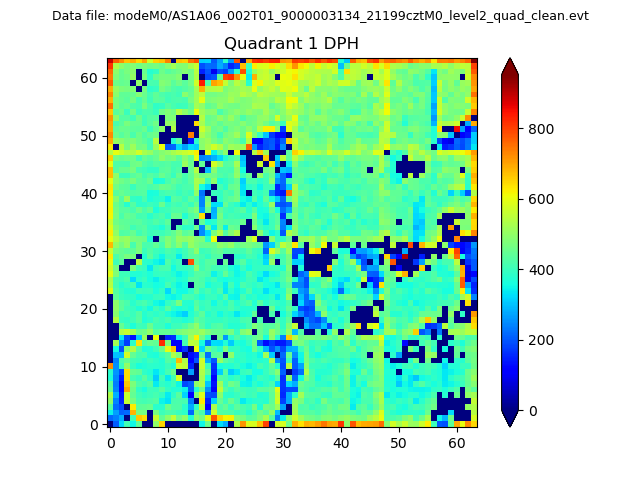 |
Quadrant B |
|---|---|---|---|
| Quadrant D | 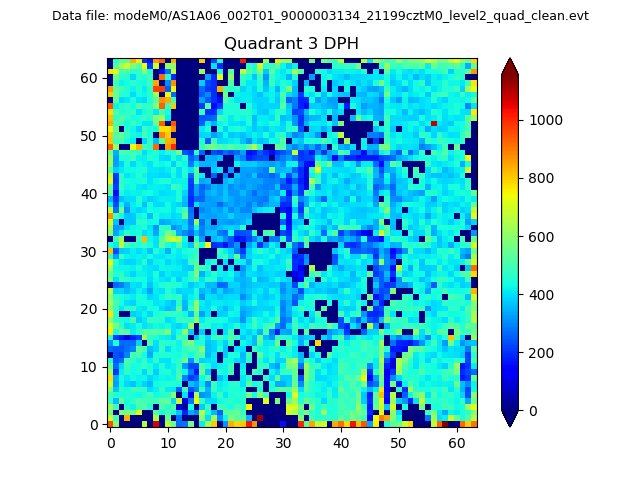 |
 |
Quadrant C |
| Plot type | Count rate plots | Images |
|---|---|---|
| Comparison with Poisson distribution Blue bars denote a histogram of data divided into 1 sec bins. Red curve is a Poisson curve with rate = median count rate of data. |
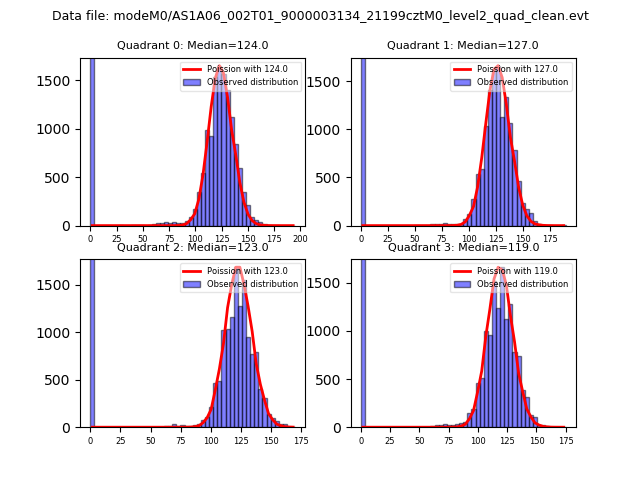 |
 |
| Quadrant-wise count rates Data is divided into 100 sec bins |
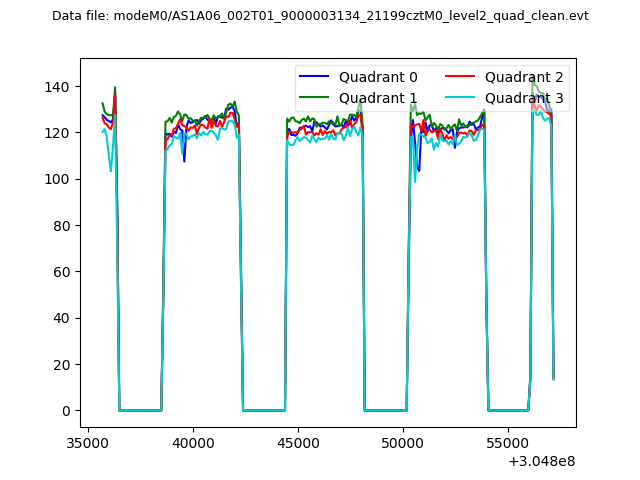 |
|
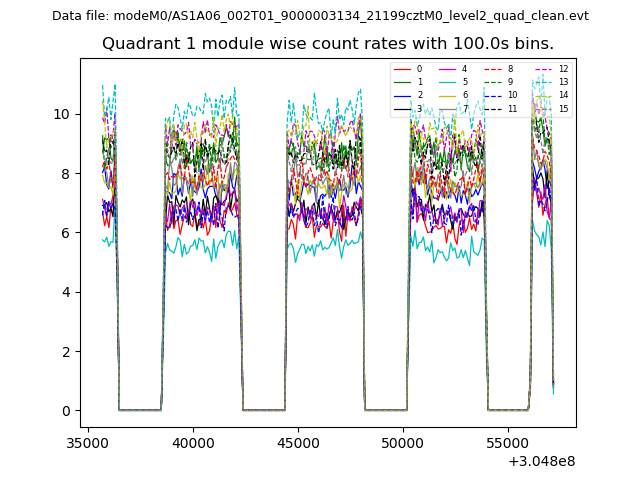
| Module-wise count rates for Quadrant A Data is divided into 100 sec bins |
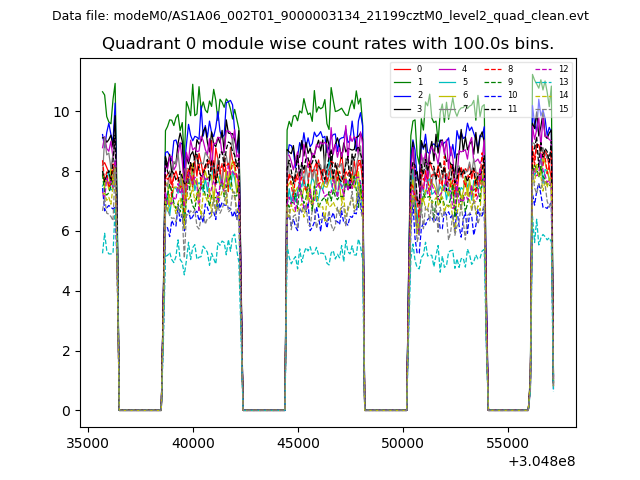 |
 |
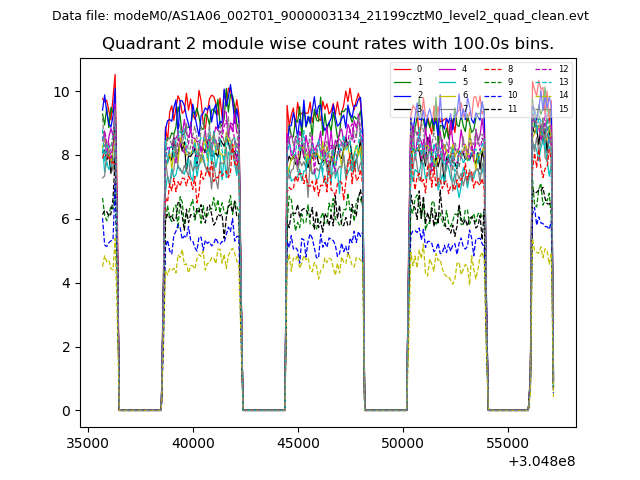
| Module-wise count rates for Quadrant B Data is divided into 100 sec bins |
 |
 |
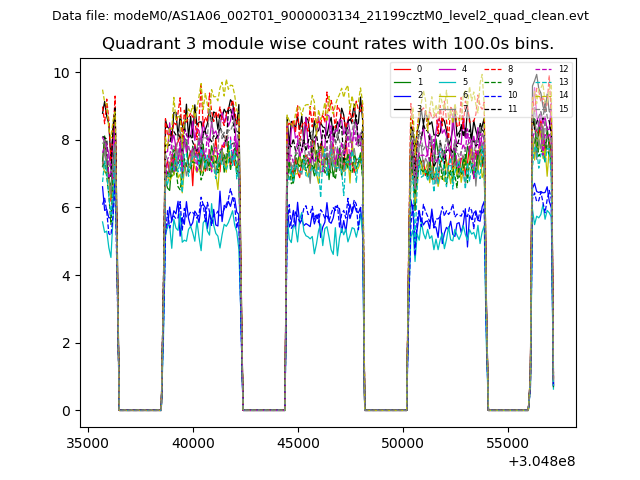
| Module-wise count rates for Quadrant C Data is divided into 100 sec bins |
 |
 |
| Module-wise count rates for Quadrant D Data is divided into 100 sec bins |
 |
 |
| Parameter | Plot |
|---|---|
| CZT HV Monitor | 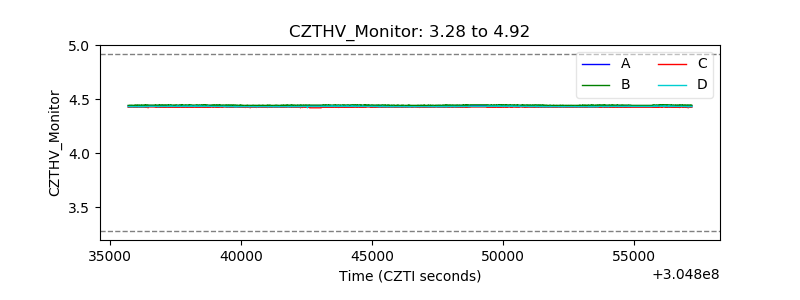 |
| D_VDD |  |
| Temperature 1 | 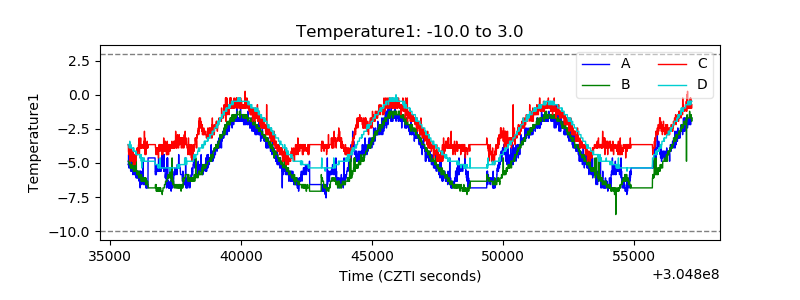 |
| Veto HV Monitor | 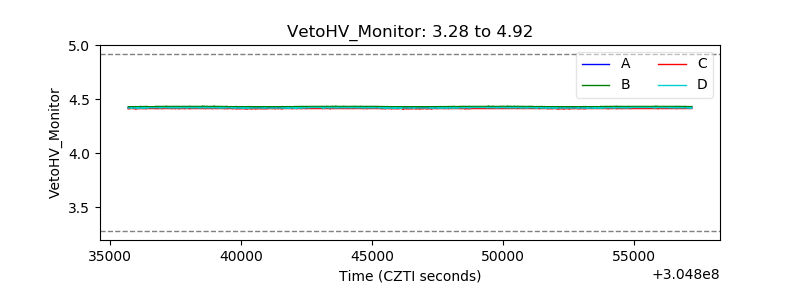 |
| Veto LLD | 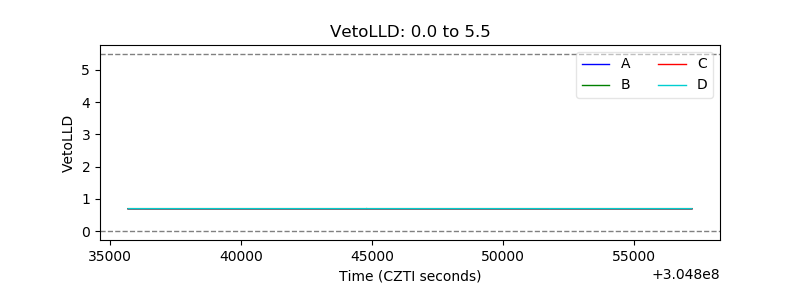 |
| Alpha Counter | 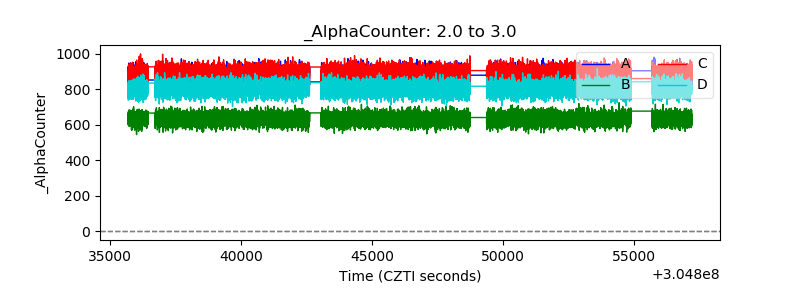 |
| _CPM_Rate | 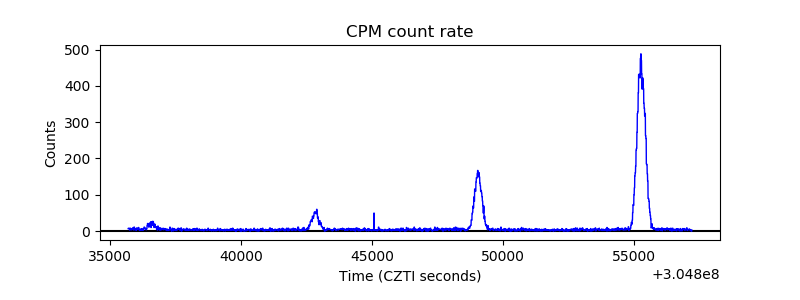 |
| CZT Counter | 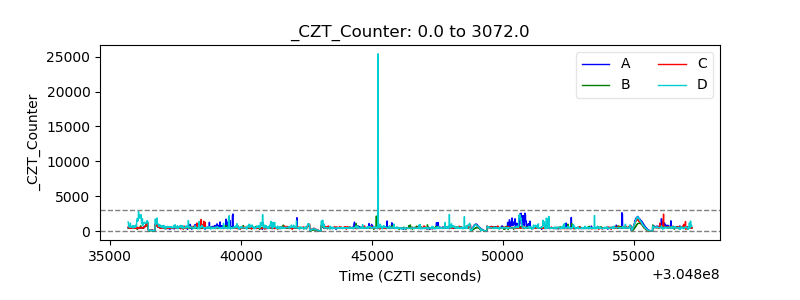 |
| +2.5 Volts monitor |  |
| +5 Volts monitor |  |
| _ROLL_ROT | 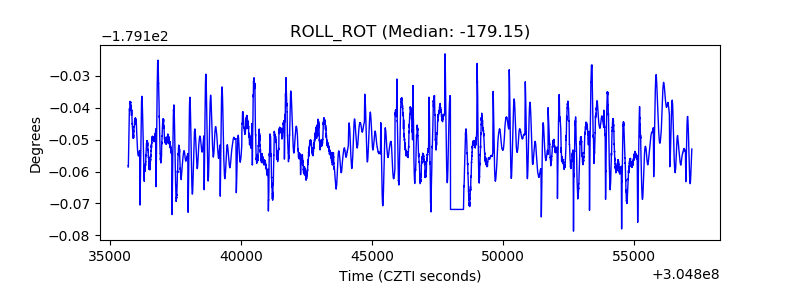 |
| _Roll_DEC | 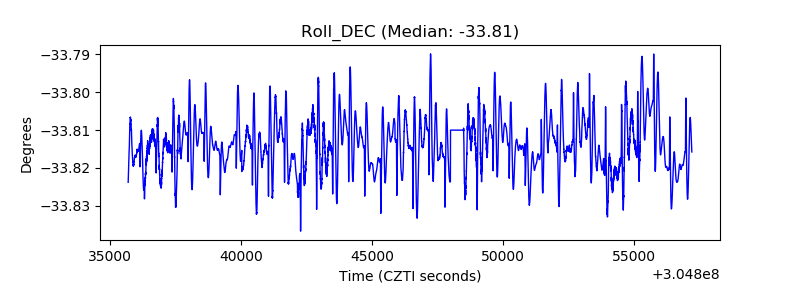 |
| _Roll_RA | 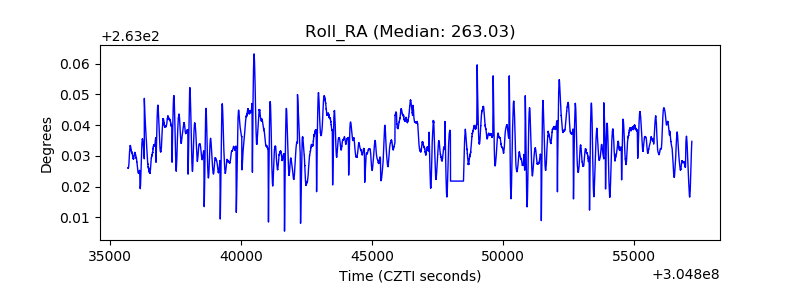 |
| Veto Counter | 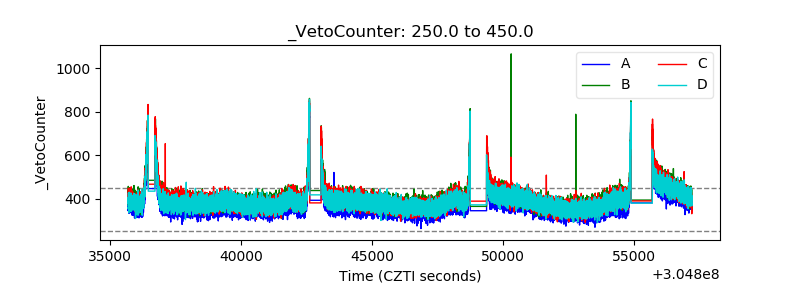 |