| Param | Original file | Final file |
|---|---|---|
| Filename | modeM0/AS1A06_002T01_9000003134_21200cztM0_level2.evt | modeM0/AS1A06_002T01_9000003134_21200cztM0_level2_quad_clean.evt |
| Size (bytes) | 500,446,080 | 101,736,000 |
| Size | 477.3 MB | 97.0 MB |
| Events in quadrant A | 3,560,535 | 668,564 |
| Events in quadrant B | 3,811,634 | 671,947 |
| Events in quadrant C | 3,565,875 | 644,316 |
| Events in quadrant D | 3,765,325 | 631,035 |
| Mode SS | |||
|---|---|---|---|
| Quadrant | BADHDUFLAG | Total packets | Discarded packets |
| A | 0 | 134 | 0 |
| B | 0 | 134 | 0 |
| C | 0 | 134 | 0 |
| D | 0 | 134 | 0 |
| Mode M0 | |||
|---|---|---|---|
| Quadrant | BADHDUFLAG | Total packets | Discarded packets |
| A | 0 | 15061 | 2 |
| B | 0 | 15423 | 2 |
| C | 0 | 14829 | 2 |
| D | 0 | 15660 | 2 |
| Mode M9 | |||
|---|---|---|---|
| Quadrant | BADHDUFLAG | Total packets | Discarded packets |
| A | 0 | 11 | 0 |
| B | 0 | 12 | 0 |
| C | 0 | 12 | 0 |
| D | 0 | 12 | 0 |
| Quadrant | Total seconds | Saturated seconds | Saturation percentage |
|---|---|---|---|
| A | 6680 | 74 | 1.107784% |
| B | 6680 | 73 | 1.092814% |
| C | 6680 | 102 | 1.526946% |
| D | 6680 | 83 | 1.242515% |
Noise dominated data is calculated using 1-second bins in cleaned event files. If a bin has >2000 counts, and if more than 50% of those come from <1% of pixels, then it is considered to be noise-dominated and hence unusable.
| Quadrant | # 1 sec bins | Bins with >0 counts | Bins with >2000 counts | High rate bins dominated by noise | Noise dominated (total time) | Noise dominated (detector-on time) | Marked lightcurve |
|---|---|---|---|---|---|---|---|
| A | 7665 | 6680 | 9 | 9 | 0.12% | 0.13% |  |
| B | 7665 | 6680 | 18 | 18 | 0.23% | 0.27% |  |
| C | 7665 | 6680 | 10 | 10 | 0.13% | 0.15% |  |
| D | 7665 | 6680 | 35 | 35 | 0.46% | 0.52% |  |
Top three noisy pixels from each quadrant. If the there are fewer than three noisy pixels in the level2.evt file, extra rows are filled as -1
| Pixel properties | Quadrant properties | ||||||
|---|---|---|---|---|---|---|---|
| Quadrant | DetID | PixID | Counts | Sigma | Mean | Median | Sigma |
| A | 13 | 252 | 272155 | 1605.17 | 838 | 820 | 169.0 |
| A | 11 | 47 | 36309 | 209.95 | 838 | 820 | 169.0 |
| A | 8 | 6 | 22243 | 126.73 | 838 | 820 | 169.0 |
| B | 0 | 182 | 354890 | 2213.43 | 828 | 807 | 160.0 |
| B | 10 | 247 | 62535 | 385.87 | 828 | 807 | 160.0 |
| B | 0 | 197 | 32441 | 197.75 | 828 | 807 | 160.0 |
| C | 3 | 233 | 285625 | 1527.56 | 793 | 798 | 186.5 |
| C | 14 | 238 | 123641 | 658.82 | 793 | 798 | 186.5 |
| C | 0 | 207 | 63672 | 337.2 | 793 | 798 | 186.5 |
| D | 12 | 235 | 195357 | 989.19 | 809 | 787 | 196.7 |
| D | 7 | 238 | 161113 | 815.09 | 809 | 787 | 196.7 |
| D | 13 | 174 | 104469 | 527.12 | 809 | 787 | 196.7 |
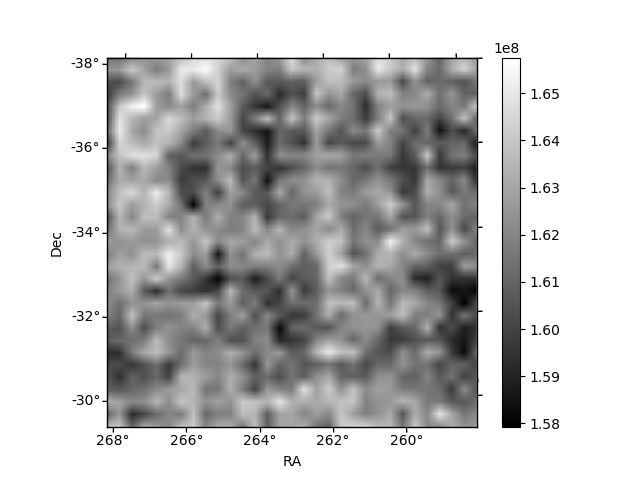
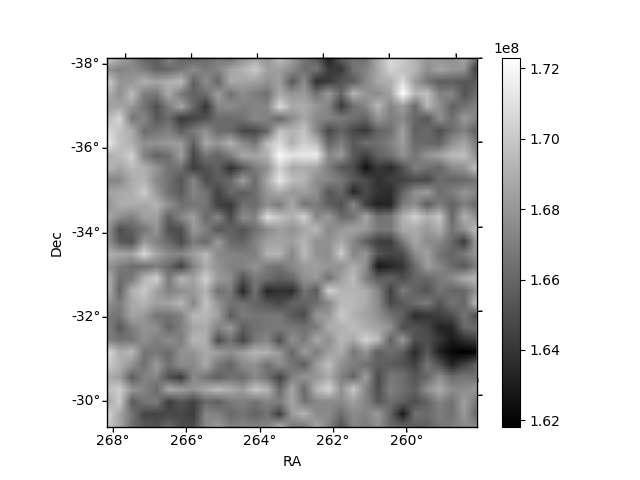
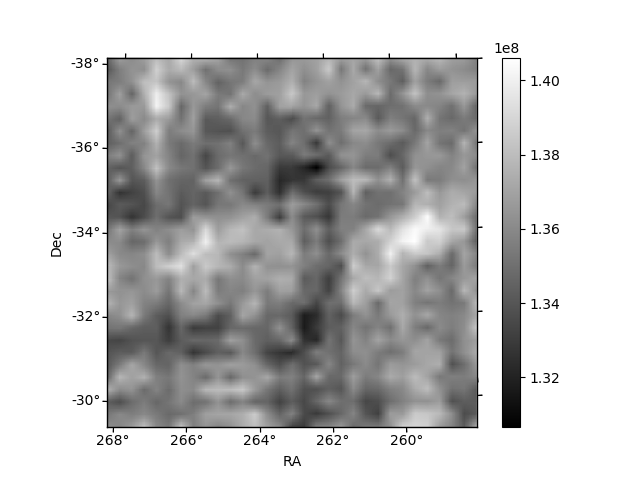
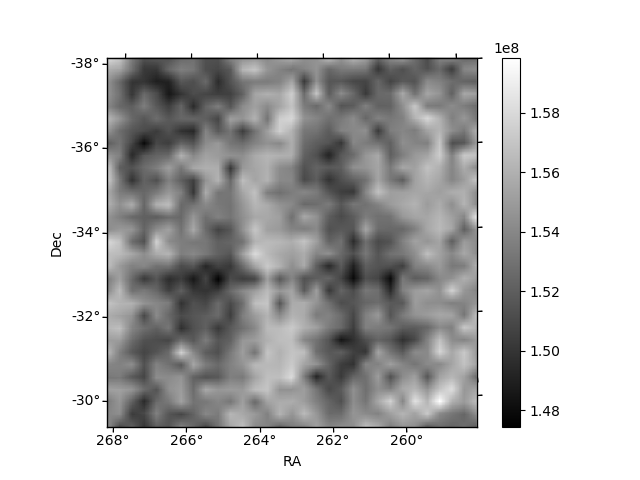
Histogram calculated using DETX and DETY for each event in the final _common_clean file
| Quadrant A | 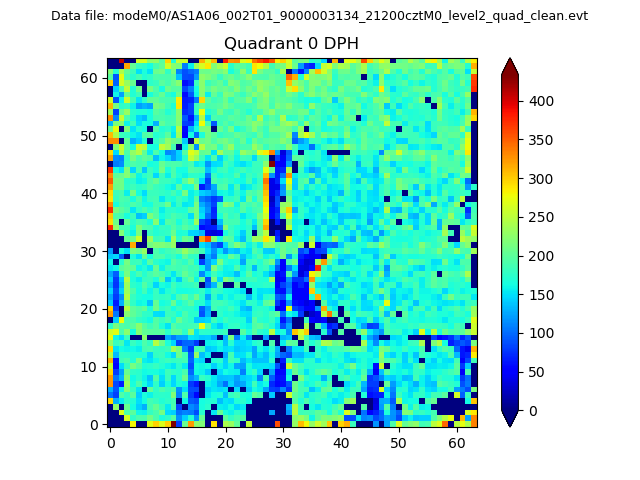 |
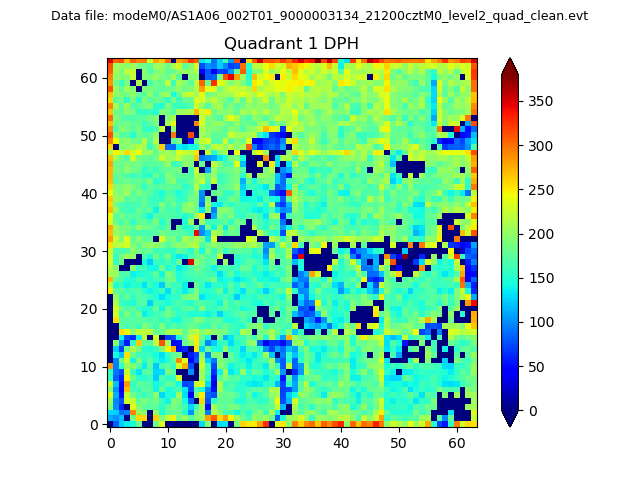 |
Quadrant B |
|---|---|---|---|
| Quadrant D | 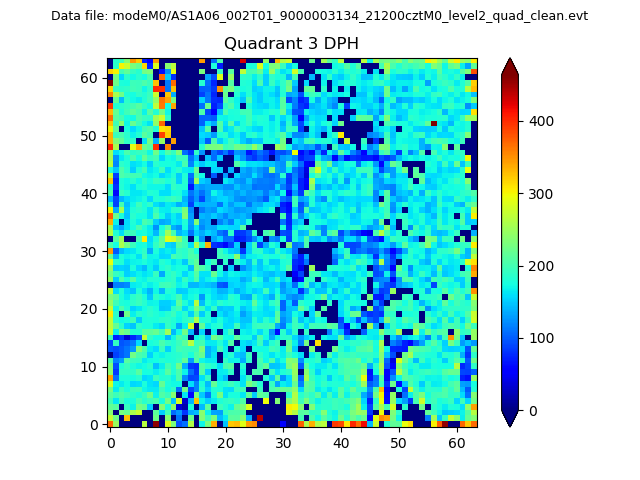 |
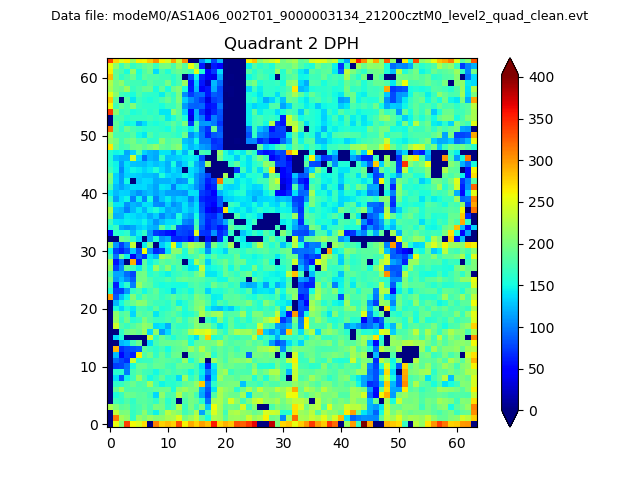 |
Quadrant C |
| Plot type | Count rate plots | Images |
|---|---|---|
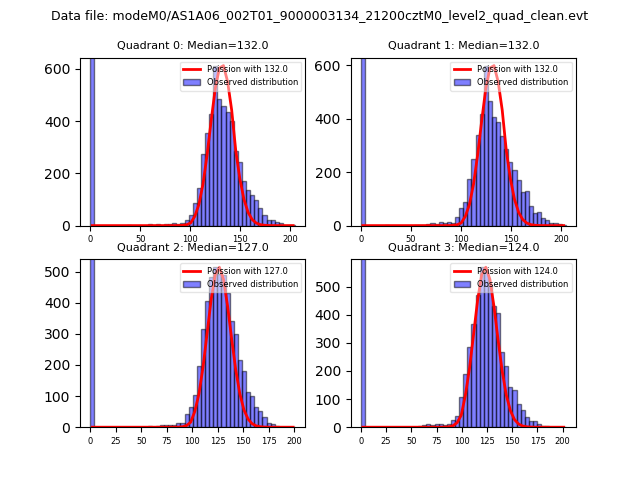
| Comparison with Poisson distribution Blue bars denote a histogram of data divided into 1 sec bins. Red curve is a Poisson curve with rate = median count rate of data. |
 |
 |
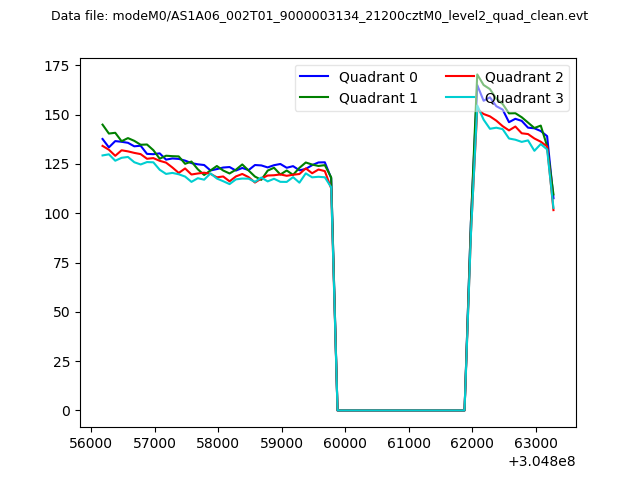
| Quadrant-wise count rates Data is divided into 100 sec bins |
 |
|
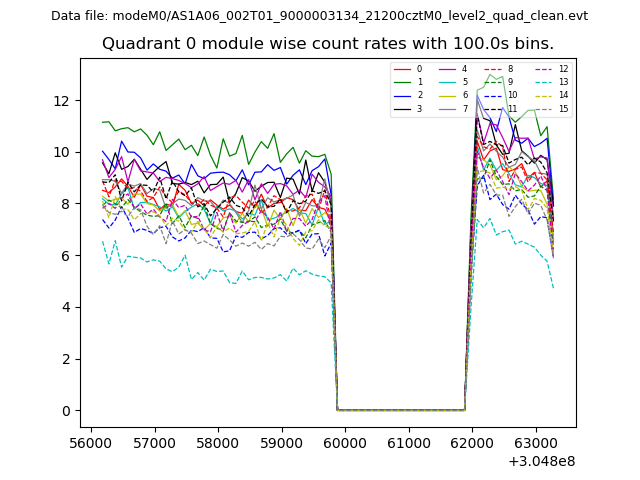
| Module-wise count rates for Quadrant A Data is divided into 100 sec bins |
 |
 |
| Module-wise count rates for Quadrant B Data is divided into 100 sec bins |
 |
 |
| Module-wise count rates for Quadrant C Data is divided into 100 sec bins |
 |
 |
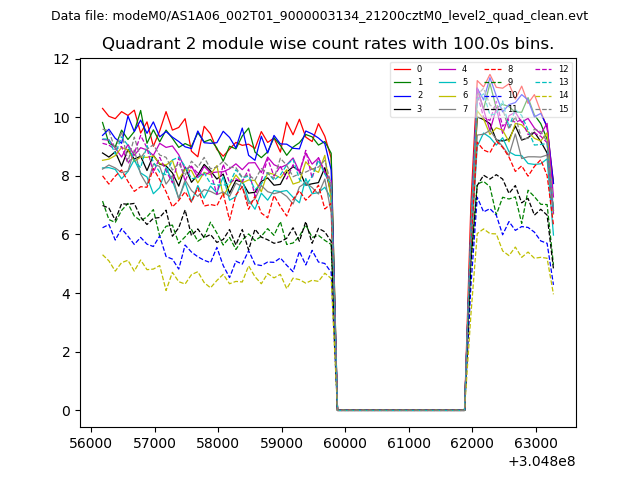
| Module-wise count rates for Quadrant D Data is divided into 100 sec bins |
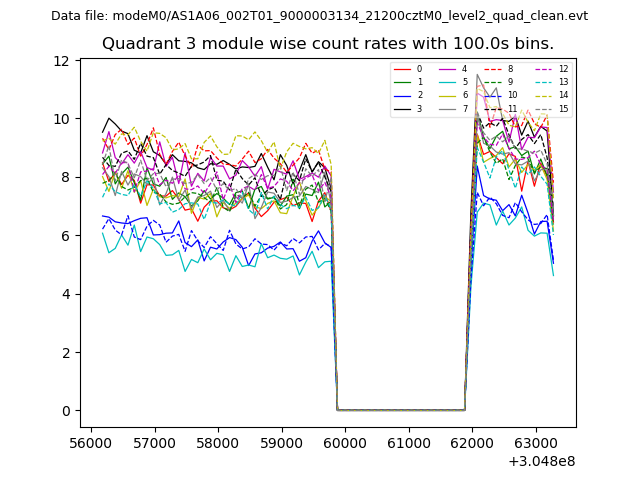 |
 |
| Parameter | Plot |
|---|---|
| CZT HV Monitor |  |
| D_VDD | 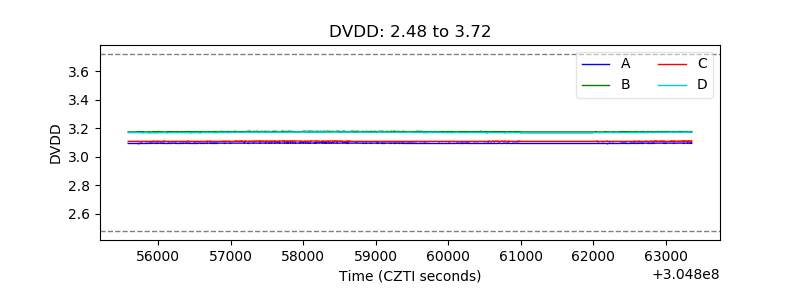 |
| Temperature 1 | 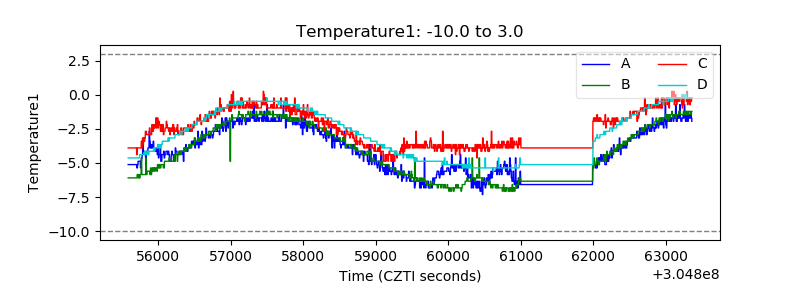 |
| Veto HV Monitor | 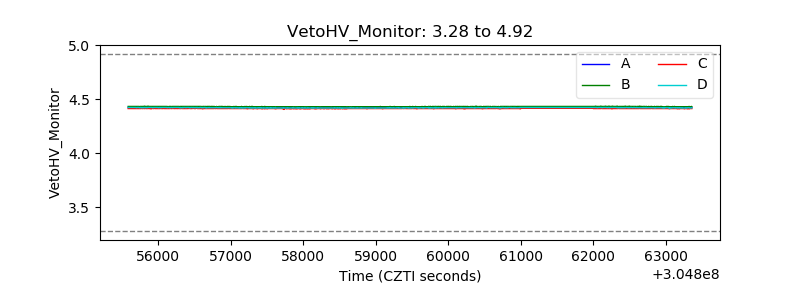 |
| Veto LLD | 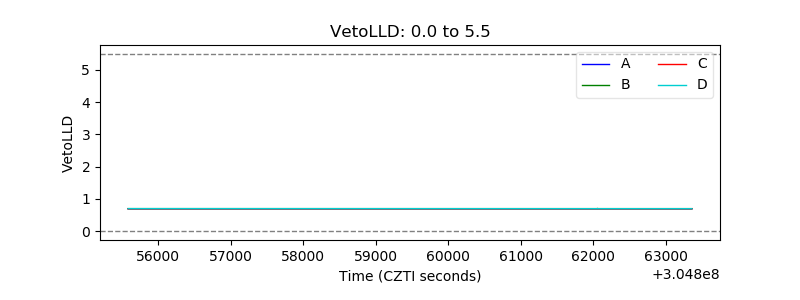 |
| Alpha Counter | 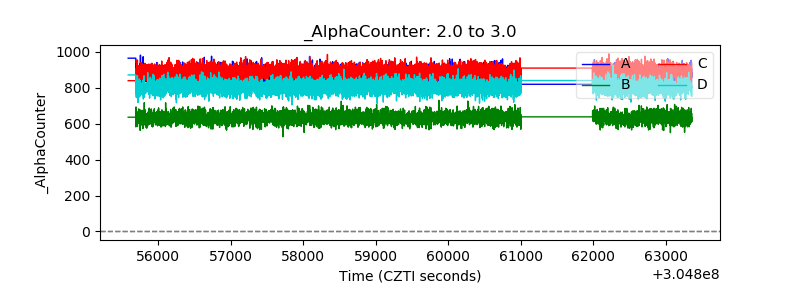 |
| _CPM_Rate | 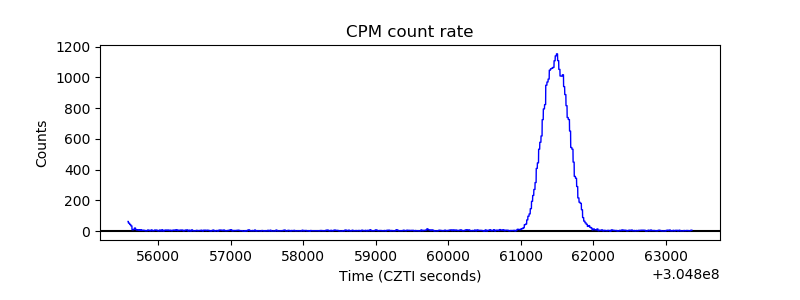 |
| CZT Counter | 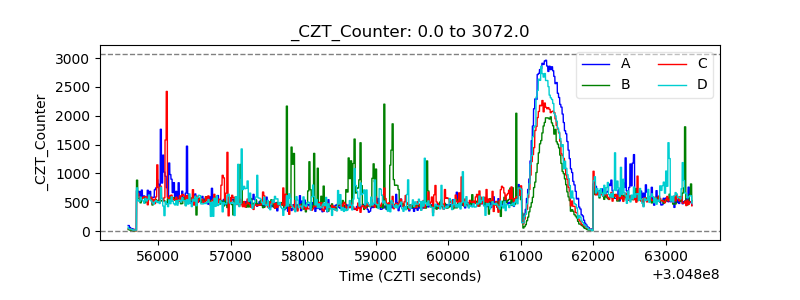 |
| +2.5 Volts monitor |  |
| +5 Volts monitor |  |
| _ROLL_ROT |  |
| _Roll_DEC | 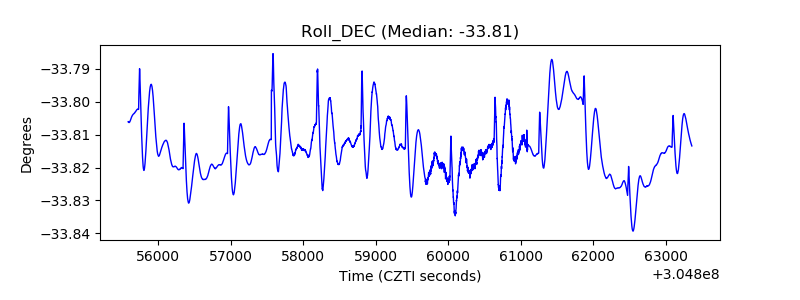 |
| _Roll_RA | 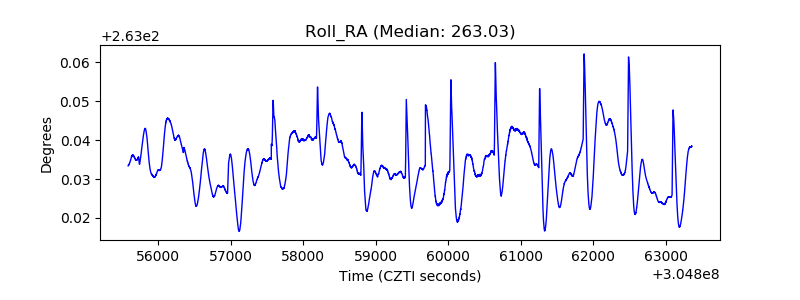 |
| Veto Counter | 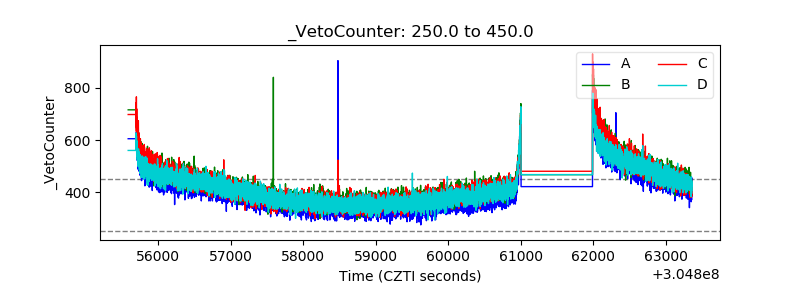 |