| Param | Original file | Final file |
|---|---|---|
| Filename | modeM0/AS1A06_002T01_9000003134_21204cztM0_level2.evt | modeM0/AS1A06_002T01_9000003134_21204cztM0_level2_quad_clean.evt |
| Size (bytes) | 644,751,360 | 95,872,320 |
| Size | 614.9 MB | 91.4 MB |
| Events in quadrant A | 3,690,079 | 671,410 |
| Events in quadrant B | 6,538,625 | 601,939 |
| Events in quadrant C | 3,259,550 | 636,955 |
| Events in quadrant D | 5,614,677 | 555,647 |
| Mode SS | |||
|---|---|---|---|
| Quadrant | BADHDUFLAG | Total packets | Discarded packets |
| A | 0 | 126 | 0 |
| B | 0 | 126 | 0 |
| C | 0 | 126 | 0 |
| D | 0 | 126 | 0 |
| Mode M0 | |||
|---|---|---|---|
| Quadrant | BADHDUFLAG | Total packets | Discarded packets |
| A | 0 | 15093 | 2 |
| B | 0 | 23448 | 2 |
| C | 0 | 13703 | 2 |
| D | 0 | 20962 | 2 |
| Mode M9 | |||
|---|---|---|---|
| Quadrant | BADHDUFLAG | Total packets | Discarded packets |
| A | 0 | 14 | 0 |
| B | 0 | 14 | 0 |
| C | 0 | 14 | 0 |
| D | 0 | 14 | 0 |
| Quadrant | Total seconds | Saturated seconds | Saturation percentage |
|---|---|---|---|
| A | 6260 | 167 | 2.667732% |
| B | 6261 | 1309 | 20.907203% |
| C | 6261 | 107 | 1.708992% |
| D | 6261 | 770 | 12.298355% |
Noise dominated data is calculated using 1-second bins in cleaned event files. If a bin has >2000 counts, and if more than 50% of those come from <1% of pixels, then it is considered to be noise-dominated and hence unusable.
| Quadrant | # 1 sec bins | Bins with >0 counts | Bins with >2000 counts | High rate bins dominated by noise | Noise dominated (total time) | Noise dominated (detector-on time) | Marked lightcurve |
|---|---|---|---|---|---|---|---|
| A | 7580 | 6260 | 95 | 95 | 1.25% | 1.52% | 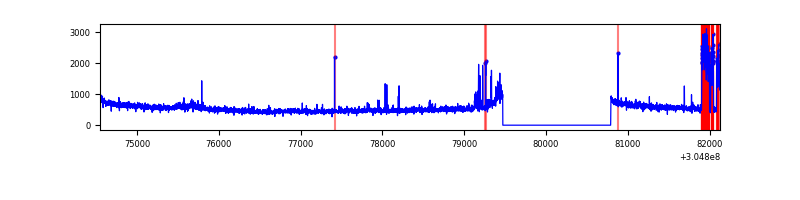 |
| B | 7581 | 6261 | 1055 | 1055 | 13.92% | 16.85% | 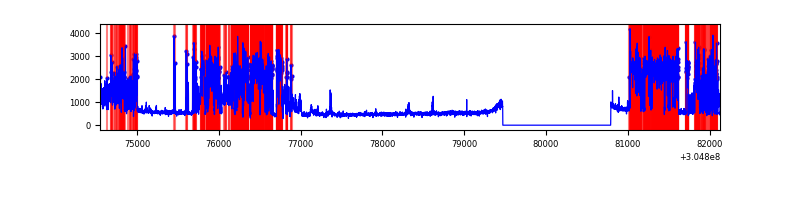 |
| C | 7581 | 6261 | 3 | 3 | 0.04% | 0.05% | 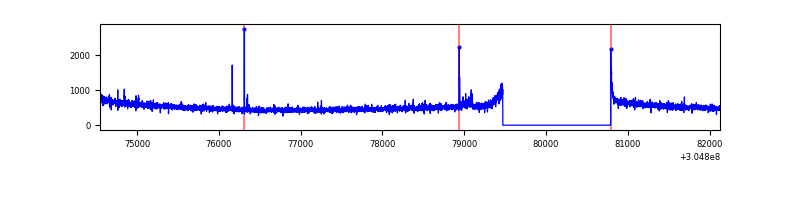 |
| D | 7581 | 6261 | 653 | 653 | 8.61% | 10.43% | 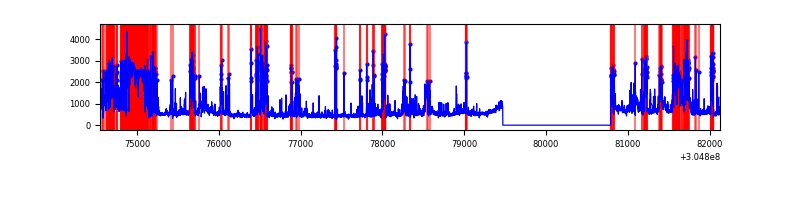 |
Top three noisy pixels from each quadrant. If the there are fewer than three noisy pixels in the level2.evt file, extra rows are filled as -1
| Pixel properties | Quadrant properties | ||||||
|---|---|---|---|---|---|---|---|
| Quadrant | DetID | PixID | Counts | Sigma | Mean | Median | Sigma |
| A | 15 | 236 | 314335 | 1862.54 | 844 | 830 | 168.3 |
| A | 5 | 16 | 59920 | 351.05 | 844 | 830 | 168.3 |
| A | 11 | 47 | 43748 | 254.97 | 844 | 830 | 168.3 |
| B | 0 | 182 | 3339894 | 22464.82 | 791 | 775 | 148.6 |
| B | 0 | 190 | 37212 | 245.14 | 791 | 775 | 148.6 |
| B | 0 | 229 | 18274 | 117.73 | 791 | 775 | 148.6 |
| C | 14 | 238 | 126262 | 684.17 | 790 | 796 | 183.4 |
| C | 3 | 233 | 36530 | 194.86 | 790 | 796 | 183.4 |
| C | 0 | 10 | 13223 | 67.76 | 790 | 796 | 183.4 |
| D | 1 | 52 | 1158172 | 6332.95 | 752 | 733 | 182.8 |
| D | 7 | 238 | 925446 | 5059.59 | 752 | 733 | 182.8 |
| D | 6 | 143 | 189771 | 1034.33 | 752 | 733 | 182.8 |
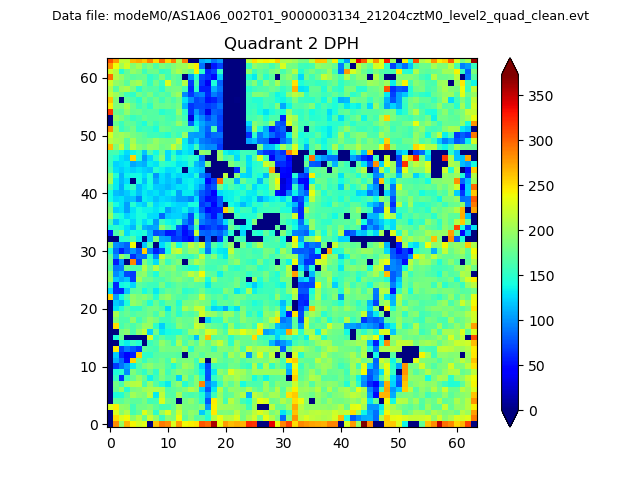
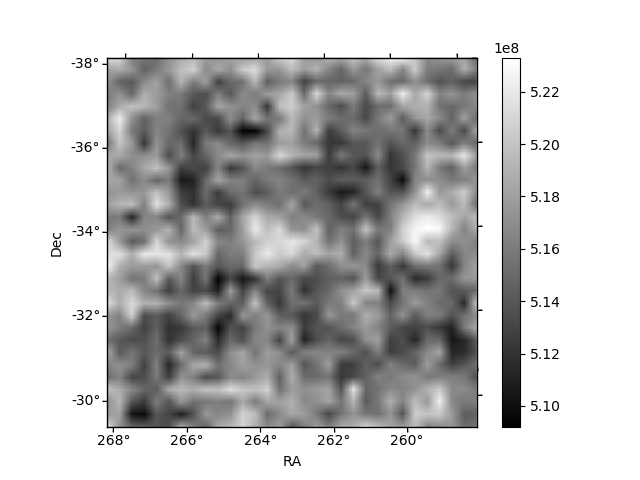
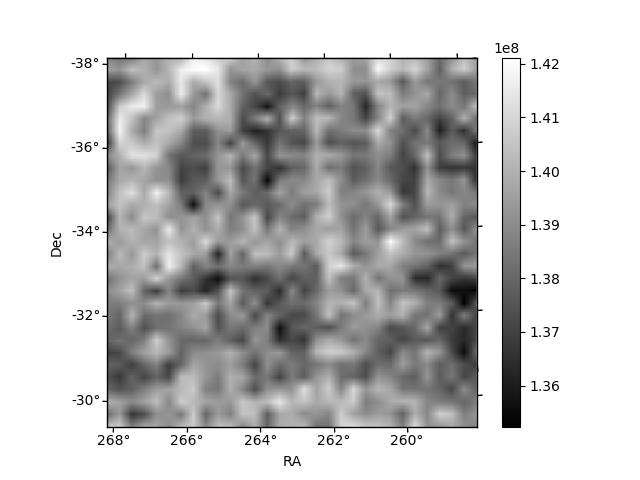
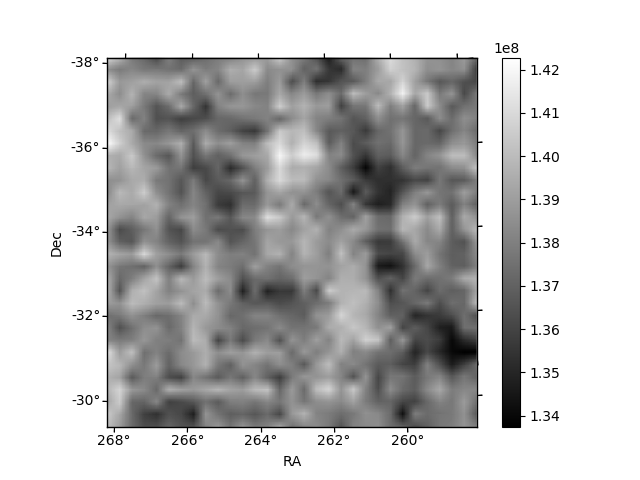
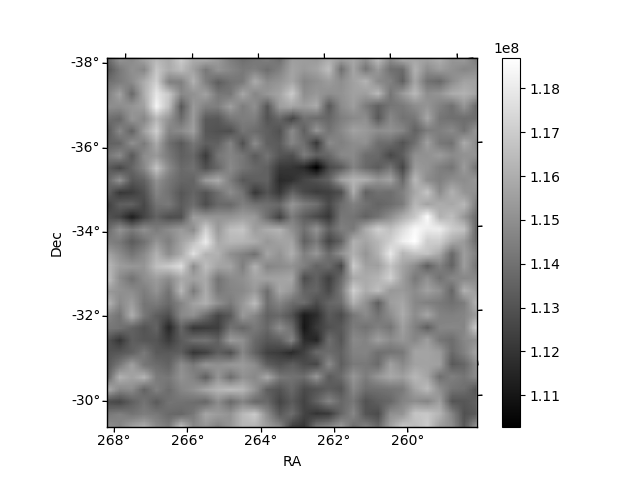
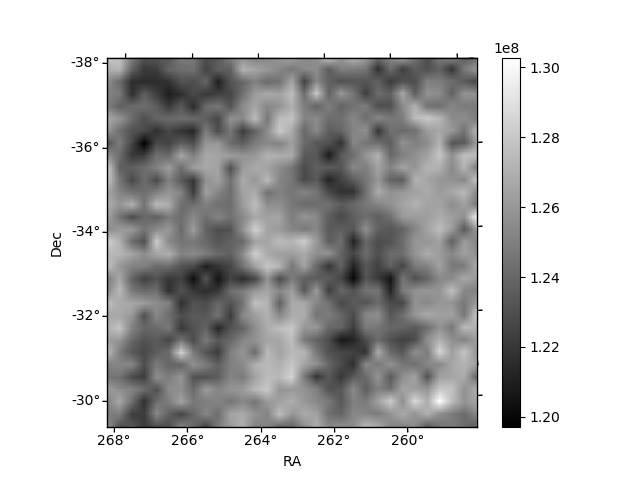
Histogram calculated using DETX and DETY for each event in the final _common_clean file
| Quadrant A | 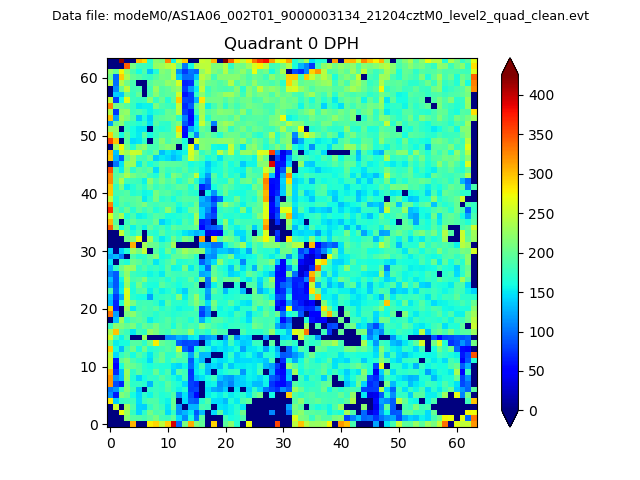 |
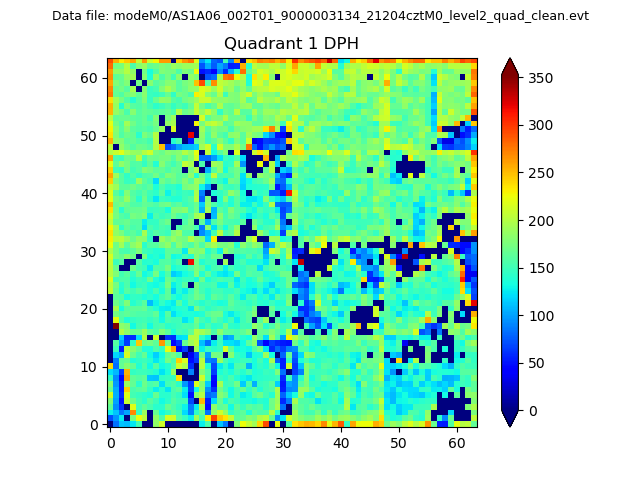 |
Quadrant B |
|---|---|---|---|
| Quadrant D | 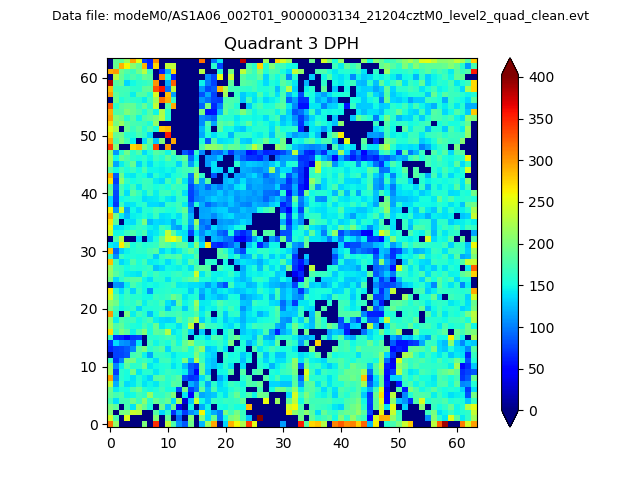 |
 |
Quadrant C |
| Plot type | Count rate plots | Images |
|---|---|---|
| Comparison with Poisson distribution Blue bars denote a histogram of data divided into 1 sec bins. Red curve is a Poisson curve with rate = median count rate of data. |
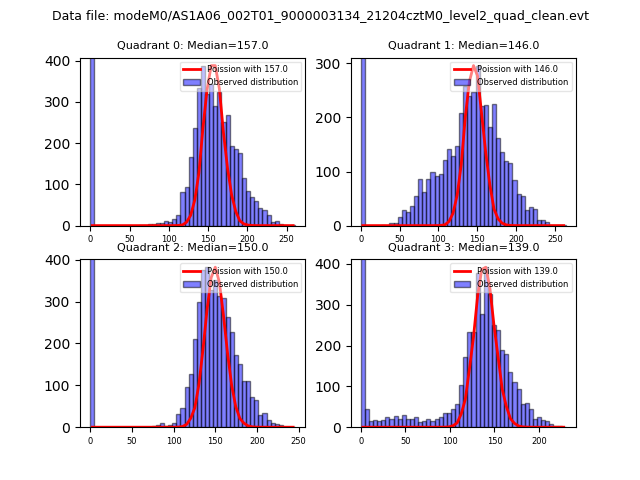 |
 |
| Quadrant-wise count rates Data is divided into 100 sec bins |
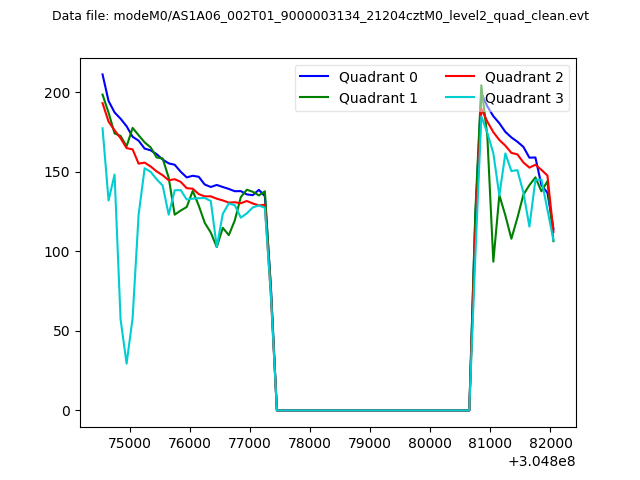 |
|
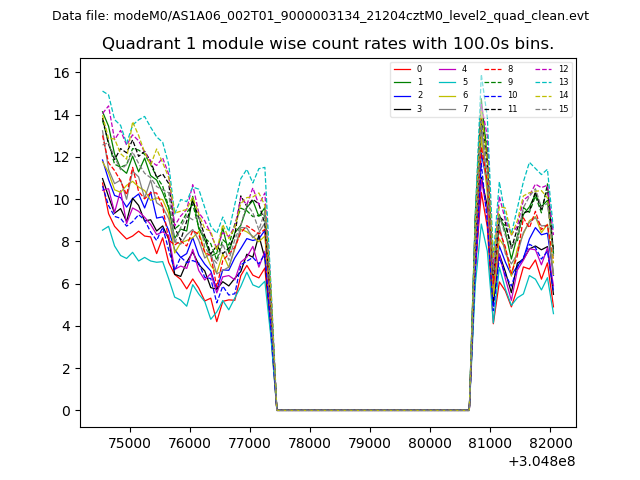
| Module-wise count rates for Quadrant A Data is divided into 100 sec bins |
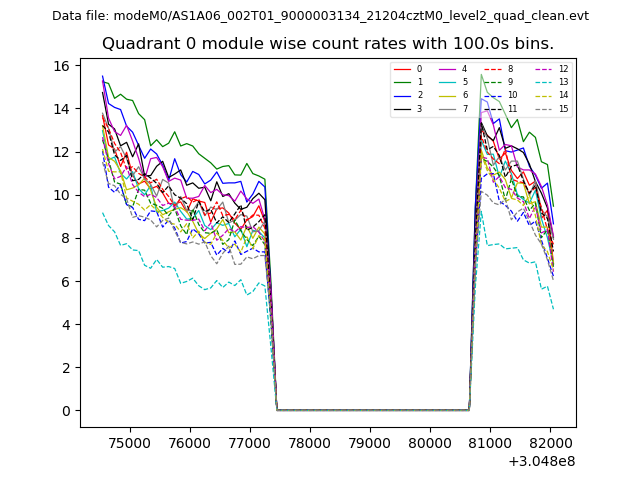 |
 |
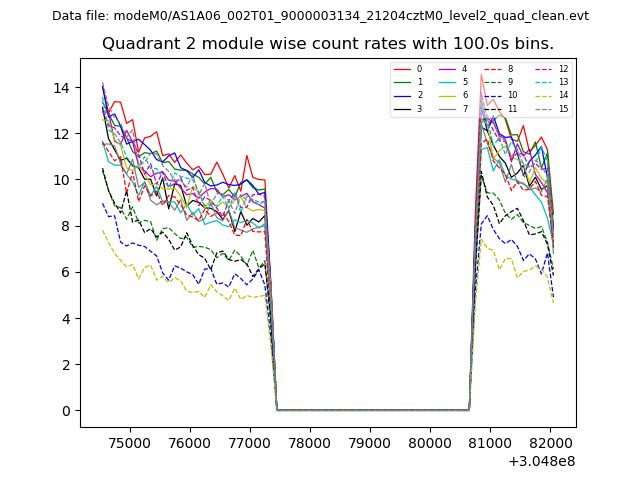
| Module-wise count rates for Quadrant B Data is divided into 100 sec bins |
 |
 |
| Module-wise count rates for Quadrant C Data is divided into 100 sec bins |
 |
 |
| Module-wise count rates for Quadrant D Data is divided into 100 sec bins |
 |
 |
| Parameter | Plot |
|---|---|
| CZT HV Monitor | 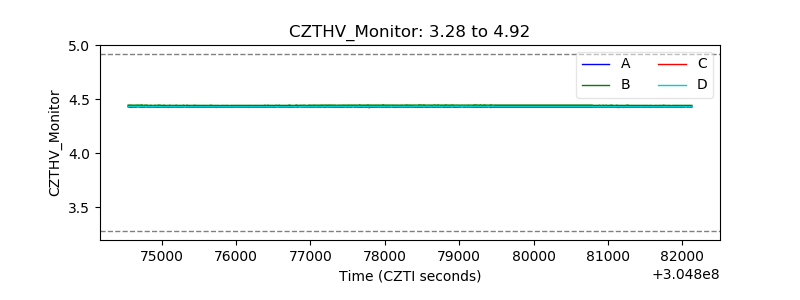 |
| D_VDD | 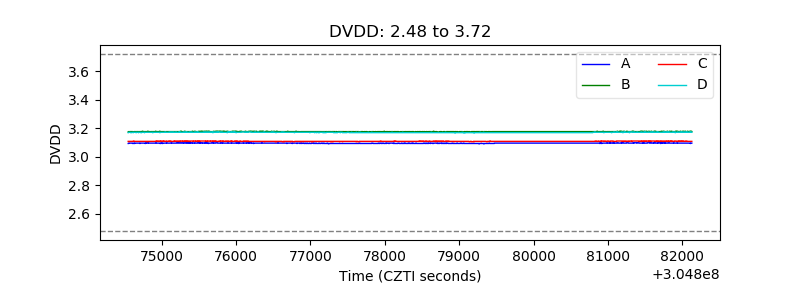 |
| Temperature 1 | 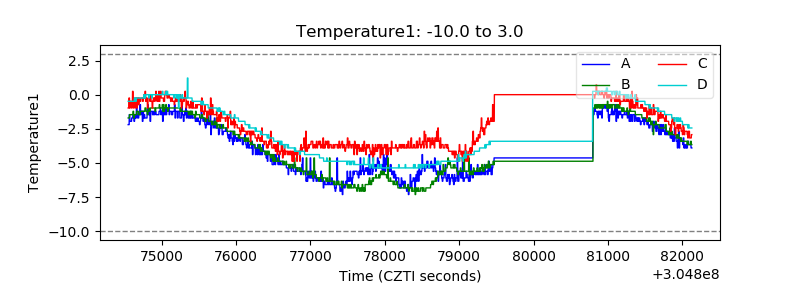 |
| Veto HV Monitor | 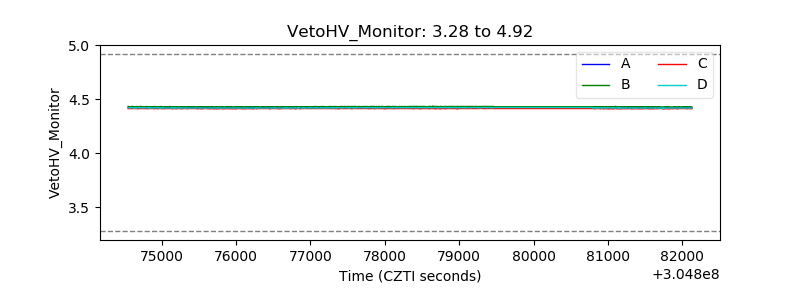 |
| Veto LLD | 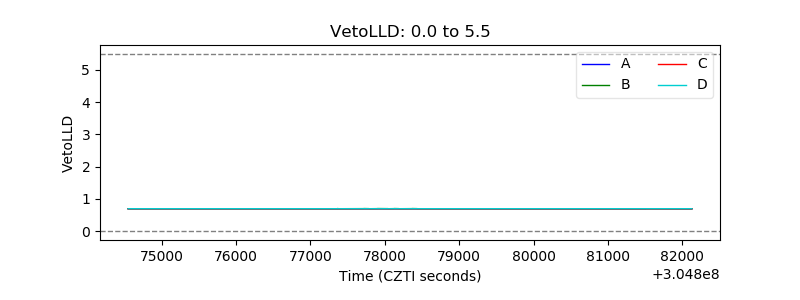 |
| Alpha Counter | 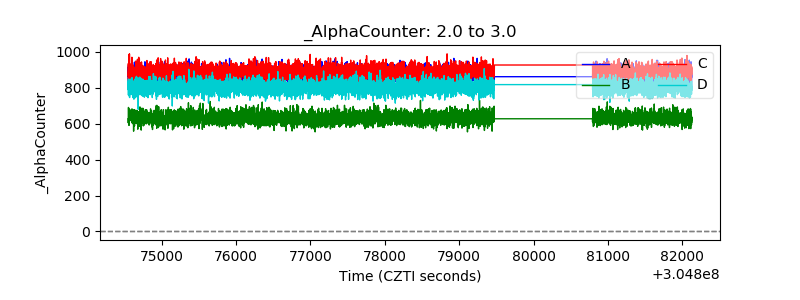 |
| _CPM_Rate | 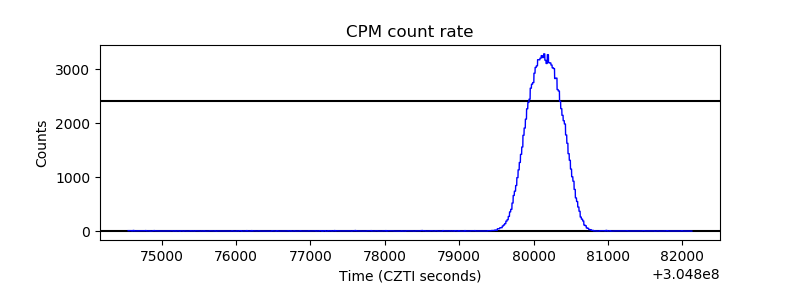 |
| CZT Counter | 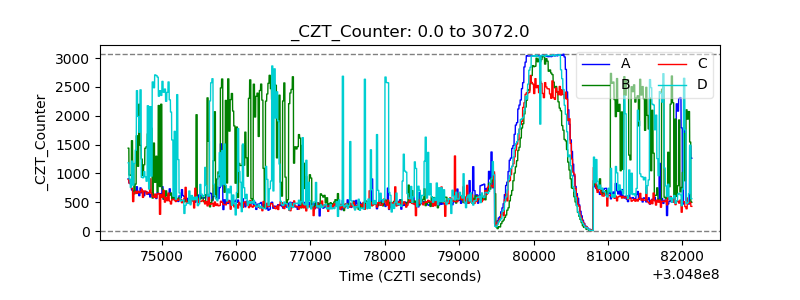 |
| +2.5 Volts monitor |  |
| +5 Volts monitor |  |
| _ROLL_ROT | 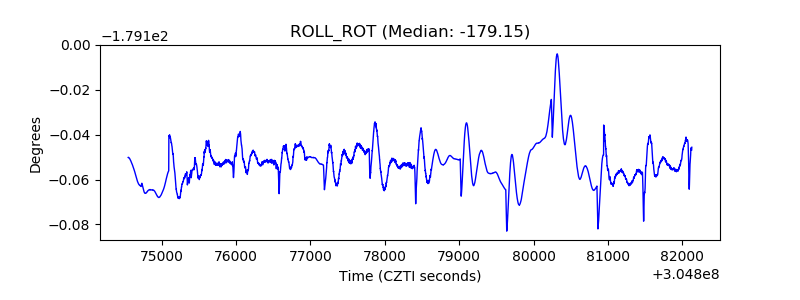 |
| _Roll_DEC | 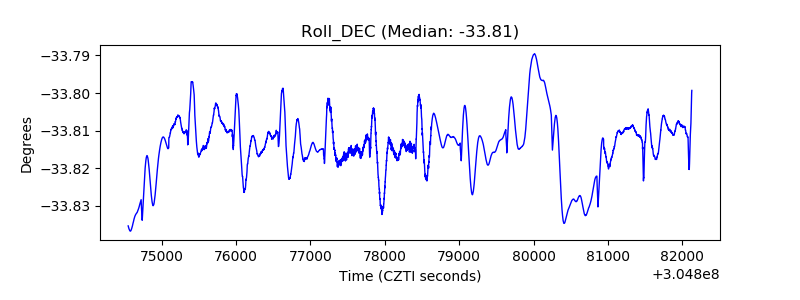 |
| _Roll_RA | 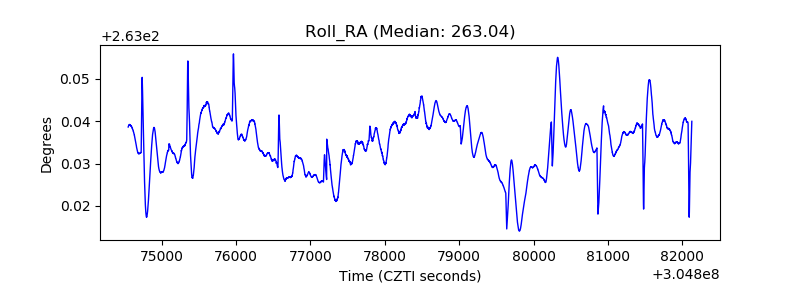 |
| Veto Counter | 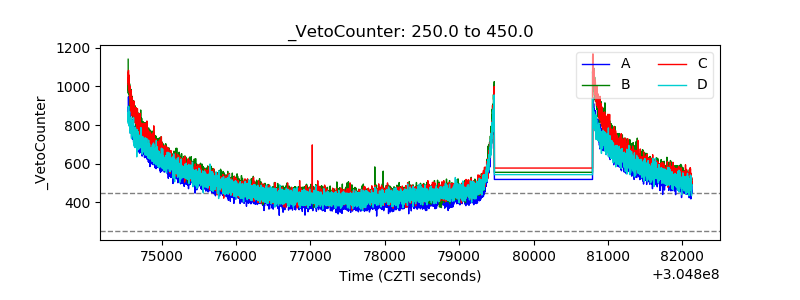 |