| Param | Original file | Final file |
|---|---|---|
| Filename | modeM0/AS1A06_002T01_9000003134_21205cztM0_level2.evt | modeM0/AS1A06_002T01_9000003134_21205cztM0_level2_quad_clean.evt |
| Size (bytes) | 773,058,240 | 86,016,960 |
| Size | 737.2 MB | 82.0 MB |
| Events in quadrant A | 9,623,727 | 424,736 |
| Events in quadrant B | 4,976,936 | 593,075 |
| Events in quadrant C | 3,262,879 | 604,270 |
| Events in quadrant D | 5,138,535 | 557,340 |
| Mode SS | |||
|---|---|---|---|
| Quadrant | BADHDUFLAG | Total packets | Discarded packets |
| A | 0 | 122 | 0 |
| B | 0 | 122 | 0 |
| C | 0 | 122 | 0 |
| D | 0 | 122 | 0 |
| Mode M0 | |||
|---|---|---|---|
| Quadrant | BADHDUFLAG | Total packets | Discarded packets |
| A | 0 | 32725 | 2 |
| B | 0 | 18770 | 2 |
| C | 0 | 13450 | 2 |
| D | 0 | 19364 | 3 |
| Mode M9 | |||
|---|---|---|---|
| Quadrant | BADHDUFLAG | Total packets | Discarded packets |
| A | 0 | 18 | 0 |
| B | 0 | 19 | 0 |
| C | 0 | 19 | 0 |
| D | 0 | 19 | 0 |
| Quadrant | Total seconds | Saturated seconds | Saturation percentage |
|---|---|---|---|
| A | 6080 | 2574 | 42.335526% |
| B | 6080 | 757 | 12.450658% |
| C | 6080 | 110 | 1.809211% |
| D | 6079 | 404 | 6.645830% |
Noise dominated data is calculated using 1-second bins in cleaned event files. If a bin has >2000 counts, and if more than 50% of those come from <1% of pixels, then it is considered to be noise-dominated and hence unusable.
| Quadrant | # 1 sec bins | Bins with >0 counts | Bins with >2000 counts | High rate bins dominated by noise | Noise dominated (total time) | Noise dominated (detector-on time) | Marked lightcurve |
|---|---|---|---|---|---|---|---|
| A | 7460 | 6080 | 2511 | 2511 | 33.66% | 41.30% | 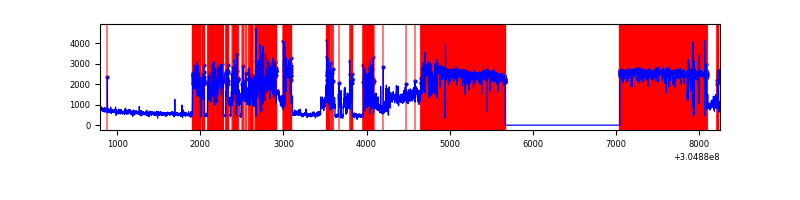 |
| B | 7460 | 6081 | 603 | 603 | 8.08% | 9.92% | 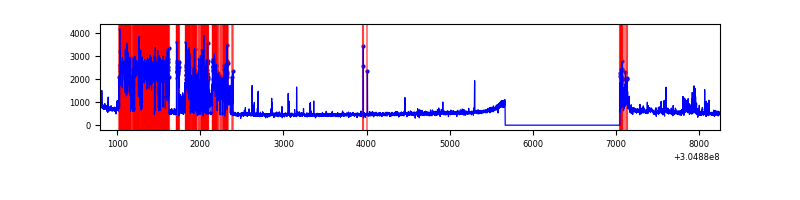 |
| C | 7460 | 6081 | 9 | 9 | 0.12% | 0.15% | 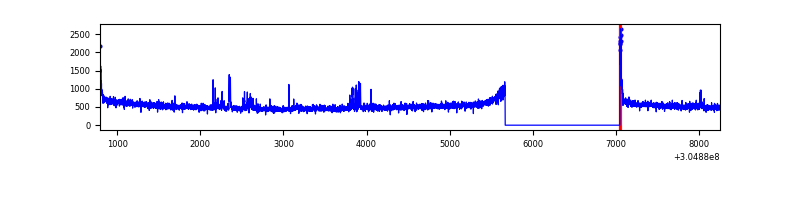 |
| D | 7459 | 6080 | 396 | 396 | 5.31% | 6.51% | 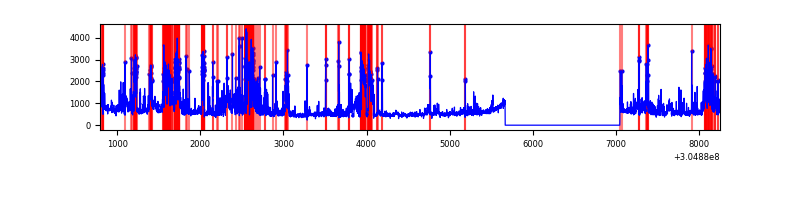 |
Top three noisy pixels from each quadrant. If the there are fewer than three noisy pixels in the level2.evt file, extra rows are filled as -1
| Pixel properties | Quadrant properties | ||||||
|---|---|---|---|---|---|---|---|
| Quadrant | DetID | PixID | Counts | Sigma | Mean | Median | Sigma |
| A | 15 | 236 | 7275183 | 62509.49 | 582 | 571 | 116.4 |
| A | 11 | 47 | 89946 | 767.98 | 582 | 571 | 116.4 |
| A | 10 | 229 | 19035 | 158.65 | 582 | 571 | 116.4 |
| B | 0 | 182 | 1805377 | 12331.9 | 780 | 763 | 146.3 |
| B | 0 | 230 | 27710 | 184.14 | 780 | 763 | 146.3 |
| B | 0 | 229 | 25589 | 169.65 | 780 | 763 | 146.3 |
| C | 14 | 238 | 121581 | 681.69 | 765 | 772 | 177.2 |
| C | 3 | 233 | 105421 | 590.5 | 765 | 772 | 177.2 |
| C | 0 | 10 | 45854 | 254.38 | 765 | 772 | 177.2 |
| D | 7 | 238 | 1094116 | 5919.9 | 757 | 735 | 184.7 |
| D | 1 | 52 | 431855 | 2334.21 | 757 | 735 | 184.7 |
| D | 15 | 0 | 211853 | 1143.06 | 757 | 735 | 184.7 |
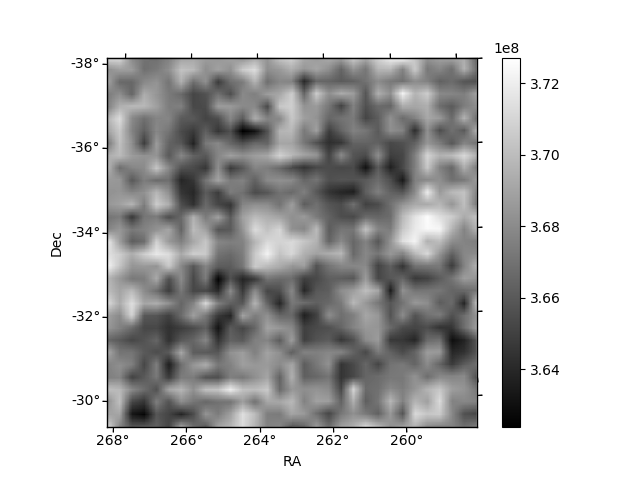
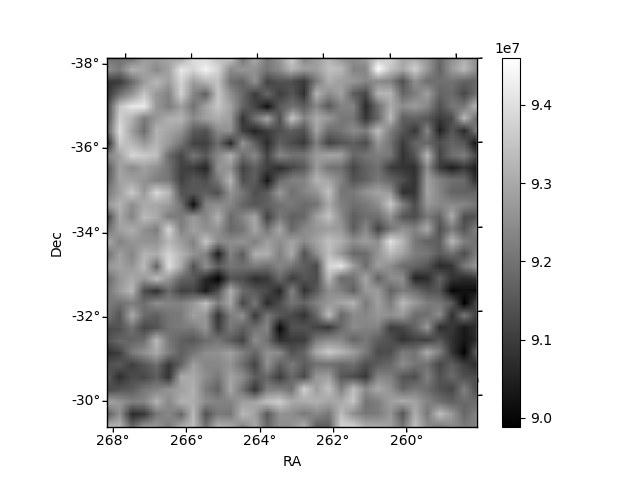
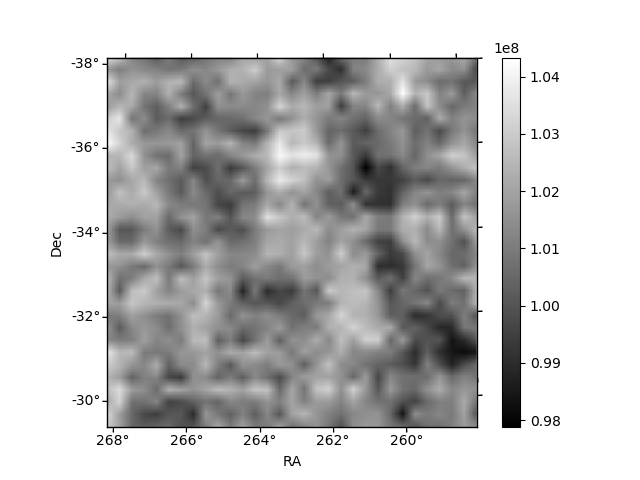
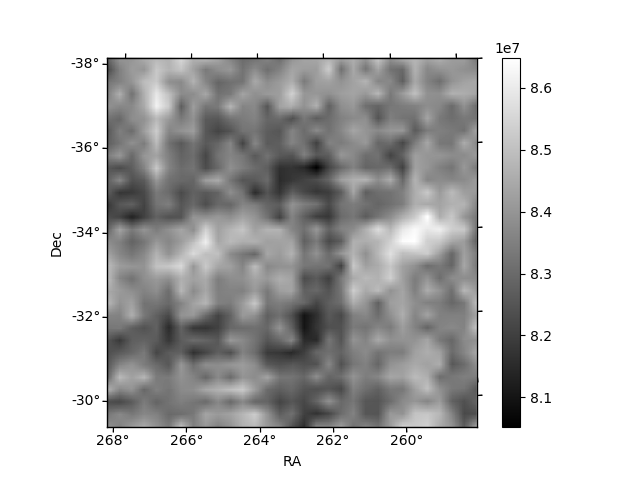
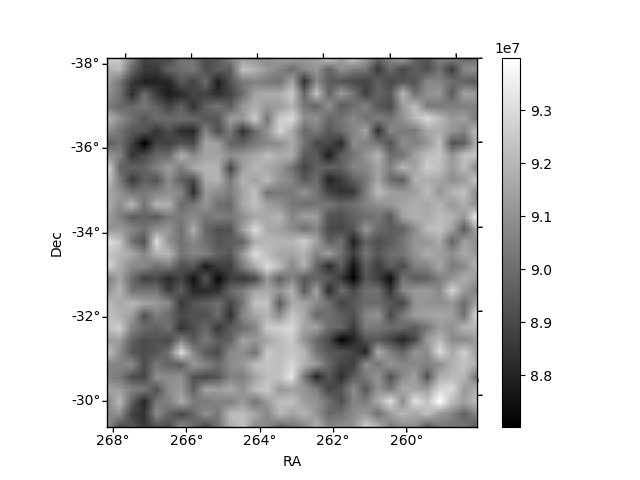
Histogram calculated using DETX and DETY for each event in the final _common_clean file
| Quadrant A | 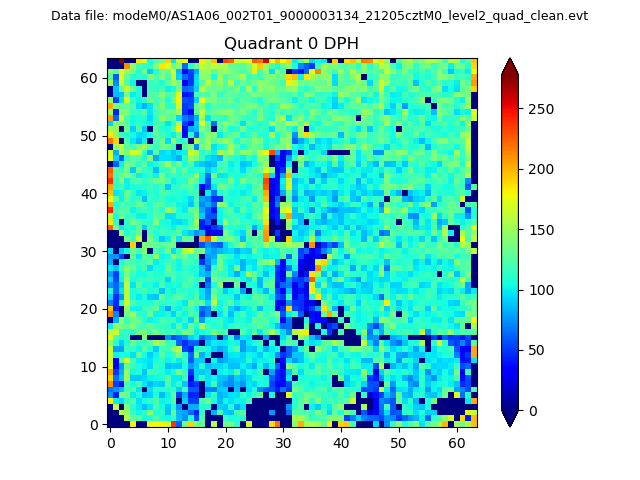 |
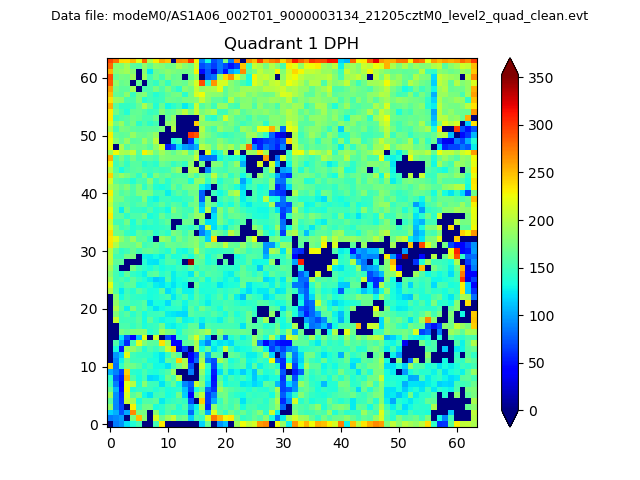 |
Quadrant B |
|---|---|---|---|
| Quadrant D | 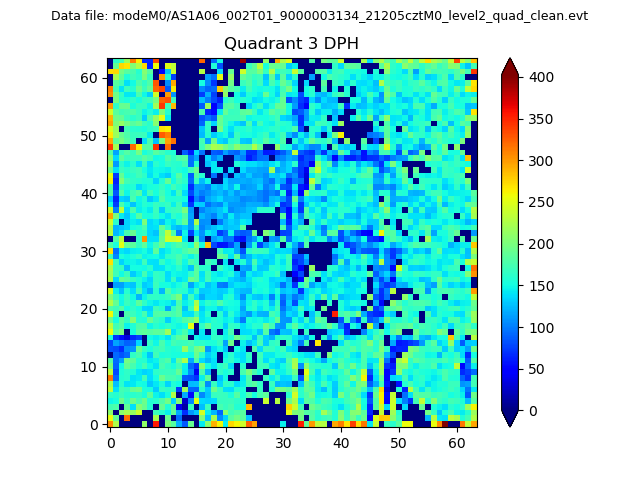 |
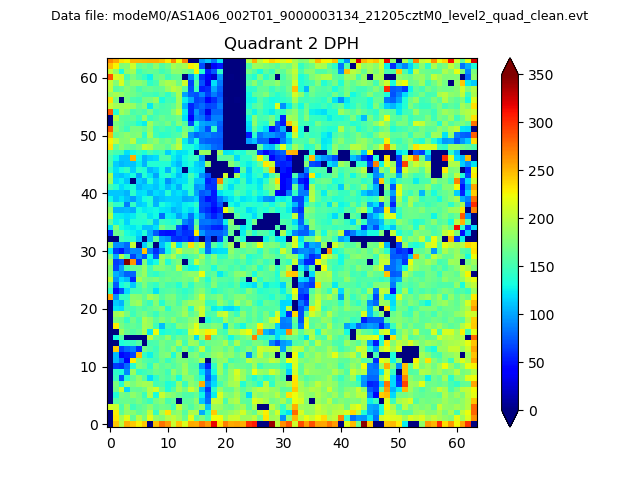 |
Quadrant C |
| Plot type | Count rate plots | Images |
|---|---|---|
| Comparison with Poisson distribution Blue bars denote a histogram of data divided into 1 sec bins. Red curve is a Poisson curve with rate = median count rate of data. |
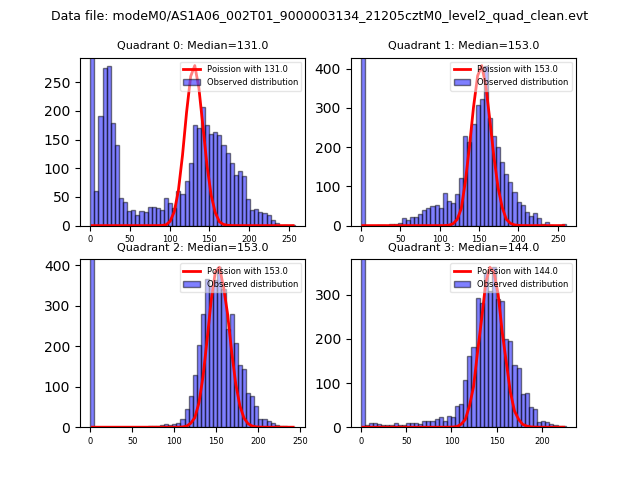 |
 |
| Quadrant-wise count rates Data is divided into 100 sec bins |
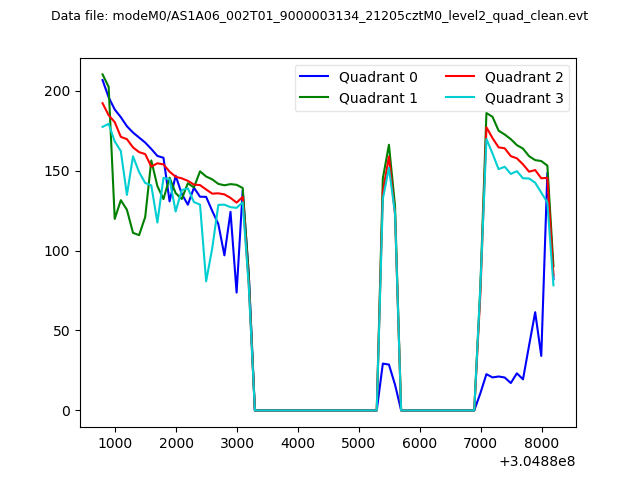 |
|
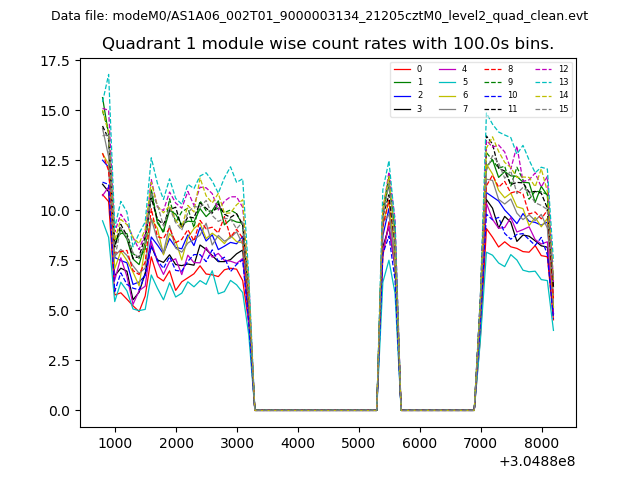
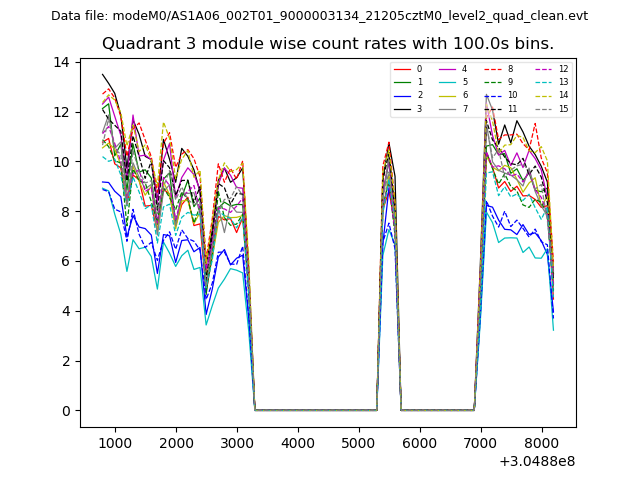
| Module-wise count rates for Quadrant A Data is divided into 100 sec bins |
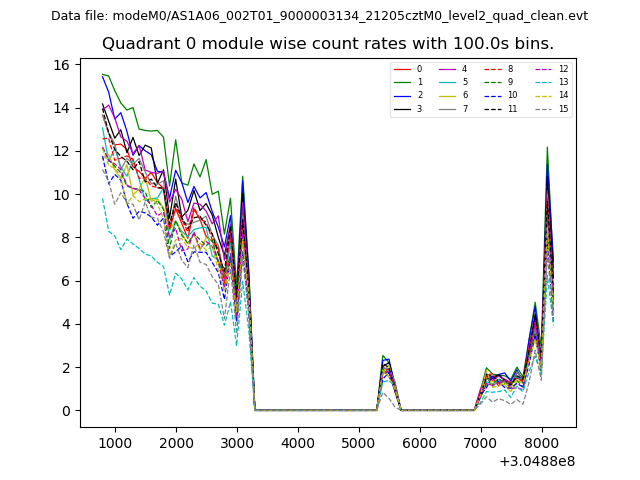 |
 |
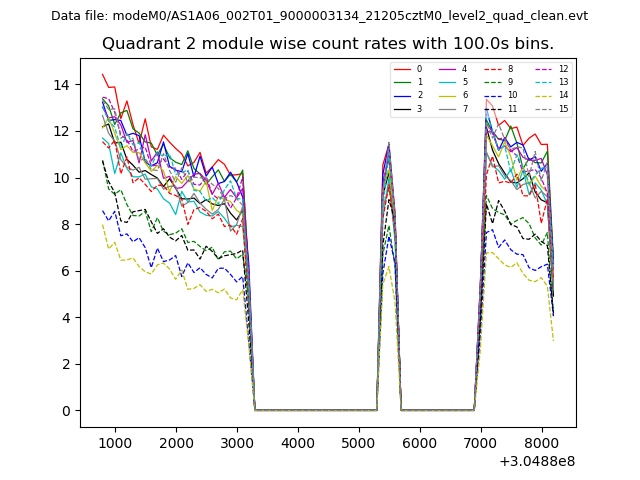
| Module-wise count rates for Quadrant B Data is divided into 100 sec bins |
 |
 |
| Module-wise count rates for Quadrant C Data is divided into 100 sec bins |
 |
 |
| Module-wise count rates for Quadrant D Data is divided into 100 sec bins |
 |
 |
| Parameter | Plot |
|---|---|
| CZT HV Monitor | 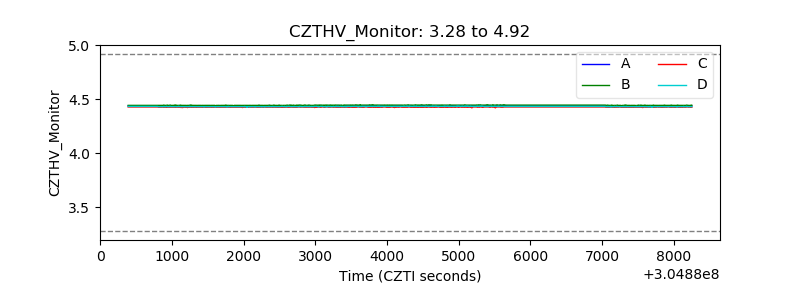 |
| D_VDD | 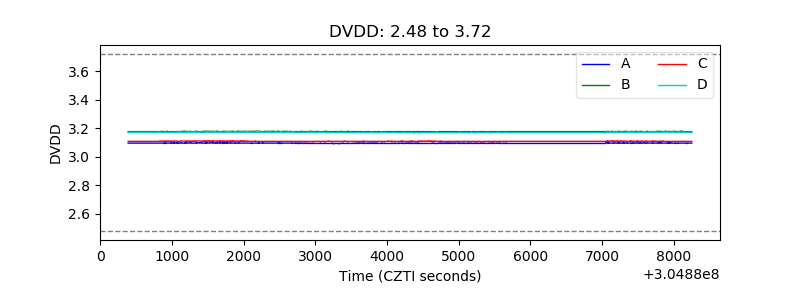 |
| Temperature 1 | 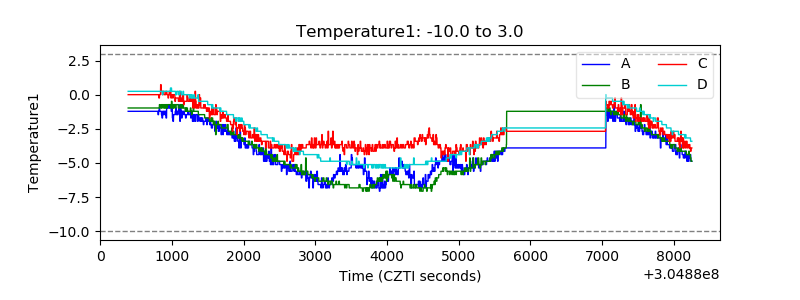 |
| Veto HV Monitor |  |
| Veto LLD | 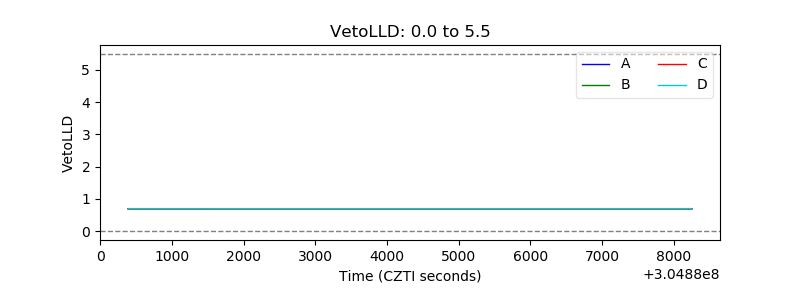 |
| Alpha Counter | 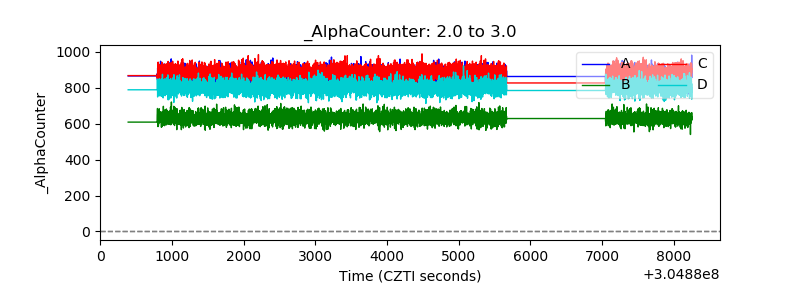 |
| _CPM_Rate | 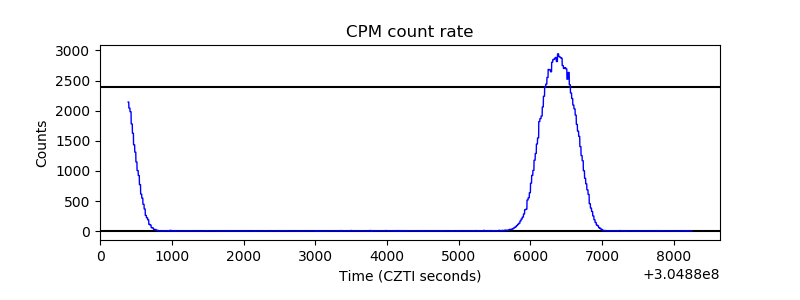 |
| CZT Counter | 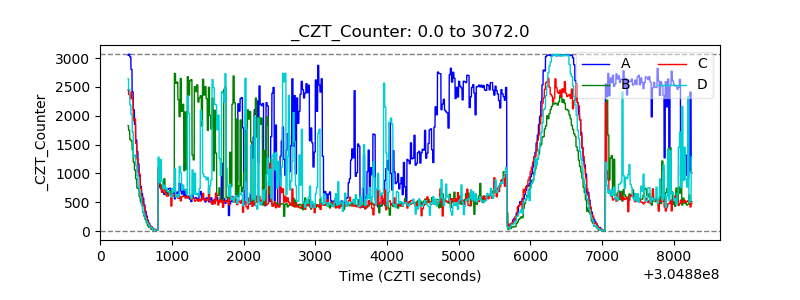 |
| +2.5 Volts monitor |  |
| +5 Volts monitor |  |
| _ROLL_ROT | 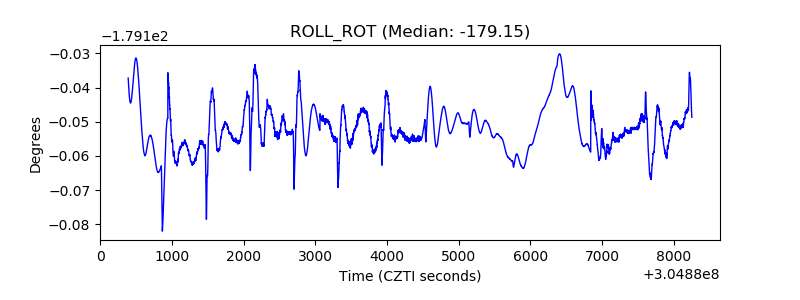 |
| _Roll_DEC | 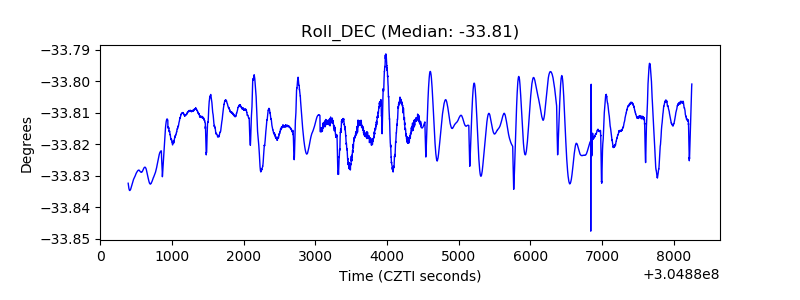 |
| _Roll_RA | 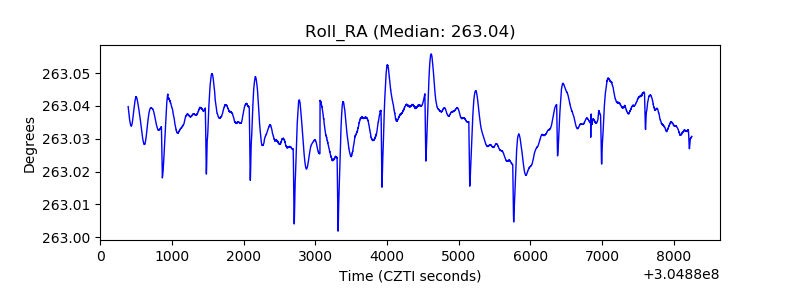 |
| Veto Counter | 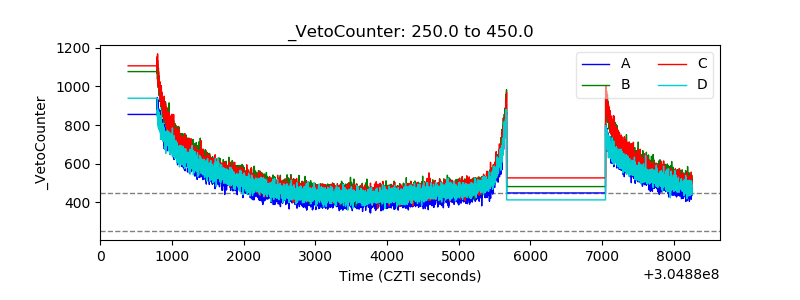 |