| Param | Original file | Final file |
|---|---|---|
| Filename | modeM0/AS1A06_002T01_9000003134_21206cztM0_level2.evt | modeM0/AS1A06_002T01_9000003134_21206cztM0_level2_quad_clean.evt |
| Size (bytes) | 737,582,400 | 85,415,040 |
| Size | 703.4 MB | 81.5 MB |
| Events in quadrant A | 7,833,982 | 402,881 |
| Events in quadrant B | 3,886,197 | 612,620 |
| Events in quadrant C | 3,142,174 | 588,364 |
| Events in quadrant D | 7,061,362 | 553,857 |
| Mode SS | |||
|---|---|---|---|
| Quadrant | BADHDUFLAG | Total packets | Discarded packets |
| A | 0 | 126 | 0 |
| B | 0 | 126 | 0 |
| C | 0 | 126 | 0 |
| D | 0 | 126 | 0 |
| Mode M0 | |||
|---|---|---|---|
| Quadrant | BADHDUFLAG | Total packets | Discarded packets |
| A | 0 | 27341 | 2 |
| B | 0 | 15486 | 2 |
| C | 0 | 13136 | 2 |
| D | 0 | 25226 | 2 |
| Mode M9 | |||
|---|---|---|---|
| Quadrant | BADHDUFLAG | Total packets | Discarded packets |
| A | 0 | 15 | 0 |
| B | 0 | 16 | 0 |
| C | 0 | 16 | 0 |
| D | 0 | 16 | 0 |
| Quadrant | Total seconds | Saturated seconds | Saturation percentage |
|---|---|---|---|
| A | 6125 | 1873 | 30.579592% |
| B | 6125 | 264 | 4.310204% |
| C | 6124 | 104 | 1.698236% |
| D | 6124 | 1182 | 19.301110% |
Noise dominated data is calculated using 1-second bins in cleaned event files. If a bin has >2000 counts, and if more than 50% of those come from <1% of pixels, then it is considered to be noise-dominated and hence unusable.
| Quadrant | # 1 sec bins | Bins with >0 counts | Bins with >2000 counts | High rate bins dominated by noise | Noise dominated (total time) | Noise dominated (detector-on time) | Marked lightcurve |
|---|---|---|---|---|---|---|---|
| A | 7465 | 6126 | 1684 | 1684 | 22.56% | 27.49% | 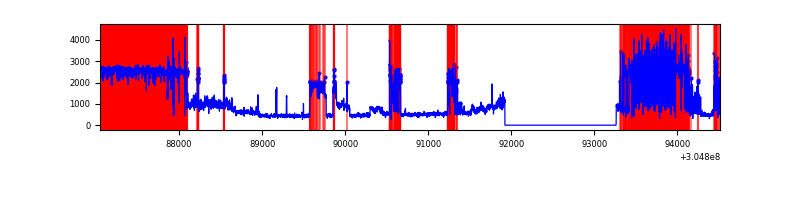 |
| B | 7465 | 6126 | 174 | 174 | 2.33% | 2.84% | 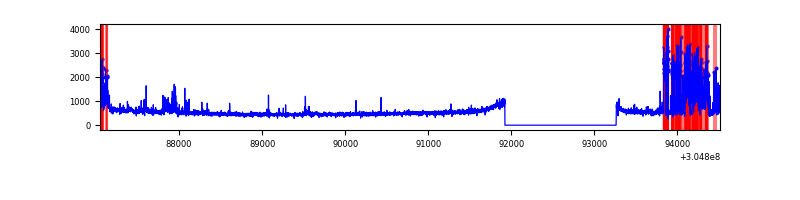 |
| C | 7464 | 6125 | 12 | 12 | 0.16% | 0.20% |  |
| D | 7464 | 6125 | 1132 | 1132 | 15.17% | 18.48% | 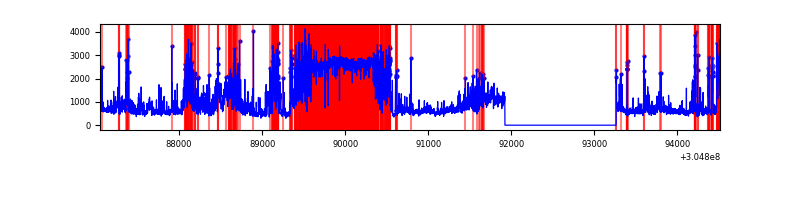 |
Top three noisy pixels from each quadrant. If the there are fewer than three noisy pixels in the level2.evt file, extra rows are filled as -1
| Pixel properties | Quadrant properties | ||||||
|---|---|---|---|---|---|---|---|
| Quadrant | DetID | PixID | Counts | Sigma | Mean | Median | Sigma |
| A | 15 | 236 | 5349393 | 42078.65 | 635 | 624 | 127.1 |
| A | 11 | 47 | 27429 | 210.87 | 635 | 624 | 127.1 |
| A | 5 | 16 | 9144 | 67.03 | 635 | 624 | 127.1 |
| B | 0 | 182 | 719801 | 4802.8 | 791 | 772 | 149.7 |
| B | 15 | 35 | 25807 | 167.22 | 791 | 772 | 149.7 |
| B | 0 | 230 | 23689 | 153.08 | 791 | 772 | 149.7 |
| C | 14 | 238 | 120022 | 680.05 | 754 | 759 | 175.4 |
| C | 0 | 10 | 57699 | 324.68 | 754 | 759 | 175.4 |
| C | 0 | 207 | 12491 | 66.9 | 754 | 759 | 175.4 |
| D | 7 | 238 | 3901721 | 23505.68 | 677 | 657 | 166.0 |
| D | 1 | 52 | 126541 | 758.51 | 677 | 657 | 166.0 |
| D | 15 | 145 | 120240 | 720.54 | 677 | 657 | 166.0 |
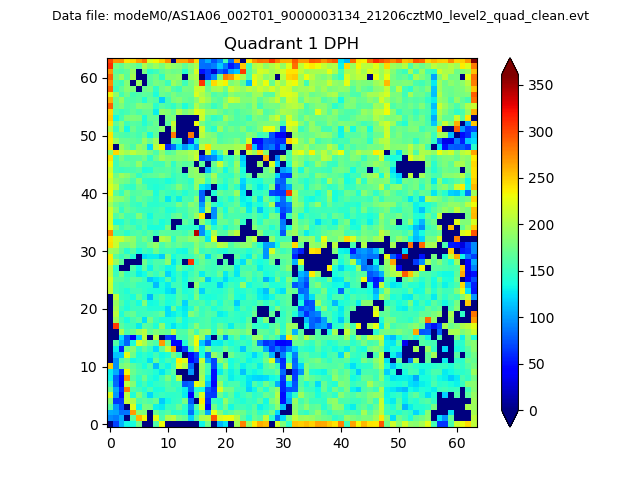
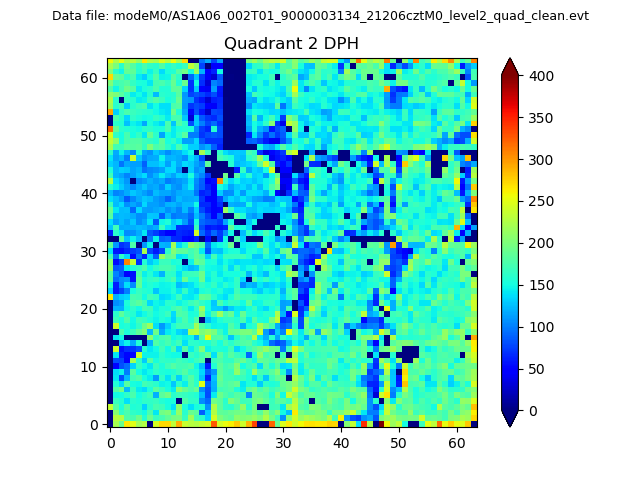
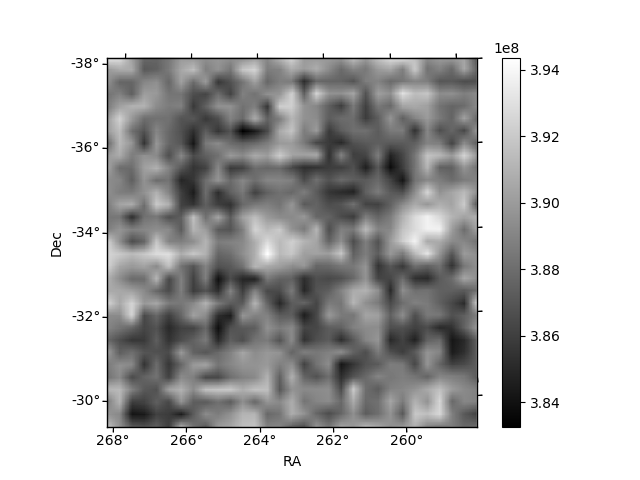
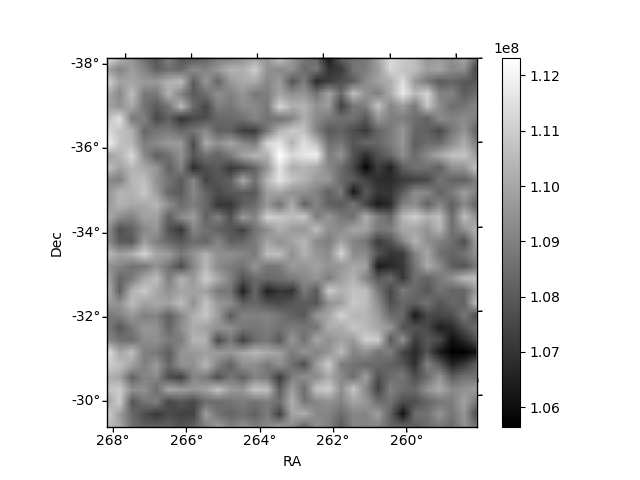
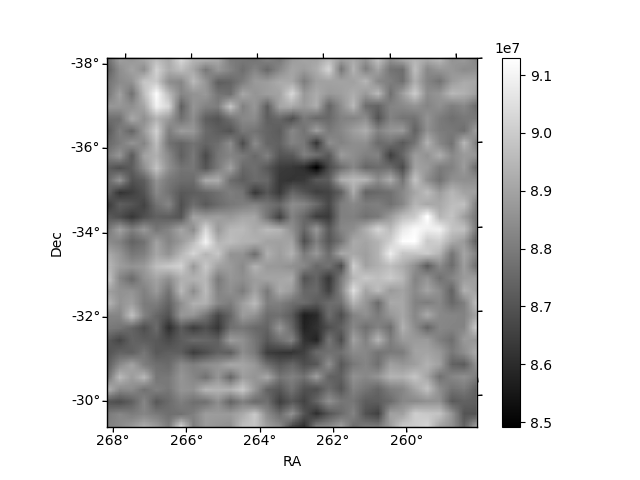
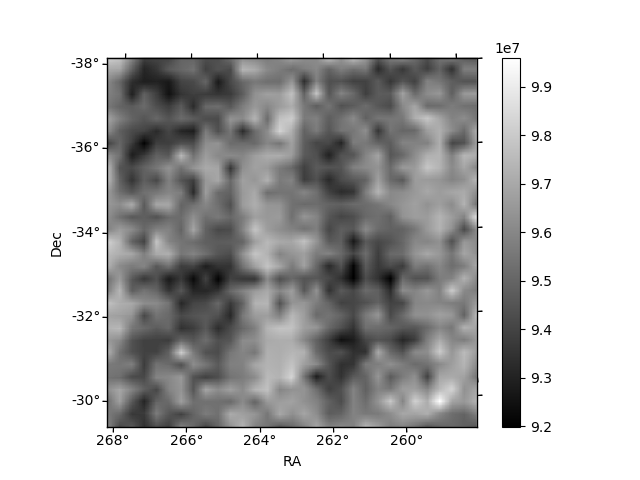
Histogram calculated using DETX and DETY for each event in the final _common_clean file
| Quadrant A | 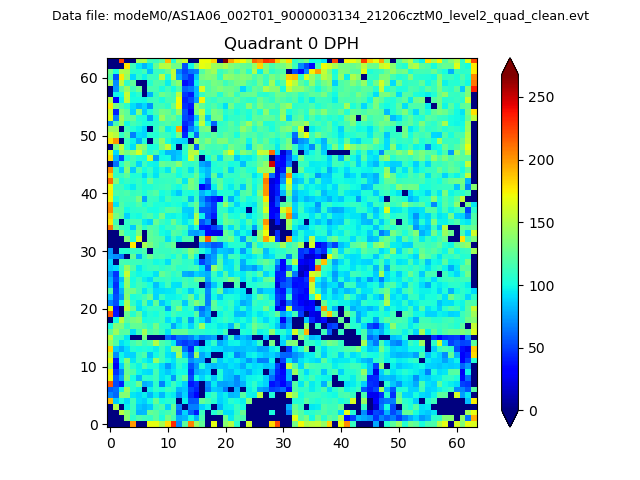 |
 |
Quadrant B |
|---|---|---|---|
| Quadrant D | 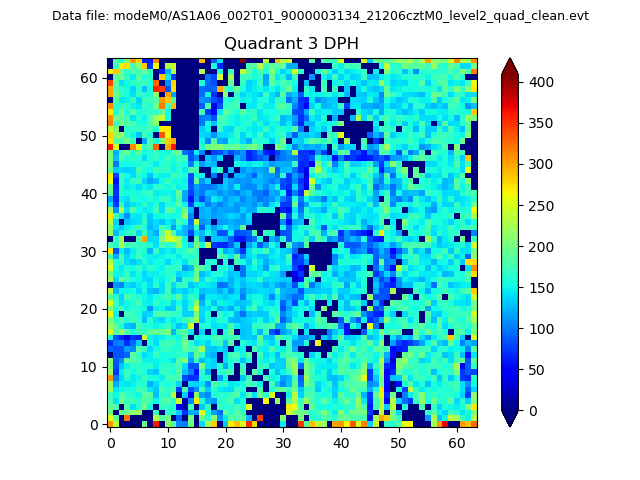 |
 |
Quadrant C |
| Plot type | Count rate plots | Images |
|---|---|---|
| Comparison with Poisson distribution Blue bars denote a histogram of data divided into 1 sec bins. Red curve is a Poisson curve with rate = median count rate of data. |
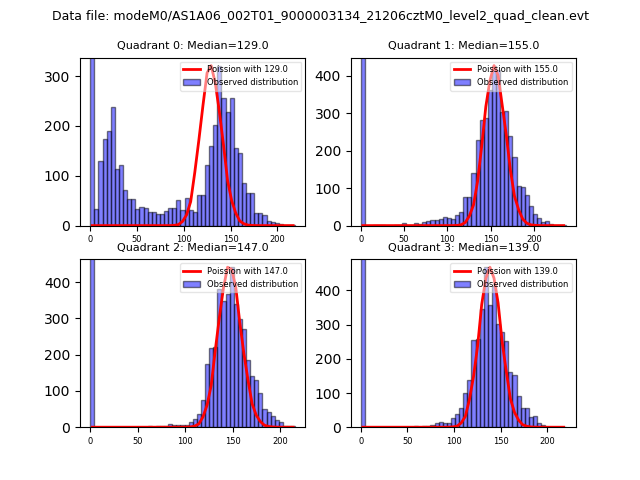 |
 |
| Quadrant-wise count rates Data is divided into 100 sec bins |
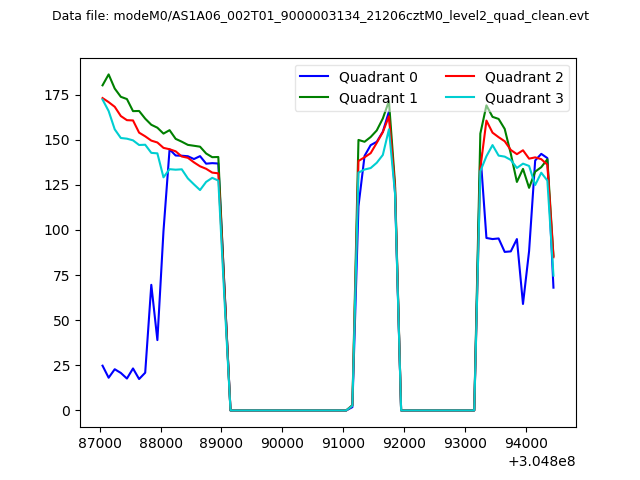 |
|
| Module-wise count rates for Quadrant A Data is divided into 100 sec bins |
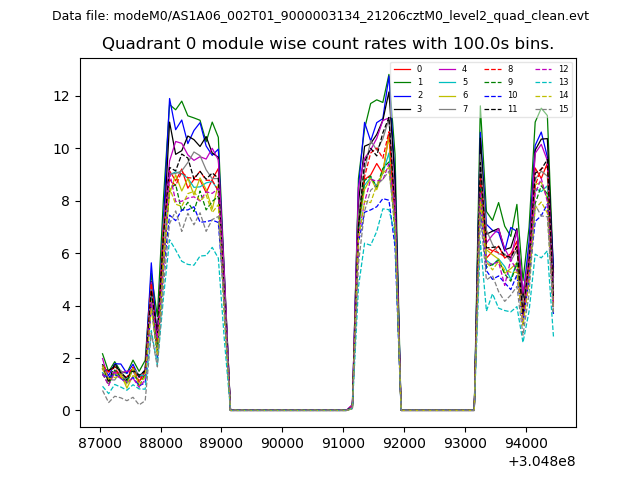 |
 |
| Module-wise count rates for Quadrant B Data is divided into 100 sec bins |
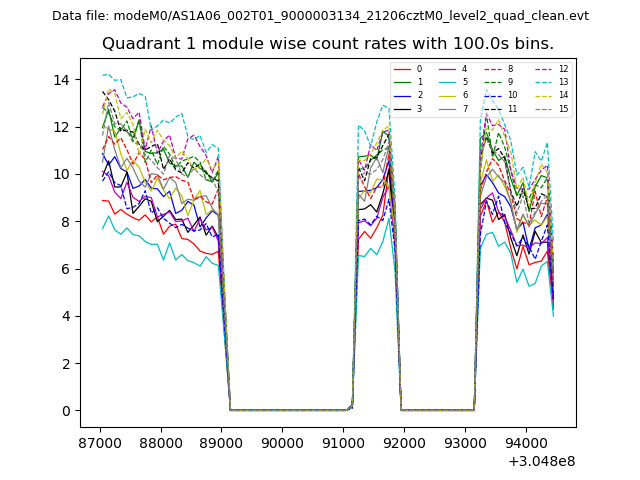 |
 |
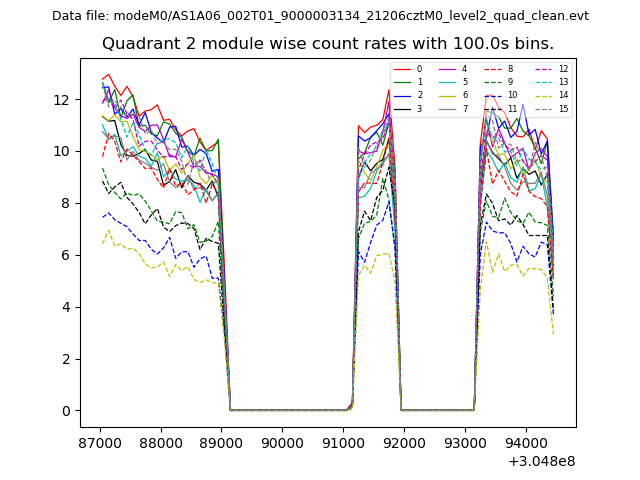
| Module-wise count rates for Quadrant C Data is divided into 100 sec bins |
 |
 |
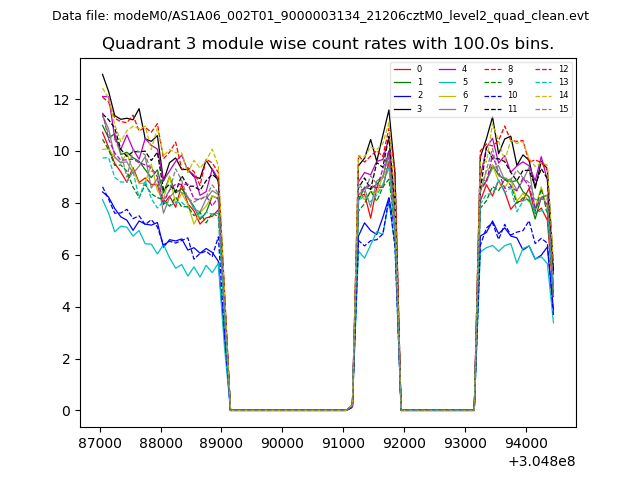
| Module-wise count rates for Quadrant D Data is divided into 100 sec bins |
 |
 |
| Parameter | Plot |
|---|---|
| CZT HV Monitor | 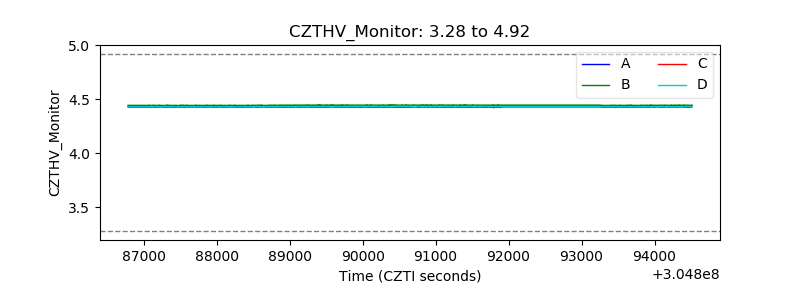 |
| D_VDD | 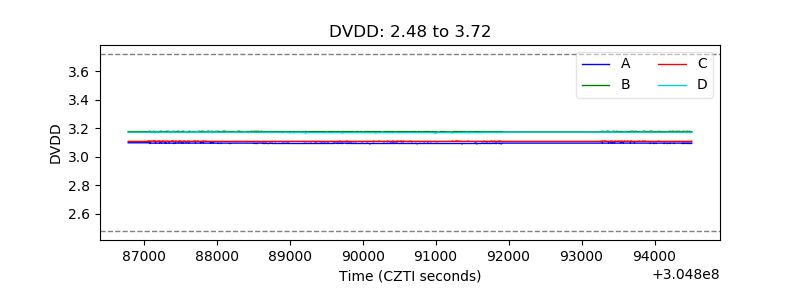 |
| Temperature 1 | 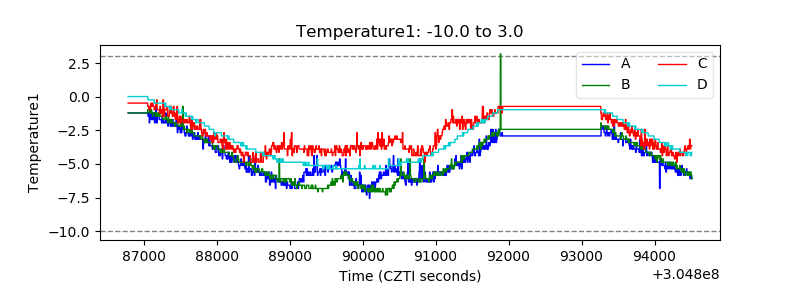 |
| Veto HV Monitor |  |
| Veto LLD | 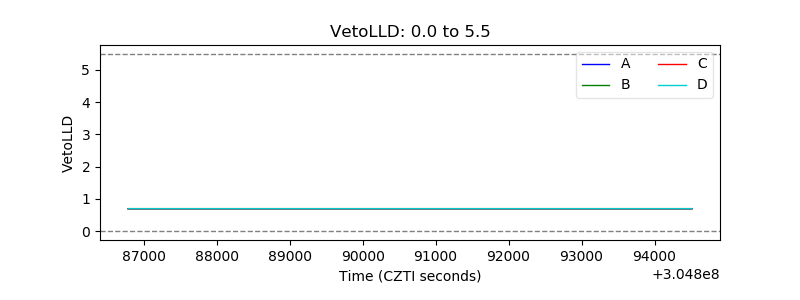 |
| Alpha Counter | 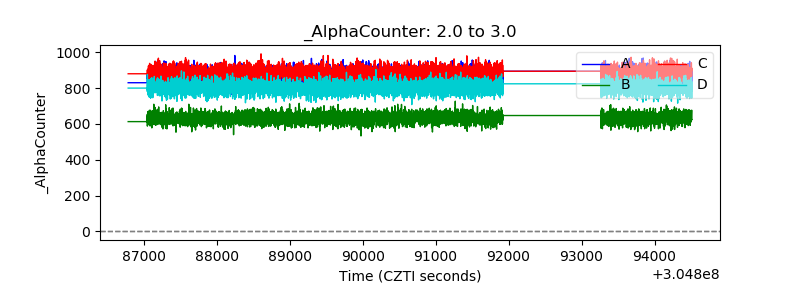 |
| _CPM_Rate | 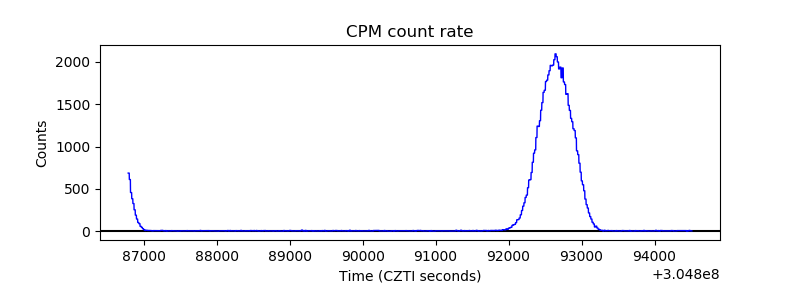 |
| CZT Counter | 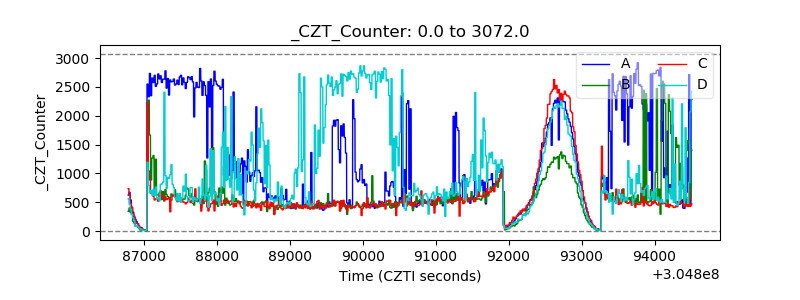 |
| +2.5 Volts monitor |  |
| +5 Volts monitor |  |
| _ROLL_ROT | 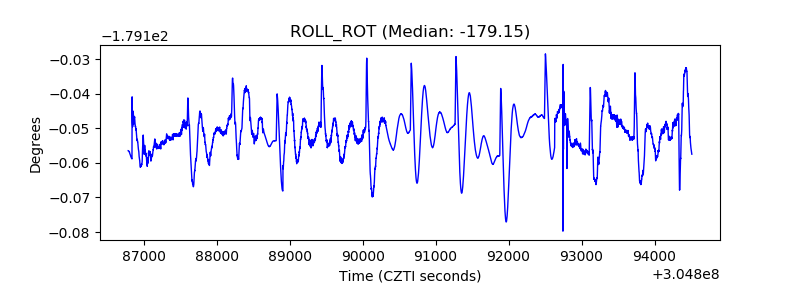 |
| _Roll_DEC | 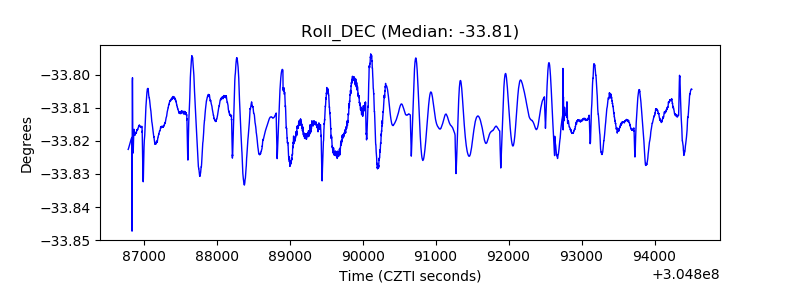 |
| _Roll_RA | 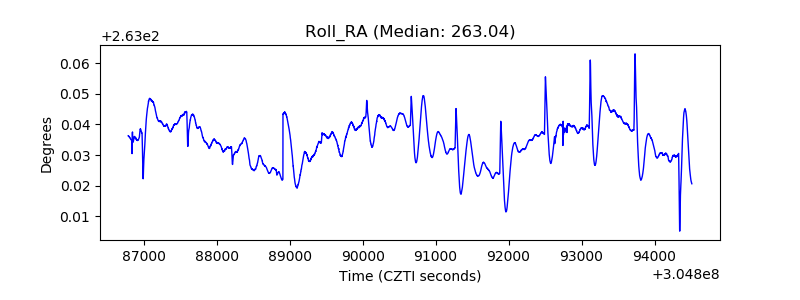 |
| Veto Counter | 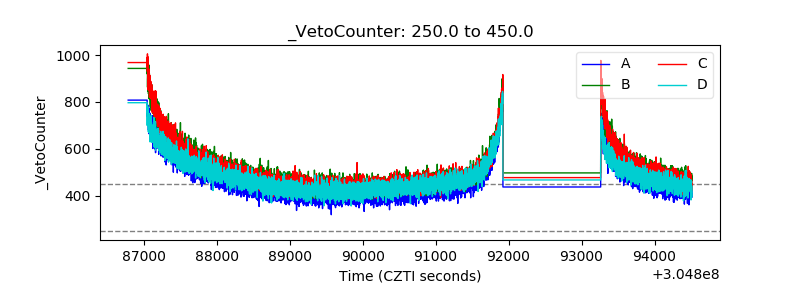 |