| Param | Original file | Final file |
|---|---|---|
| Filename | modeM0/AS1A06_002T01_9000003134_21207cztM0_level2.evt | modeM0/AS1A06_002T01_9000003134_21207cztM0_level2_quad_clean.evt |
| Size (bytes) | 607,504,320 | 89,196,480 |
| Size | 579.4 MB | 85.1 MB |
| Events in quadrant A | 5,924,332 | 541,098 |
| Events in quadrant B | 3,885,604 | 604,246 |
| Events in quadrant C | 3,175,707 | 583,851 |
| Events in quadrant D | 4,981,749 | 527,436 |
| Mode SS | |||
|---|---|---|---|
| Quadrant | BADHDUFLAG | Total packets | Discarded packets |
| A | 0 | 130 | 0 |
| B | 0 | 130 | 0 |
| C | 0 | 130 | 0 |
| D | 0 | 130 | 0 |
| Mode M0 | |||
|---|---|---|---|
| Quadrant | BADHDUFLAG | Total packets | Discarded packets |
| A | 0 | 21782 | 2 |
| B | 0 | 15664 | 2 |
| C | 0 | 13488 | 2 |
| D | 0 | 19110 | 2 |
| Mode M9 | |||
|---|---|---|---|
| Quadrant | BADHDUFLAG | Total packets | Discarded packets |
| A | 0 | 20 | 0 |
| B | 0 | 21 | 0 |
| C | 0 | 21 | 0 |
| D | 0 | 21 | 0 |
| Quadrant | Total seconds | Saturated seconds | Saturation percentage |
|---|---|---|---|
| A | 6362 | 945 | 14.853820% |
| B | 6362 | 222 | 3.489469% |
| C | 6361 | 84 | 1.320547% |
| D | 6361 | 492 | 7.734633% |
Noise dominated data is calculated using 1-second bins in cleaned event files. If a bin has >2000 counts, and if more than 50% of those come from <1% of pixels, then it is considered to be noise-dominated and hence unusable.
| Quadrant | # 1 sec bins | Bins with >0 counts | Bins with >2000 counts | High rate bins dominated by noise | Noise dominated (total time) | Noise dominated (detector-on time) | Marked lightcurve |
|---|---|---|---|---|---|---|---|
| A | 7542 | 6364 | 878 | 878 | 11.64% | 13.80% | 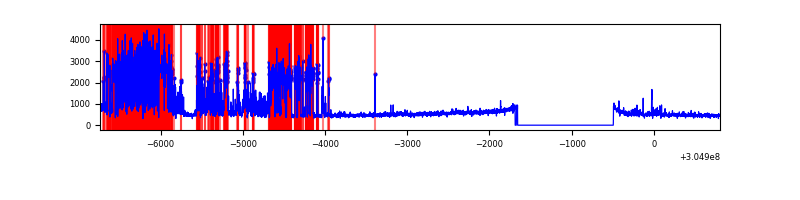 |
| B | 7542 | 6364 | 166 | 166 | 2.20% | 2.61% | 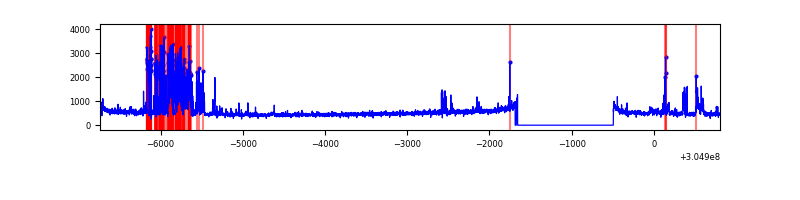 |
| C | 7541 | 6362 | 16 | 16 | 0.21% | 0.25% | 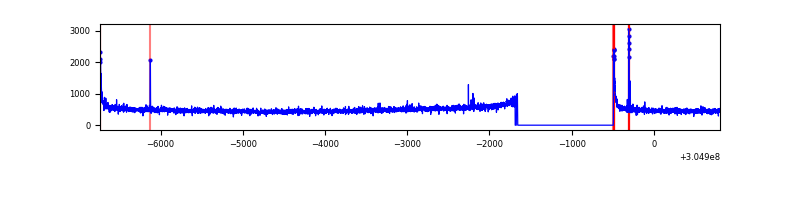 |
| D | 7541 | 6363 | 423 | 423 | 5.61% | 6.65% | 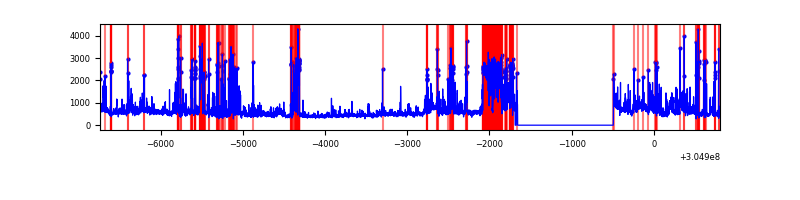 |
Top three noisy pixels from each quadrant. If the there are fewer than three noisy pixels in the level2.evt file, extra rows are filled as -1
| Pixel properties | Quadrant properties | ||||||
|---|---|---|---|---|---|---|---|
| Quadrant | DetID | PixID | Counts | Sigma | Mean | Median | Sigma |
| A | 15 | 236 | 3023225 | 20032.4 | 749 | 733 | 150.9 |
| A | 11 | 47 | 8458 | 51.2 | 749 | 733 | 150.9 |
| A | 13 | 254 | 7242 | 43.14 | 749 | 733 | 150.9 |
| B | 0 | 182 | 708448 | 4711.0 | 794 | 776 | 150.2 |
| B | 0 | 197 | 28819 | 186.68 | 794 | 776 | 150.2 |
| B | 15 | 35 | 18446 | 117.63 | 794 | 776 | 150.2 |
| C | 14 | 238 | 120293 | 672.5 | 759 | 764 | 177.7 |
| C | 0 | 10 | 54975 | 305.0 | 759 | 764 | 177.7 |
| C | 0 | 207 | 26755 | 146.23 | 759 | 764 | 177.7 |
| D | 7 | 238 | 1470880 | 8205.56 | 731 | 711 | 179.2 |
| D | 13 | 153 | 204550 | 1137.7 | 731 | 711 | 179.2 |
| D | 1 | 20 | 177406 | 986.2 | 731 | 711 | 179.2 |
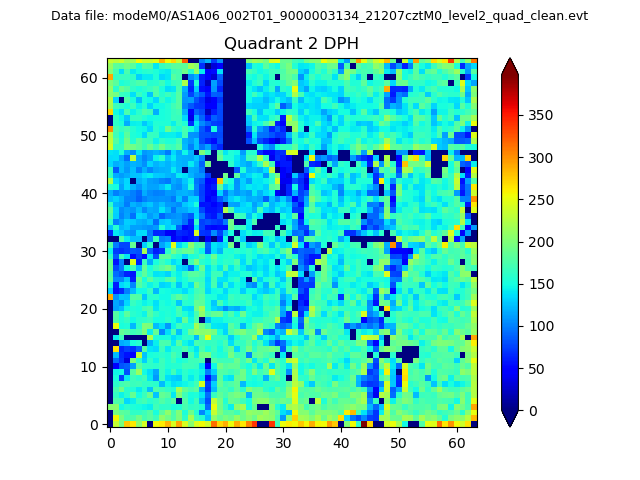
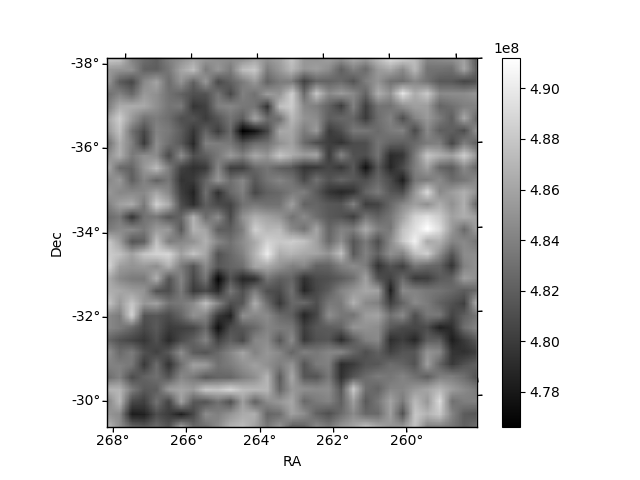
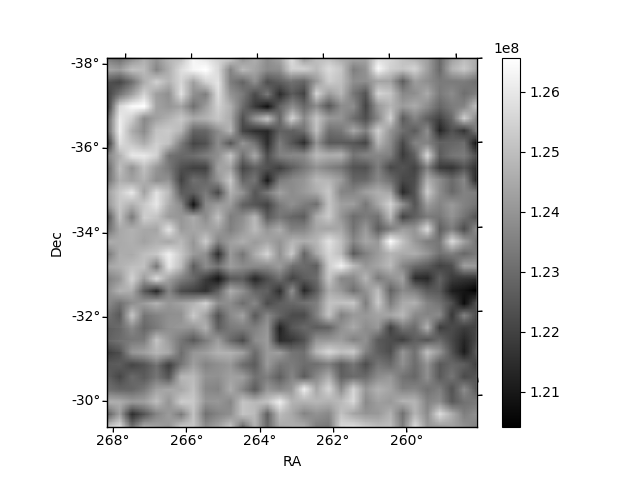
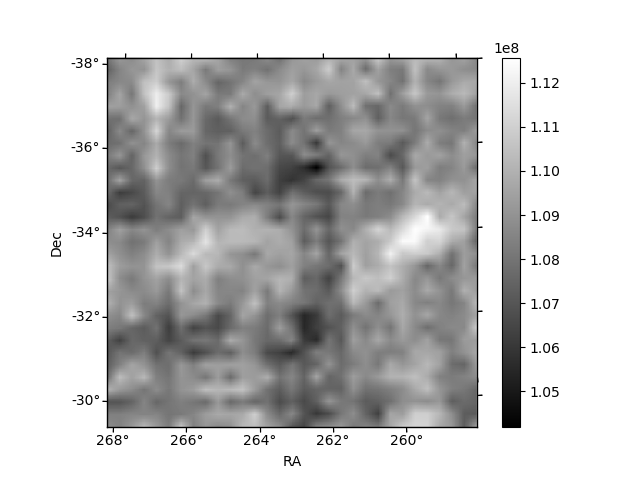
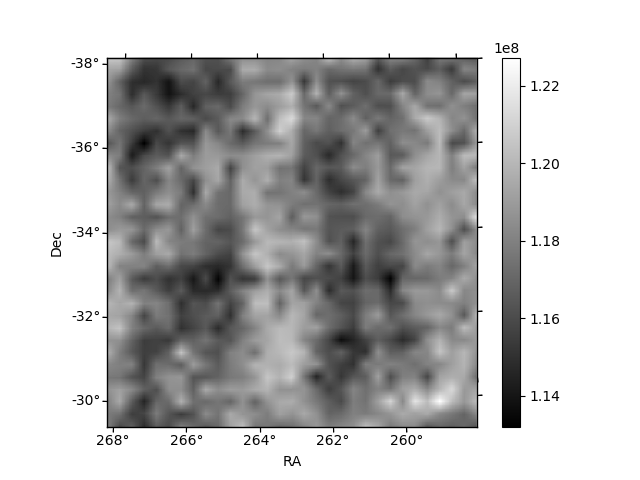
Histogram calculated using DETX and DETY for each event in the final _common_clean file
| Quadrant A | 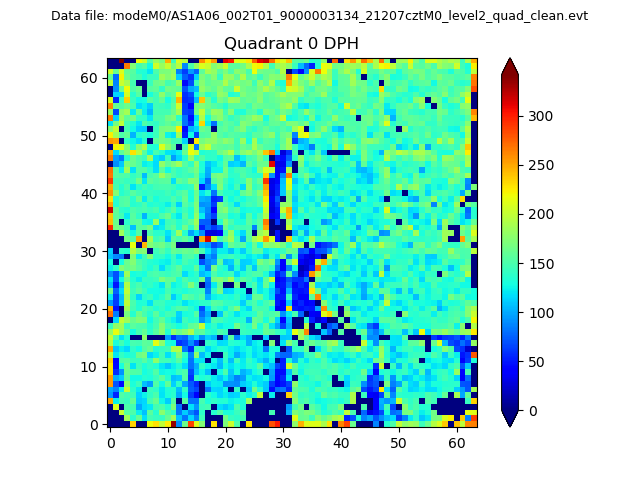 |
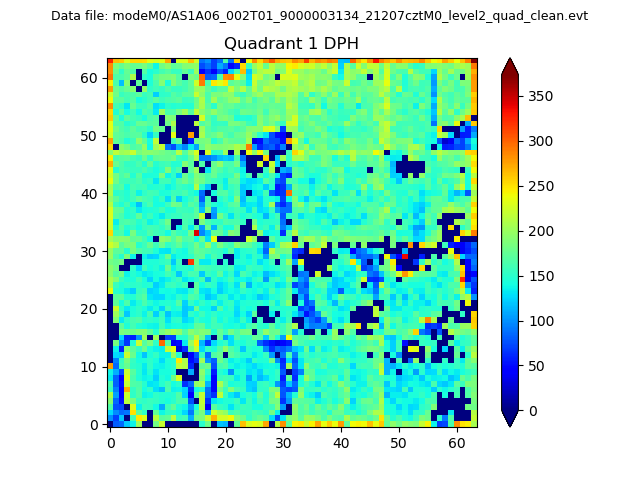 |
Quadrant B |
|---|---|---|---|
| Quadrant D | 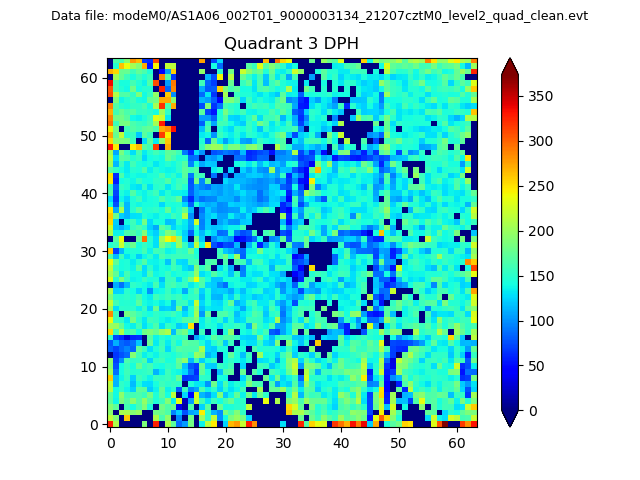 |
 |
Quadrant C |
| Plot type | Count rate plots | Images |
|---|---|---|
| Comparison with Poisson distribution Blue bars denote a histogram of data divided into 1 sec bins. Red curve is a Poisson curve with rate = median count rate of data. |
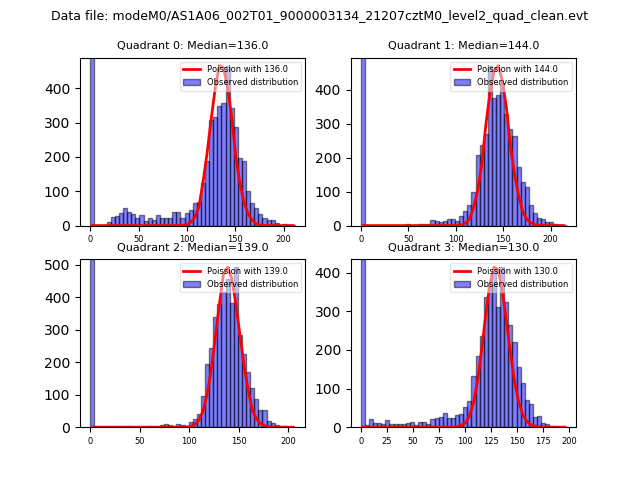 |
 |
| Quadrant-wise count rates Data is divided into 100 sec bins |
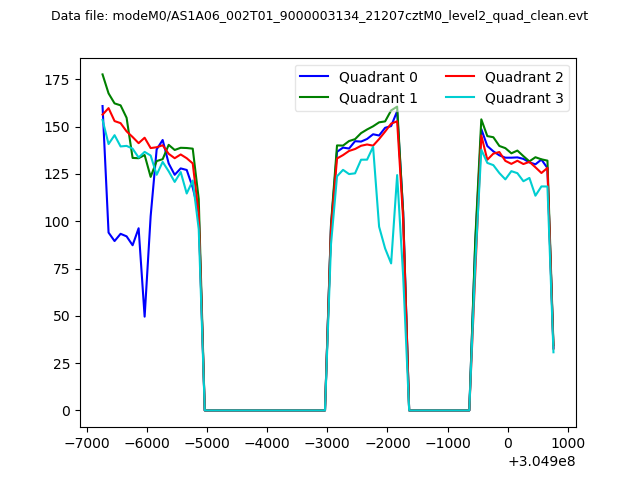 |
|
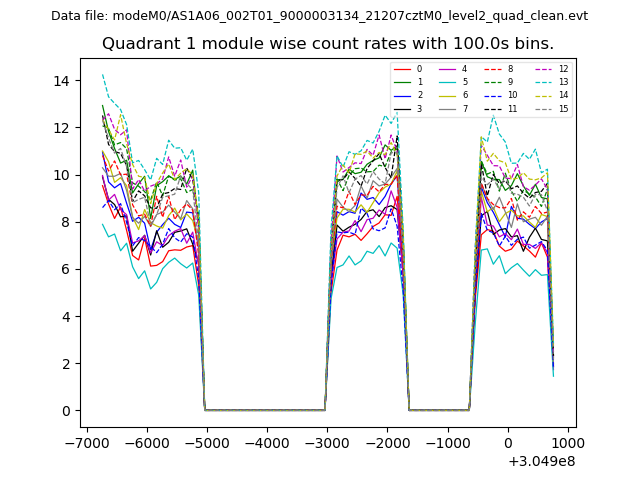
| Module-wise count rates for Quadrant A Data is divided into 100 sec bins |
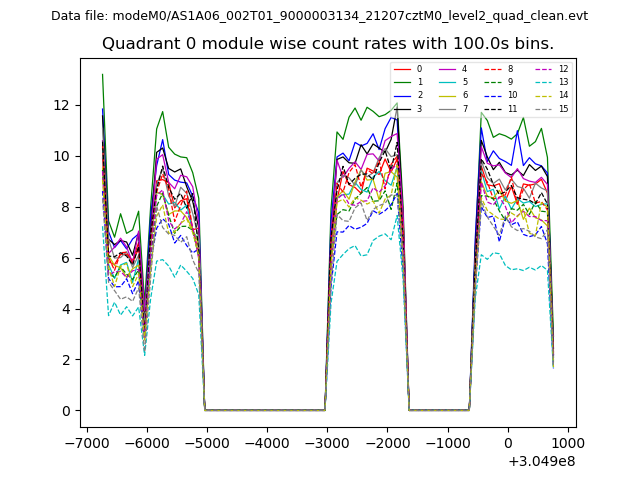 |
 |
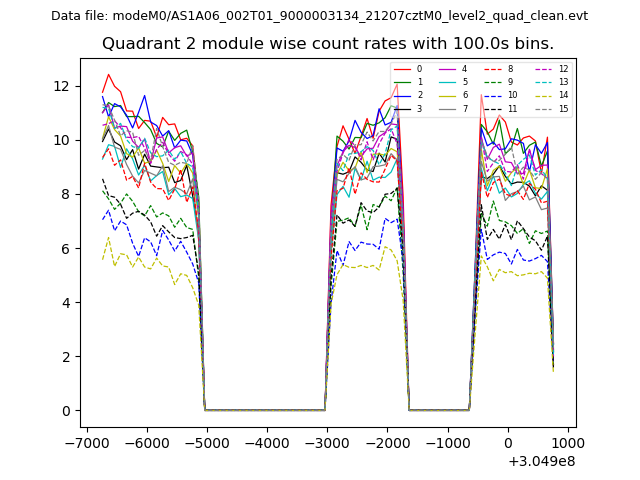
| Module-wise count rates for Quadrant B Data is divided into 100 sec bins |
 |
 |
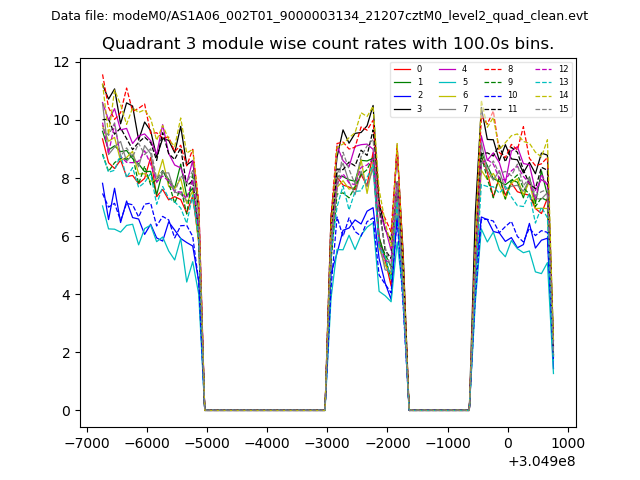
| Module-wise count rates for Quadrant C Data is divided into 100 sec bins |
 |
 |
| Module-wise count rates for Quadrant D Data is divided into 100 sec bins |
 |
 |
| Parameter | Plot |
|---|---|
| CZT HV Monitor | 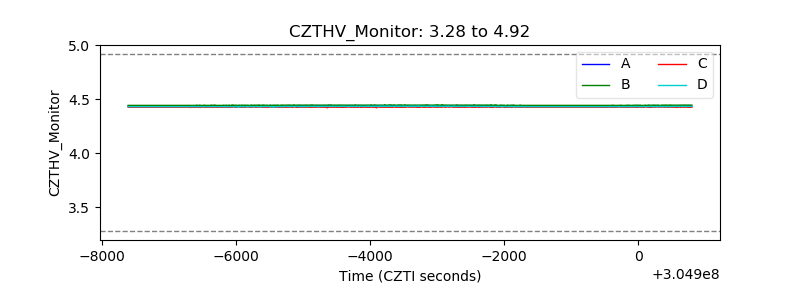 |
| D_VDD | 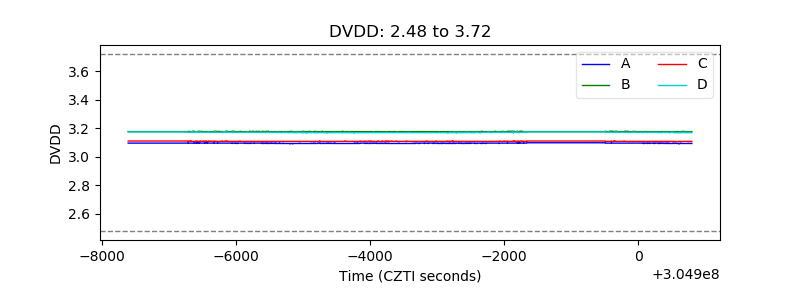 |
| Temperature 1 | 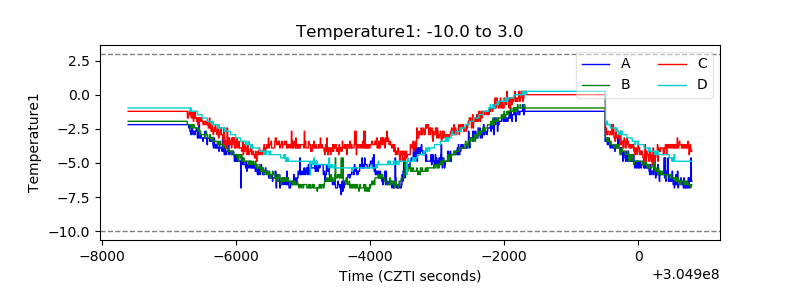 |
| Veto HV Monitor | 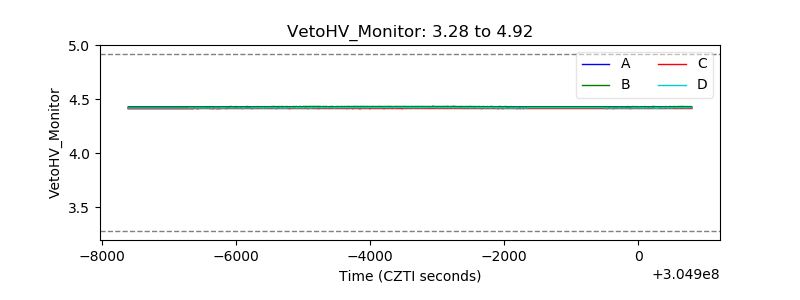 |
| Veto LLD | 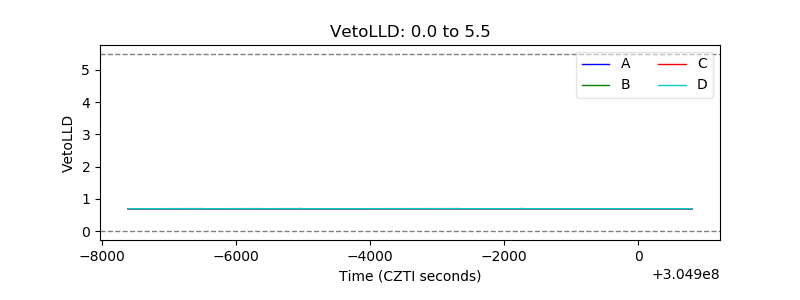 |
| Alpha Counter | 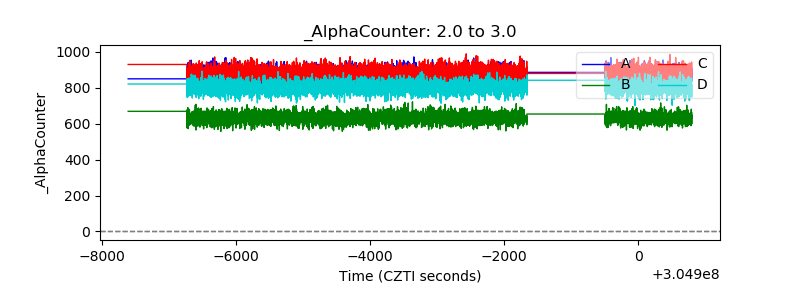 |
| _CPM_Rate | 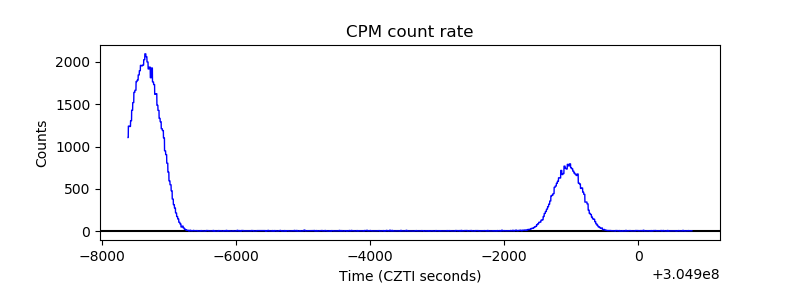 |
| CZT Counter | 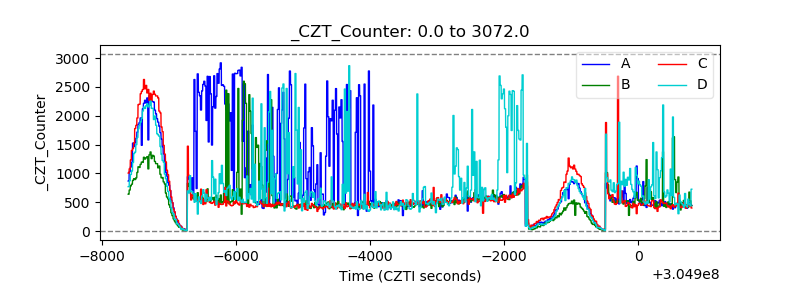 |
| +2.5 Volts monitor |  |
| +5 Volts monitor |  |
| _ROLL_ROT | 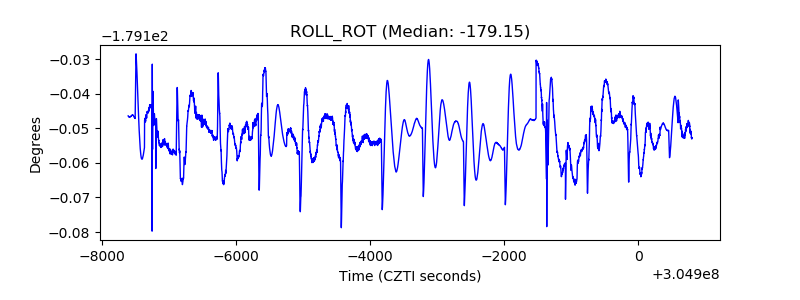 |
| _Roll_DEC | 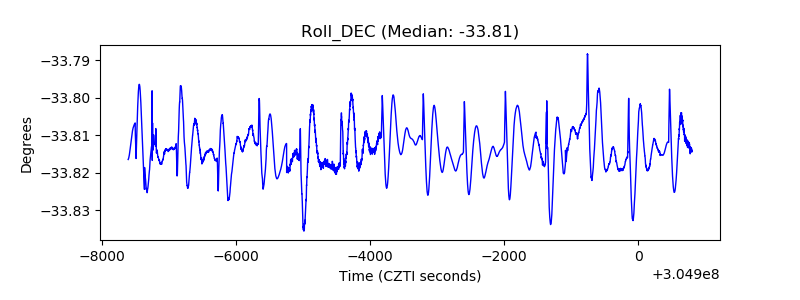 |
| _Roll_RA | 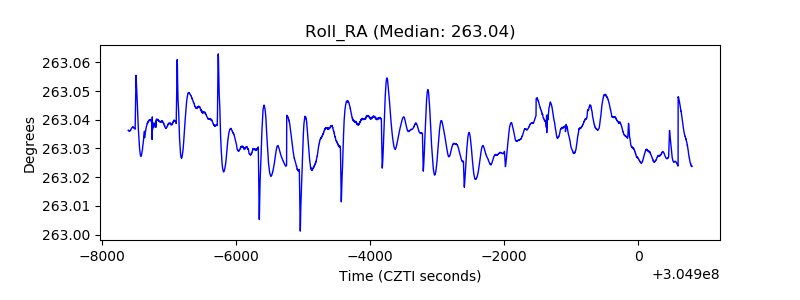 |
| Veto Counter | 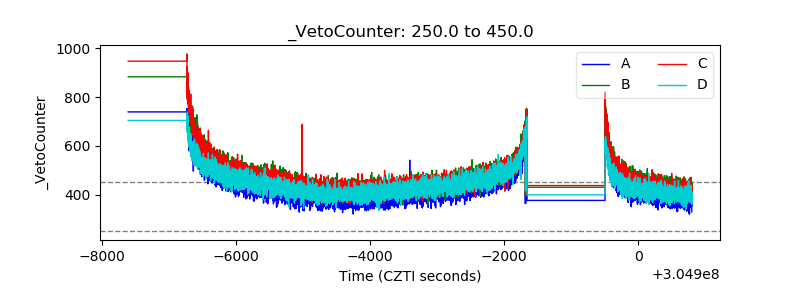 |