| Param | Original file | Final file |
|---|---|---|
| Filename | modeM0/AS1A06_002T01_9000003134_21210cztM0_level2.evt | modeM0/AS1A06_002T01_9000003134_21210cztM0_level2_quad_clean.evt |
| Size (bytes) | 775,114,560 | 94,746,240 |
| Size | 739.2 MB | 90.4 MB |
| Events in quadrant A | 7,737,176 | 553,105 |
| Events in quadrant B | 4,236,649 | 609,495 |
| Events in quadrant C | 4,372,694 | 583,958 |
| Events in quadrant D | 6,567,395 | 546,500 |
| Mode SS | |||
|---|---|---|---|
| Quadrant | BADHDUFLAG | Total packets | Discarded packets |
| A | 0 | 168 | 0 |
| B | 0 | 168 | 0 |
| C | 0 | 168 | 0 |
| D | 0 | 168 | 0 |
| Mode M0 | |||
|---|---|---|---|
| Quadrant | BADHDUFLAG | Total packets | Discarded packets |
| A | 0 | 28241 | 2 |
| B | 0 | 17904 | 3 |
| C | 0 | 18315 | 2 |
| D | 0 | 25202 | 2 |
| Mode M9 | |||
|---|---|---|---|
| Quadrant | BADHDUFLAG | Total packets | Discarded packets |
| A | 0 | 7 | 0 |
| B | 0 | 7 | 0 |
| C | 0 | 7 | 0 |
| D | 0 | 7 | 0 |
| Quadrant | Total seconds | Saturated seconds | Saturation percentage |
|---|---|---|---|
| A | 8288 | 1795 | 21.657819% |
| B | 8288 | 183 | 2.208012% |
| C | 8288 | 192 | 2.316602% |
| D | 8288 | 555 | 6.696429% |
Noise dominated data is calculated using 1-second bins in cleaned event files. If a bin has >2000 counts, and if more than 50% of those come from <1% of pixels, then it is considered to be noise-dominated and hence unusable.
| Quadrant | # 1 sec bins | Bins with >0 counts | Bins with >2000 counts | High rate bins dominated by noise | Noise dominated (total time) | Noise dominated (detector-on time) | Marked lightcurve |
|---|---|---|---|---|---|---|---|
| A | 8898 | 8290 | 1639 | 1639 | 18.42% | 19.77% | 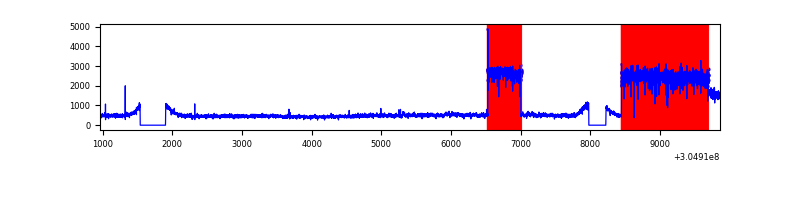 |
| B | 8898 | 8290 | 25 | 25 | 0.28% | 0.30% | 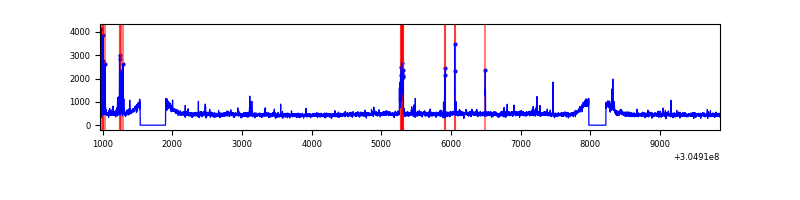 |
| C | 8898 | 8290 | 22 | 22 | 0.25% | 0.27% | 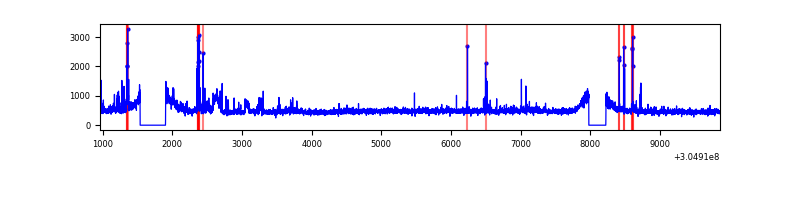 |
| D | 8898 | 8290 | 384 | 384 | 4.32% | 4.63% | 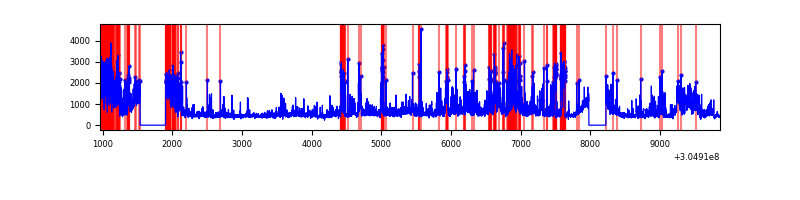 |
Top three noisy pixels from each quadrant. If the there are fewer than three noisy pixels in the level2.evt file, extra rows are filled as -1
| Pixel properties | Quadrant properties | ||||||
|---|---|---|---|---|---|---|---|
| Quadrant | DetID | PixID | Counts | Sigma | Mean | Median | Sigma |
| A | 15 | 236 | 4147153 | 22044.45 | 926 | 906 | 188.1 |
| A | 11 | 47 | 16795 | 84.48 | 926 | 906 | 188.1 |
| A | 13 | 254 | 9871 | 47.66 | 926 | 906 | 188.1 |
| B | 0 | 182 | 121111 | 611.62 | 1014 | 986 | 196.4 |
| B | 0 | 189 | 40364 | 200.49 | 1014 | 986 | 196.4 |
| B | 3 | 64 | 28857 | 141.91 | 1014 | 986 | 196.4 |
| C | 0 | 239 | 286775 | 1249.52 | 969 | 974 | 228.7 |
| C | 14 | 238 | 148773 | 646.18 | 969 | 974 | 228.7 |
| C | 3 | 233 | 134890 | 585.48 | 969 | 974 | 228.7 |
| D | 7 | 238 | 1146666 | 4838.57 | 959 | 930 | 236.8 |
| D | 1 | 52 | 756984 | 3192.9 | 959 | 930 | 236.8 |
| D | 13 | 174 | 461417 | 1944.69 | 959 | 930 | 236.8 |
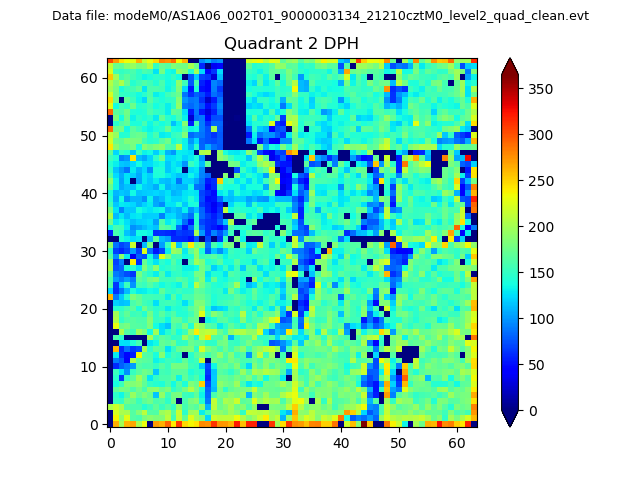
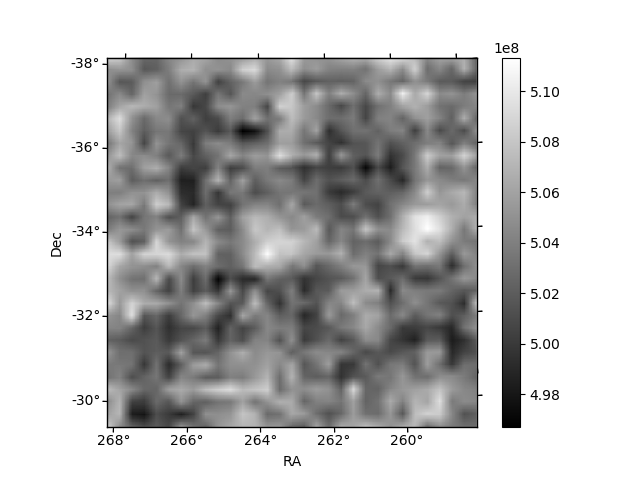
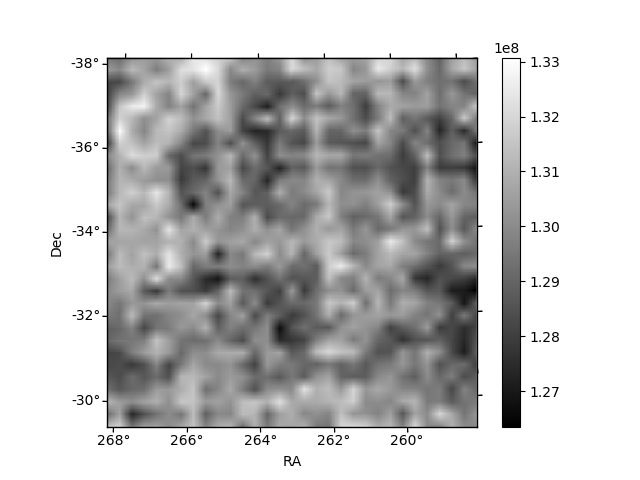
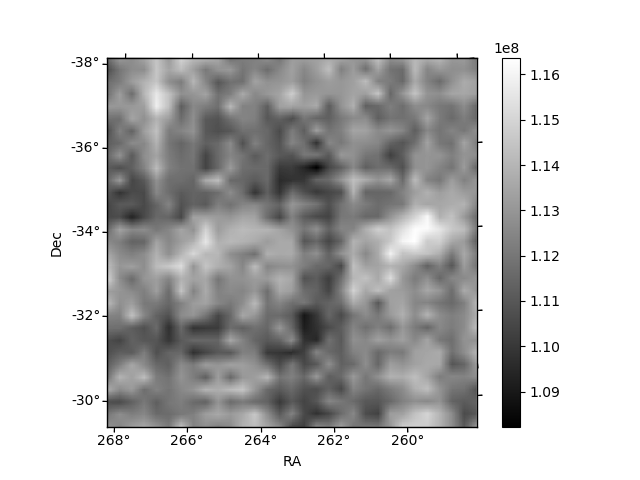
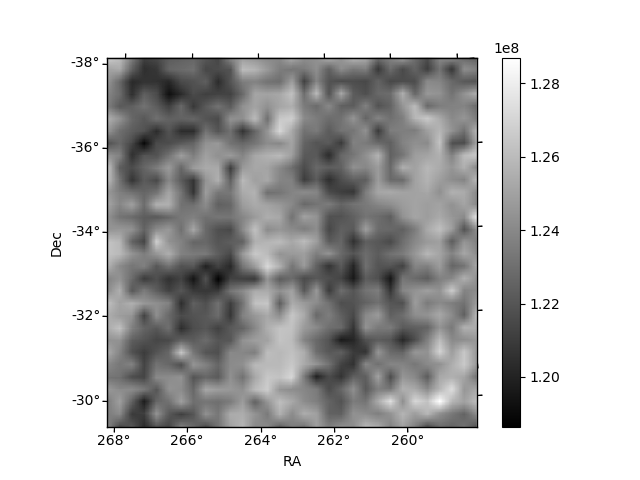
Histogram calculated using DETX and DETY for each event in the final _common_clean file
| Quadrant A | 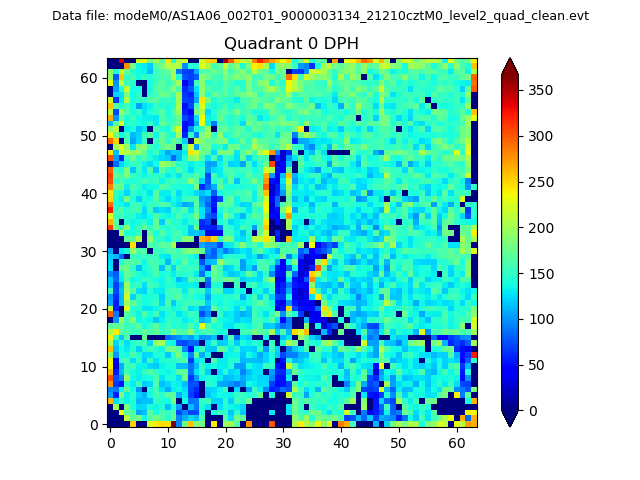 |
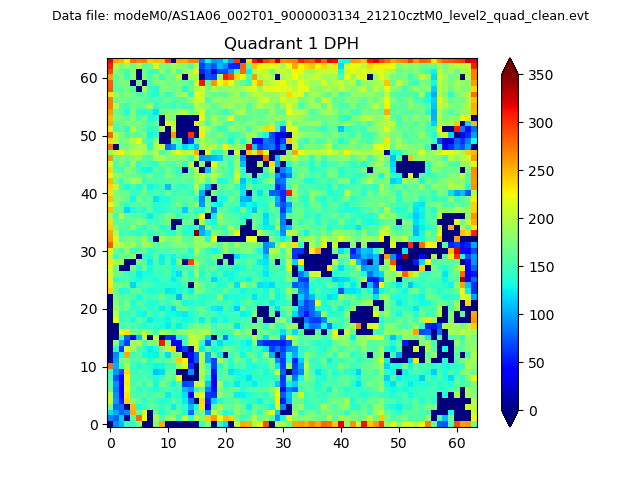 |
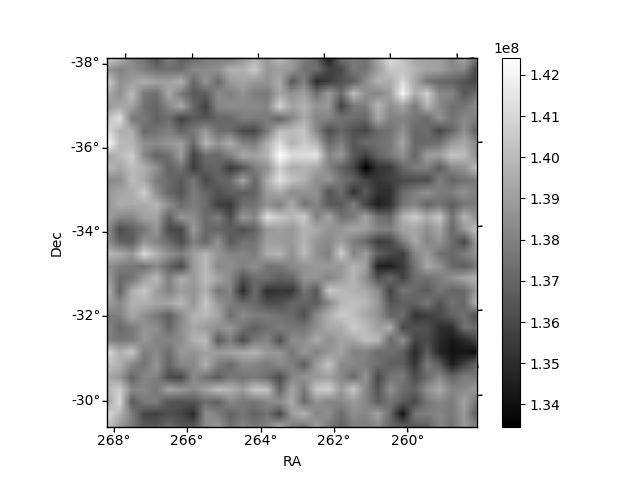
Quadrant B |
|---|---|---|---|
| Quadrant D | 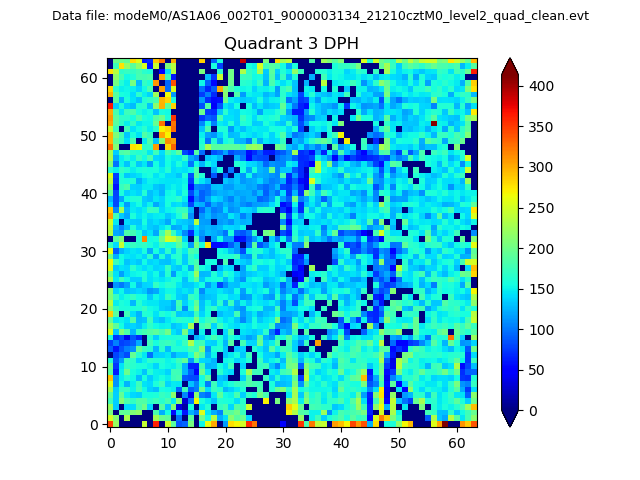 |
 |
Quadrant C |
| Plot type | Count rate plots | Images |
|---|---|---|
| Comparison with Poisson distribution Blue bars denote a histogram of data divided into 1 sec bins. Red curve is a Poisson curve with rate = median count rate of data. |
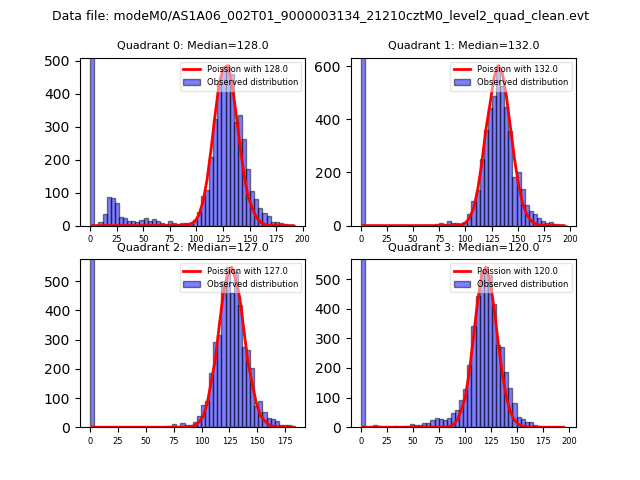 |
 |
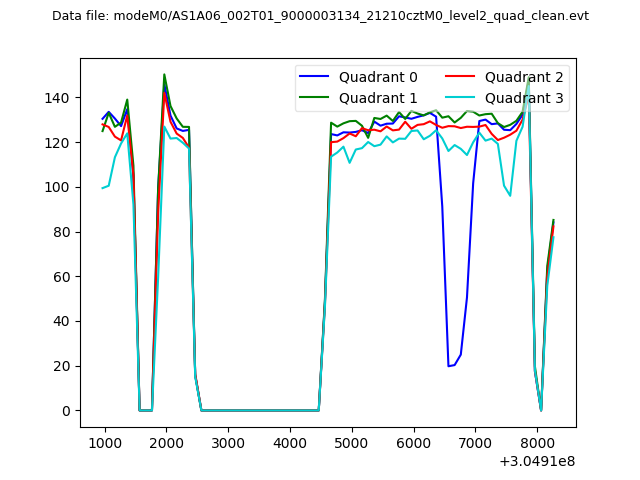
| Quadrant-wise count rates Data is divided into 100 sec bins |
 |
|
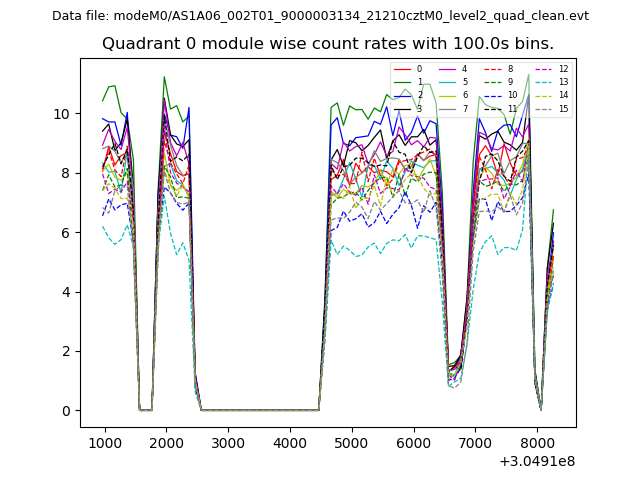
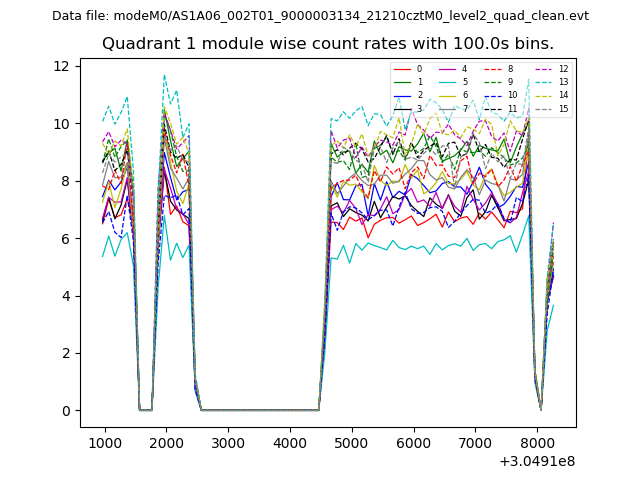
| Module-wise count rates for Quadrant A Data is divided into 100 sec bins |
 |
 |
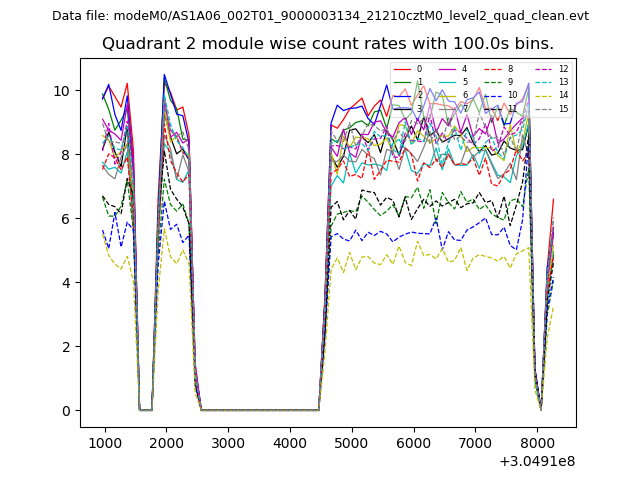
| Module-wise count rates for Quadrant B Data is divided into 100 sec bins |
 |
 |
| Module-wise count rates for Quadrant C Data is divided into 100 sec bins |
 |
 |
| Module-wise count rates for Quadrant D Data is divided into 100 sec bins |
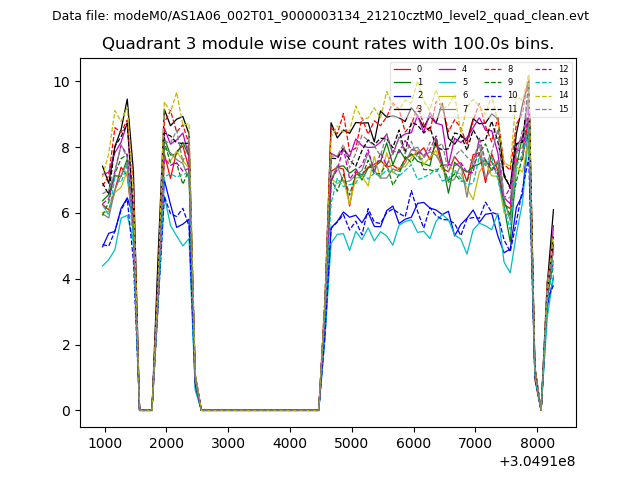 |
 |
| Parameter | Plot |
|---|---|
| CZT HV Monitor | 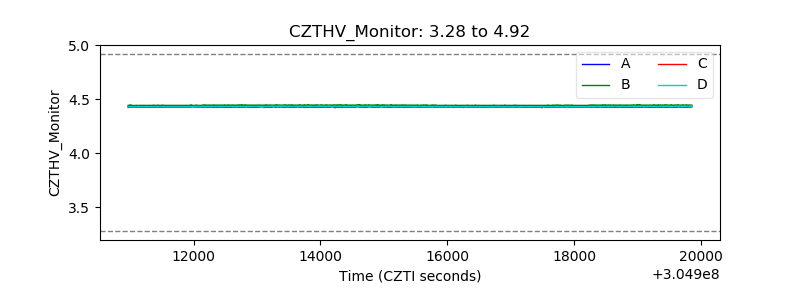 |
| D_VDD |  |
| Temperature 1 |  |
| Veto HV Monitor | 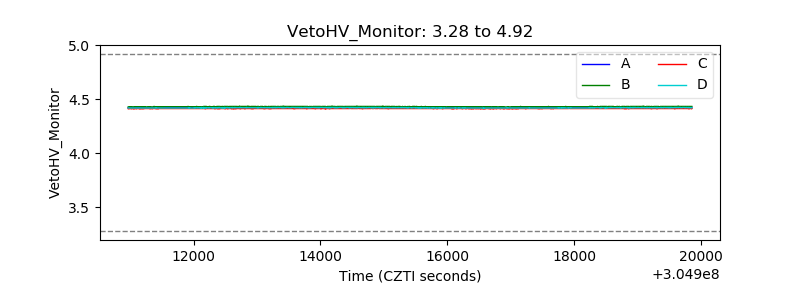 |
| Veto LLD | 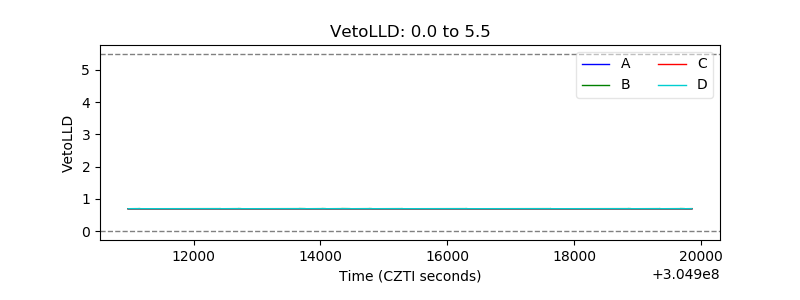 |
| Alpha Counter | 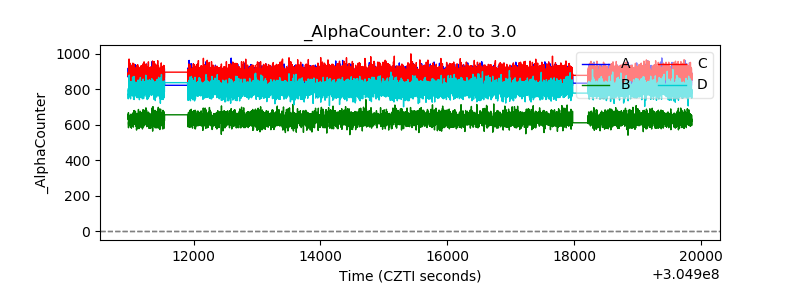 |
| _CPM_Rate | 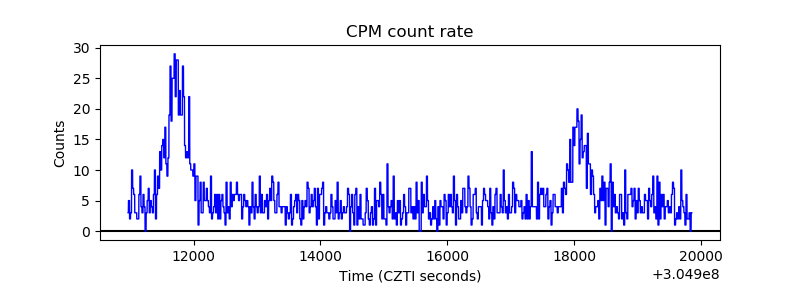 |
| CZT Counter | 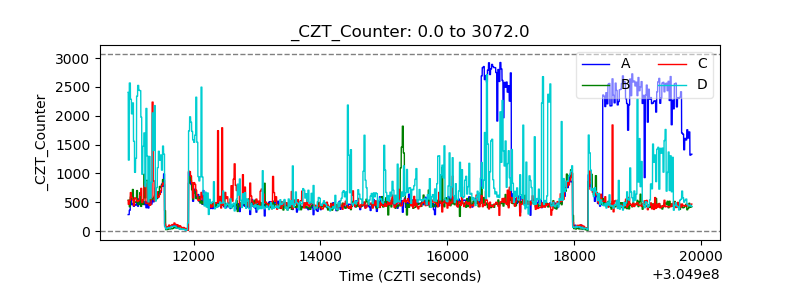 |
| +2.5 Volts monitor | 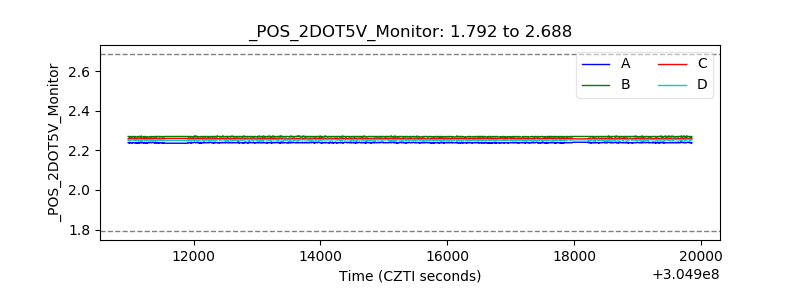 |
| +5 Volts monitor |  |
| _ROLL_ROT | 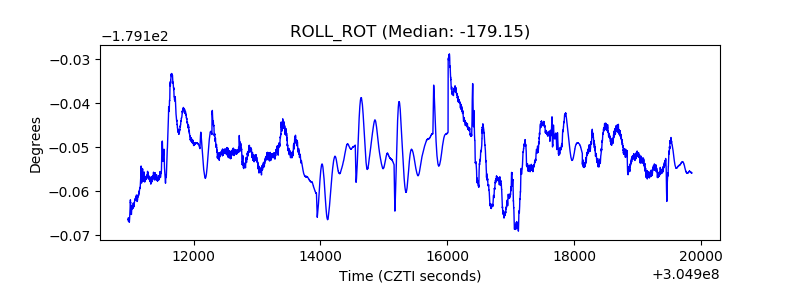 |
| _Roll_DEC | 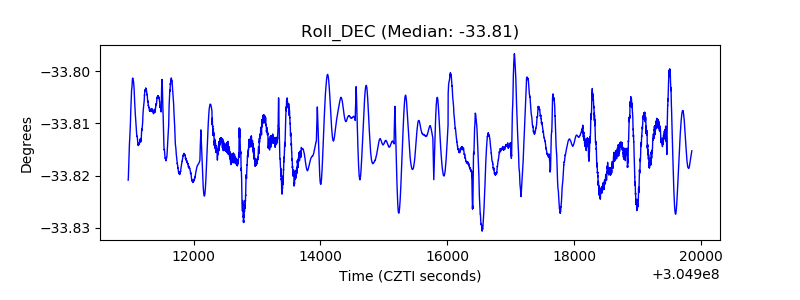 |
| _Roll_RA | 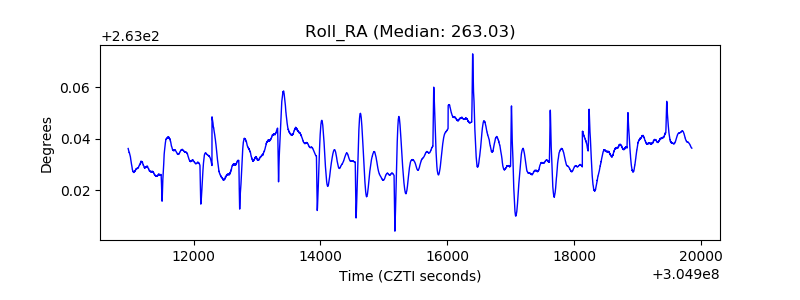 |
| Veto Counter | 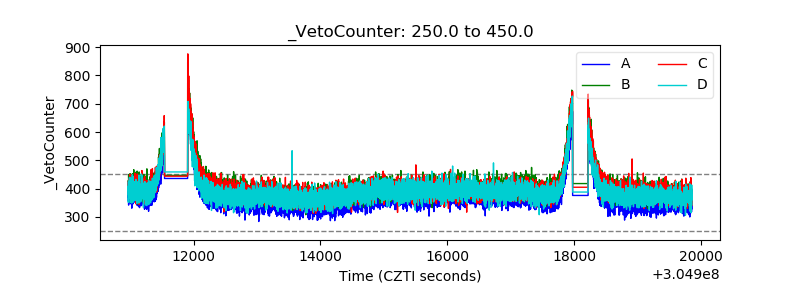 |