| Param | Original file | Final file |
|---|---|---|
| Filename | modeM0/AS1A06_002T01_9000003134_21211cztM0_level2.evt | modeM0/AS1A06_002T01_9000003134_21211cztM0_level2_quad_clean.evt |
| Size (bytes) | 1,007,916,480 | 70,525,440 |
| Size | 961.2 MB | 67.3 MB |
| Events in quadrant A | 15,934,783 | 316,351 |
| Events in quadrant B | 3,570,005 | 474,486 |
| Events in quadrant C | 3,532,513 | 458,929 |
| Events in quadrant D | 6,991,661 | 372,101 |
| Mode SS | |||
|---|---|---|---|
| Quadrant | BADHDUFLAG | Total packets | Discarded packets |
| A | 0 | 148 | 0 |
| B | 0 | 148 | 0 |
| C | 0 | 148 | 0 |
| D | 0 | 148 | 0 |
| Mode M0 | |||
|---|---|---|---|
| Quadrant | BADHDUFLAG | Total packets | Discarded packets |
| A | 0 | 52330 | 2 |
| B | 0 | 15342 | 1 |
| C | 0 | 15212 | 1 |
| D | 0 | 25784 | 1 |
| Mode M9 | |||
|---|---|---|---|
| Quadrant | BADHDUFLAG | Total packets | Discarded packets |
| A | 0 | 4 | 0 |
| B | 0 | 4 | 0 |
| C | 0 | 4 | 0 |
| D | 0 | 4 | 0 |
| Quadrant | Total seconds | Saturated seconds | Saturation percentage |
|---|---|---|---|
| A | 7350 | 5685 | 77.346939% |
| B | 7351 | 102 | 1.387566% |
| C | 7351 | 106 | 1.441981% |
| D | 7351 | 1242 | 16.895660% |
Noise dominated data is calculated using 1-second bins in cleaned event files. If a bin has >2000 counts, and if more than 50% of those come from <1% of pixels, then it is considered to be noise-dominated and hence unusable.
| Quadrant | # 1 sec bins | Bins with >0 counts | Bins with >2000 counts | High rate bins dominated by noise | Noise dominated (total time) | Noise dominated (detector-on time) | Marked lightcurve |
|---|---|---|---|---|---|---|---|
| A | 7710 | 7350 | 5354 | 5354 | 69.44% | 72.84% | 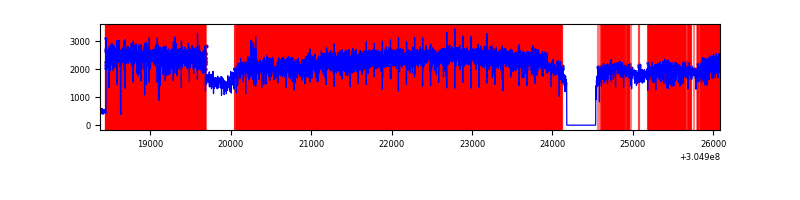 |
| B | 7711 | 7352 | 9 | 9 | 0.12% | 0.12% | 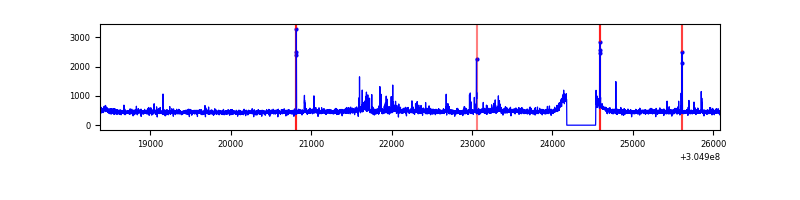 |
| C | 7711 | 7352 | 8 | 8 | 0.10% | 0.11% | 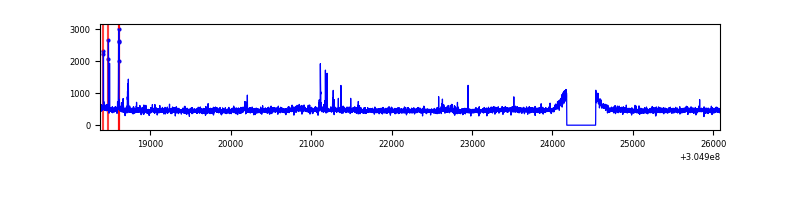 |
| D | 7711 | 7351 | 945 | 945 | 12.26% | 12.86% | 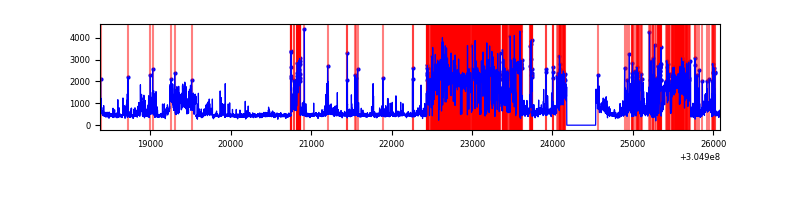 |
Top three noisy pixels from each quadrant. If the there are fewer than three noisy pixels in the level2.evt file, extra rows are filled as -1
| Pixel properties | Quadrant properties | ||||||
|---|---|---|---|---|---|---|---|
| Quadrant | DetID | PixID | Counts | Sigma | Mean | Median | Sigma |
| A | 15 | 236 | 13204109 | 93260.7 | 697 | 681 | 141.6 |
| A | 5 | 16 | 25295 | 173.86 | 697 | 681 | 141.6 |
| A | 11 | 47 | 16318 | 110.45 | 697 | 681 | 141.6 |
| B | 0 | 182 | 55681 | 325.9 | 873 | 850 | 168.2 |
| B | 3 | 64 | 40360 | 234.84 | 873 | 850 | 168.2 |
| B | 0 | 190 | 28534 | 164.55 | 873 | 850 | 168.2 |
| C | 14 | 238 | 130716 | 655.54 | 839 | 844 | 198.1 |
| C | 0 | 239 | 80851 | 403.84 | 839 | 844 | 198.1 |
| C | 3 | 233 | 49525 | 245.72 | 839 | 844 | 198.1 |
| D | 7 | 238 | 2791006 | 14730.77 | 771 | 749 | 189.4 |
| D | 1 | 52 | 665036 | 3507.01 | 771 | 749 | 189.4 |
| D | 13 | 174 | 433675 | 2285.57 | 771 | 749 | 189.4 |
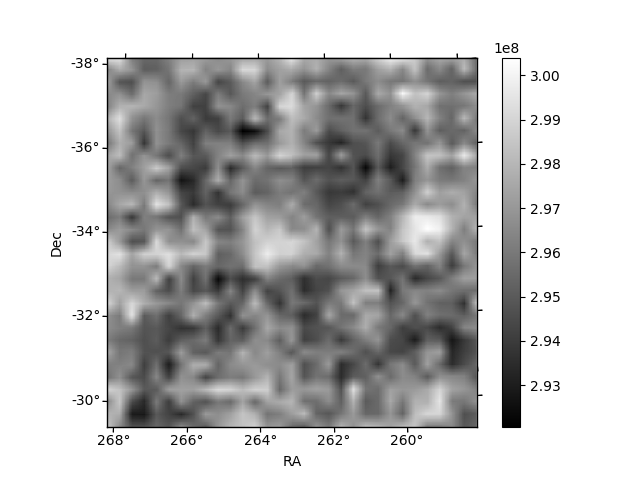
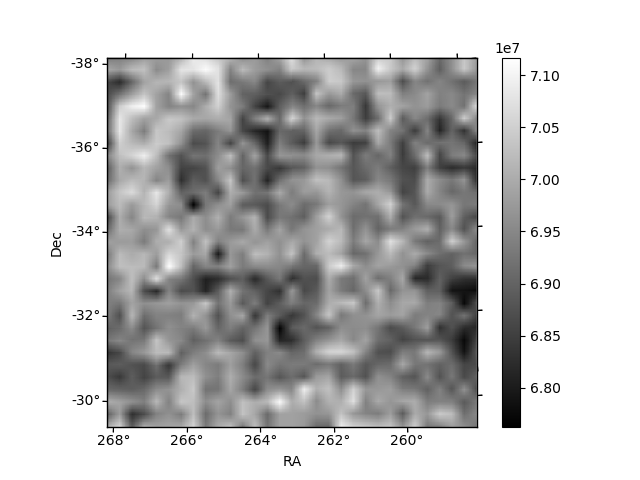
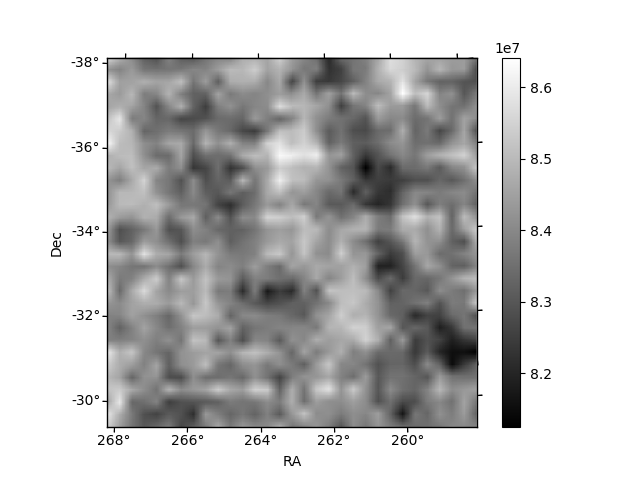
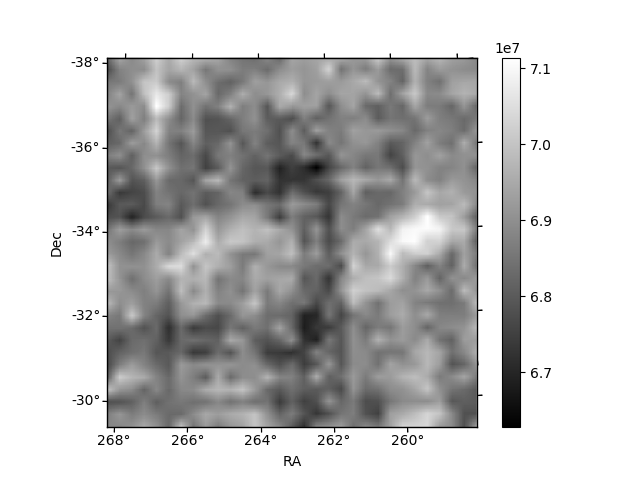
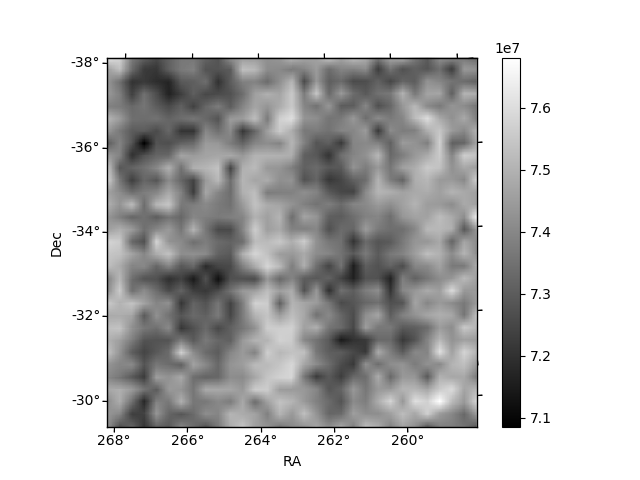
Histogram calculated using DETX and DETY for each event in the final _common_clean file
| Quadrant A | 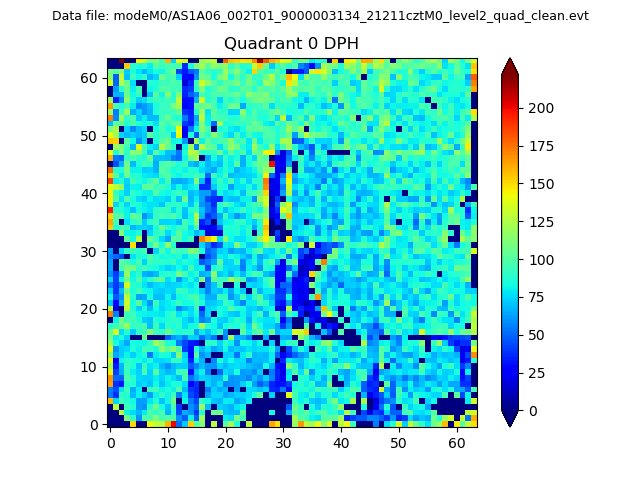 |
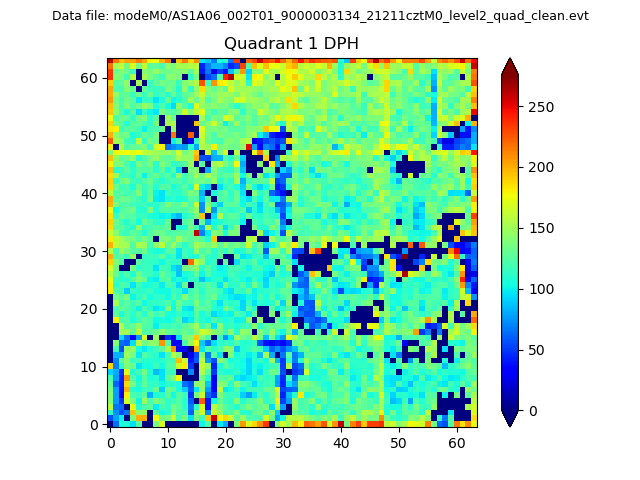 |
Quadrant B |
|---|---|---|---|
| Quadrant D | 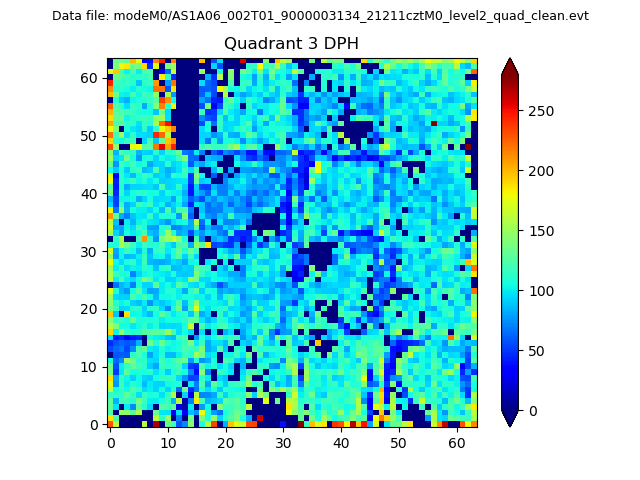 |
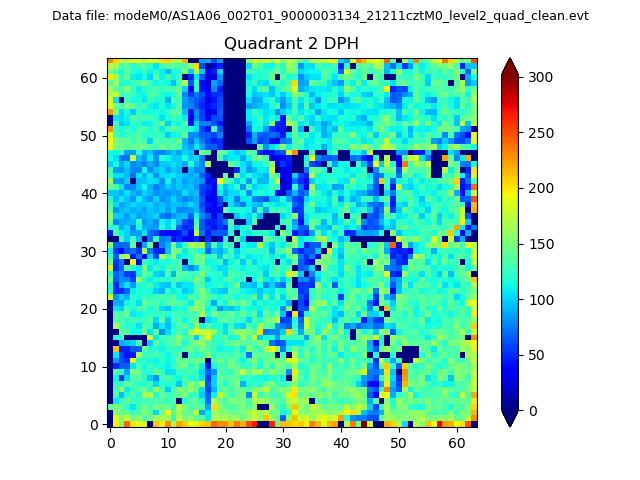 |
Quadrant C |
| Plot type | Count rate plots | Images |
|---|---|---|
| Comparison with Poisson distribution Blue bars denote a histogram of data divided into 1 sec bins. Red curve is a Poisson curve with rate = median count rate of data. |
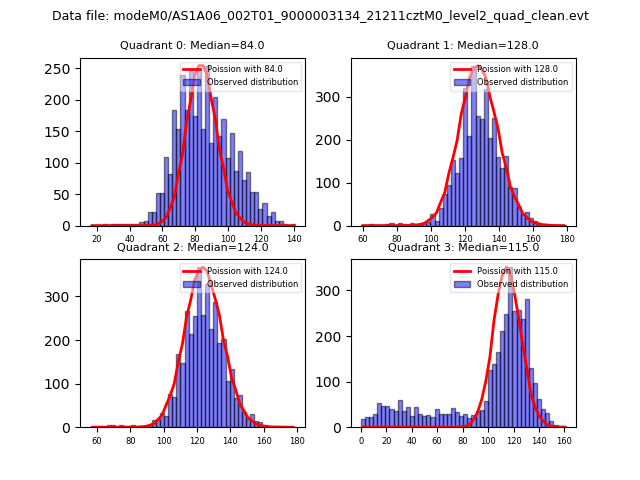 |
 |
| Quadrant-wise count rates Data is divided into 100 sec bins |
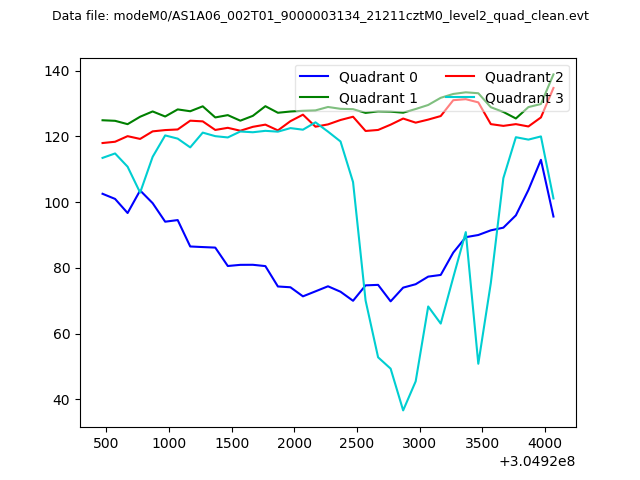 |
|
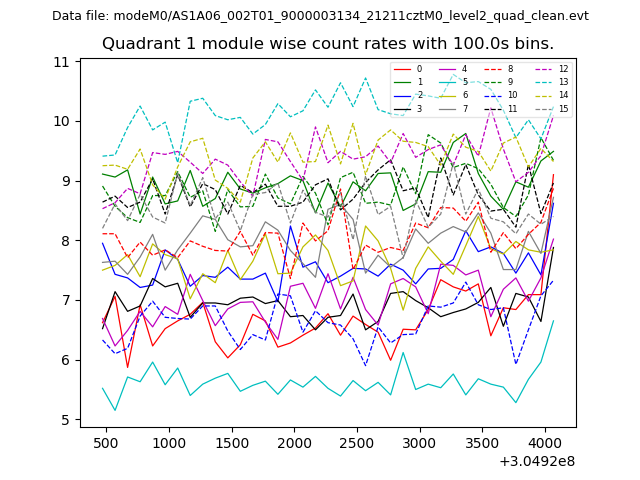
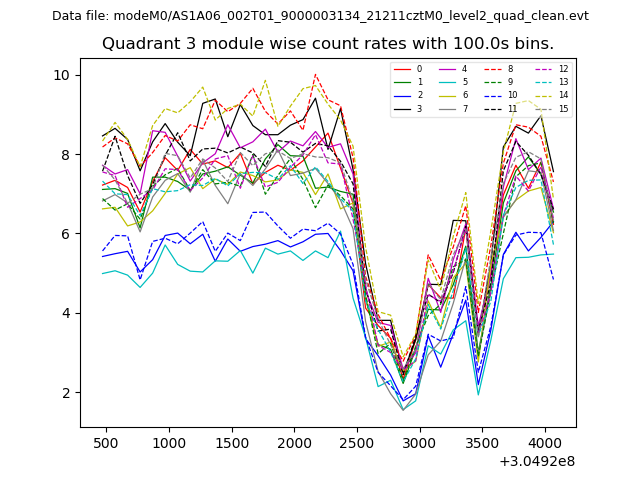
| Module-wise count rates for Quadrant A Data is divided into 100 sec bins |
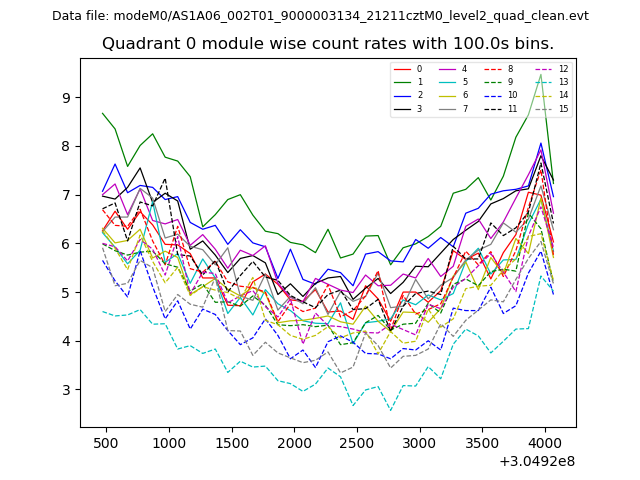 |
 |
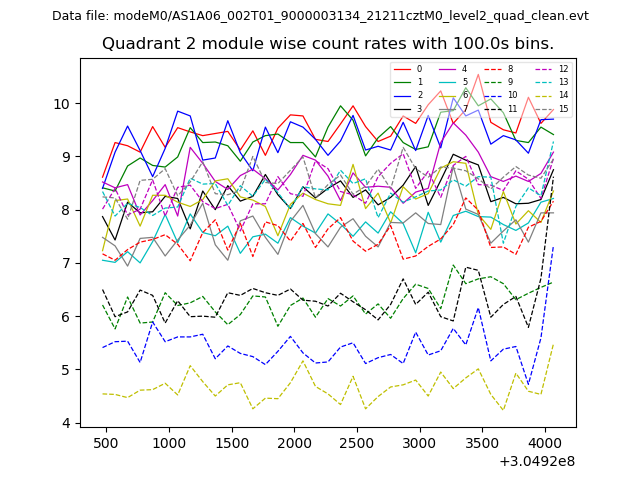
| Module-wise count rates for Quadrant B Data is divided into 100 sec bins |
 |
 |
| Module-wise count rates for Quadrant C Data is divided into 100 sec bins |
 |
 |
| Module-wise count rates for Quadrant D Data is divided into 100 sec bins |
 |
 |
| Parameter | Plot |
|---|---|
| CZT HV Monitor | 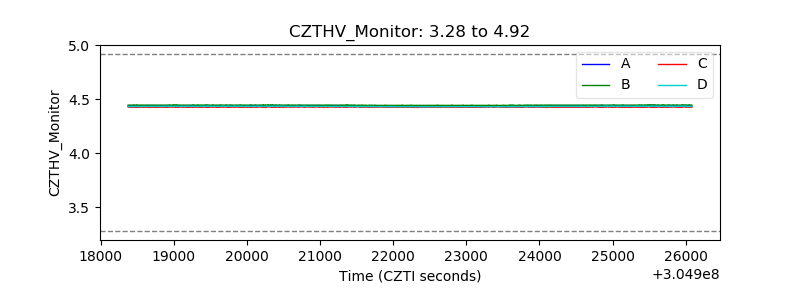 |
| D_VDD |  |
| Temperature 1 | 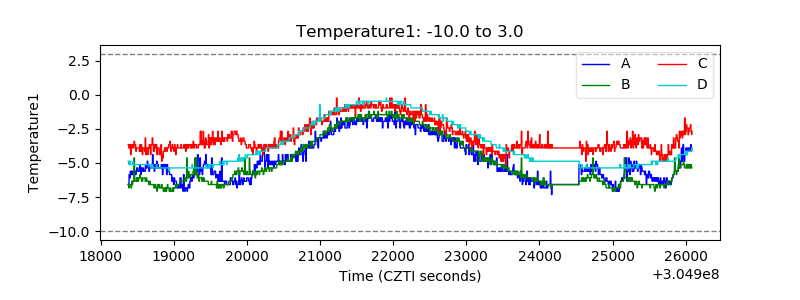 |
| Veto HV Monitor | 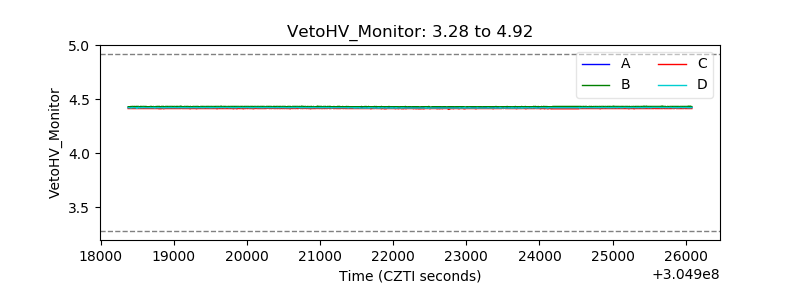 |
| Veto LLD | 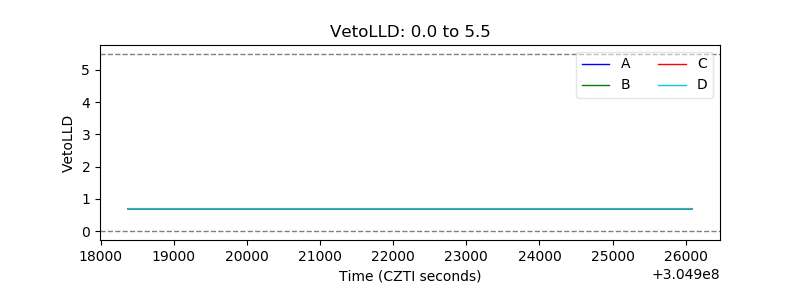 |
| Alpha Counter | 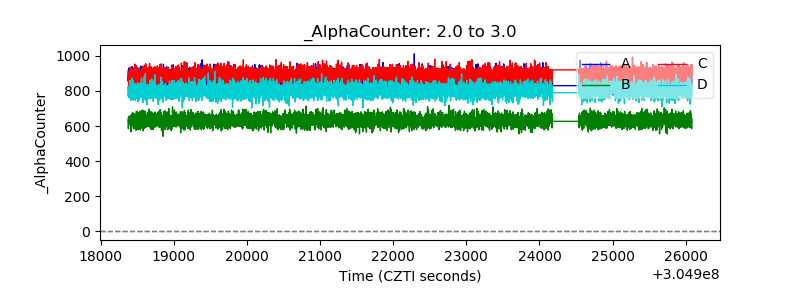 |
| _CPM_Rate |  |
| CZT Counter | 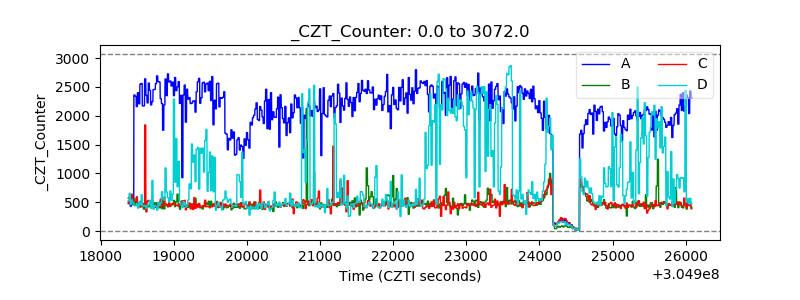 |
| +2.5 Volts monitor |  |
| +5 Volts monitor | 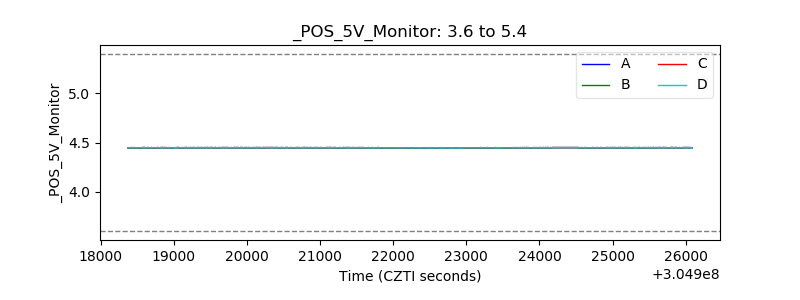 |
| _ROLL_ROT | 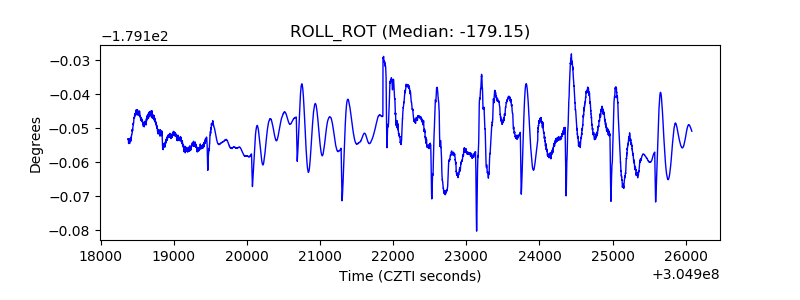 |
| _Roll_DEC | 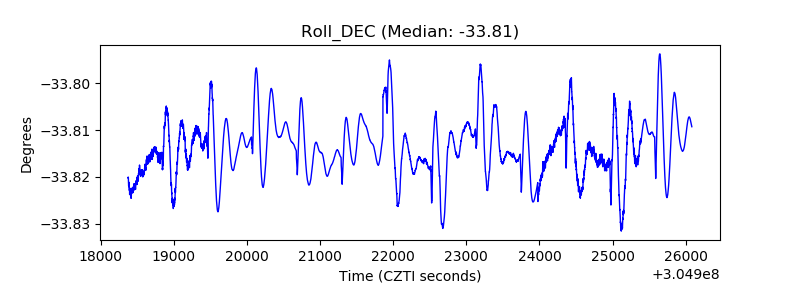 |
| _Roll_RA | 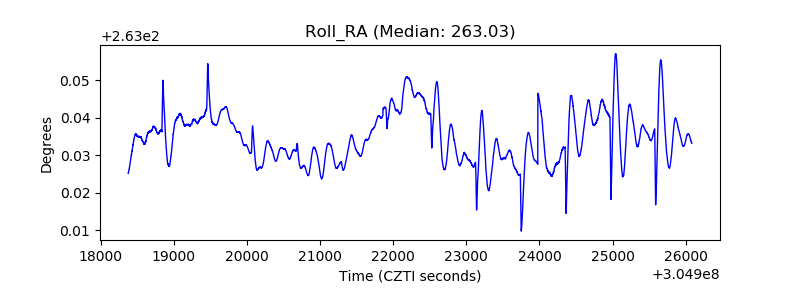 |
| Veto Counter | 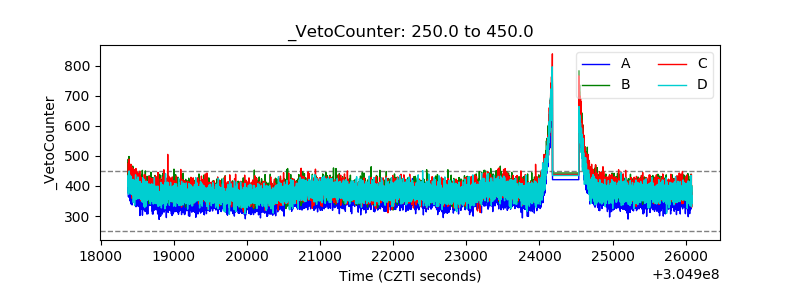 |