| Param | Original file | Final file |
|---|---|---|
| Filename | modeM0/AS1A06_002T01_9000003134_21213cztM0_level2.evt | modeM0/AS1A06_002T01_9000003134_21213cztM0_level2_quad_clean.evt |
| Size (bytes) | 1,534,847,040 | 148,544,640 |
| Size | 1.4 GB | 141.7 MB |
| Events in quadrant A | 22,965,538 | 655,030 |
| Events in quadrant B | 6,908,818 | 1,015,286 |
| Events in quadrant C | 6,196,128 | 987,323 |
| Events in quadrant D | 9,539,655 | 943,503 |
| Mode SS | |||
|---|---|---|---|
| Quadrant | BADHDUFLAG | Total packets | Discarded packets |
| A | 0 | 266 | 2 |
| B | 0 | 266 | 2 |
| C | 0 | 265 | 1 |
| D | 0 | 266 | 2 |
| Mode M0 | |||
|---|---|---|---|
| Quadrant | BADHDUFLAG | Total packets | Discarded packets |
| A | 0 | 76761 | 90 |
| B | 0 | 28652 | 45 |
| C | 0 | 26635 | 47 |
| D | 0 | 37082 | 42 |
| Mode M9 | |||
|---|---|---|---|
| Quadrant | BADHDUFLAG | Total packets | Discarded packets |
| A | 0 | 16 | 0 |
| B | 0 | 16 | 0 |
| C | 0 | 16 | 0 |
| D | 0 | 16 | 0 |
| Quadrant | Total seconds | Saturated seconds | Saturation percentage |
|---|---|---|---|
| A | 12949 | 8016 | 61.904394% |
| B | 12950 | 370 | 2.857143% |
| C | 12950 | 279 | 2.154440% |
| D | 12951 | 695 | 5.366381% |
Noise dominated data is calculated using 1-second bins in cleaned event files. If a bin has >2000 counts, and if more than 50% of those come from <1% of pixels, then it is considered to be noise-dominated and hence unusable.
| Quadrant | # 1 sec bins | Bins with >0 counts | Bins with >2000 counts | High rate bins dominated by noise | Noise dominated (total time) | Noise dominated (detector-on time) | Marked lightcurve |
|---|---|---|---|---|---|---|---|
| A | 14650 | 12951 | 7245 | 7245 | 49.45% | 55.94% | 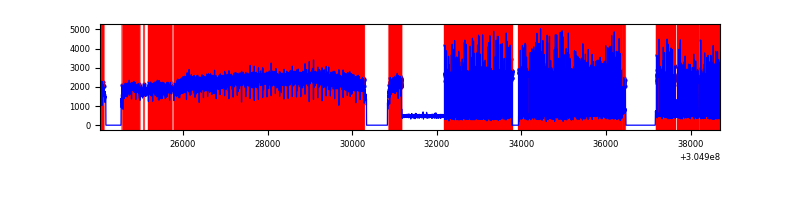 |
| B | 14652 | 12954 | 98 | 98 | 0.67% | 0.76% | 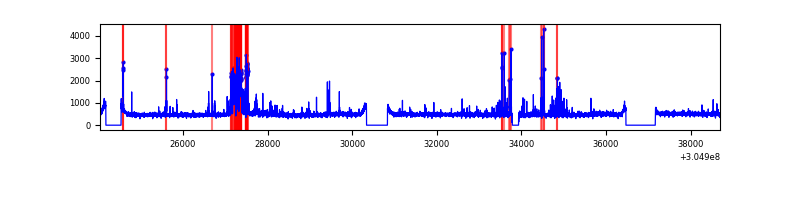 |
| C | 14652 | 12955 | 0 | 0 | 0.00% | 0.00% | 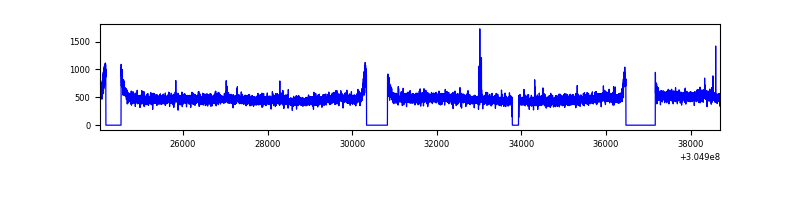 |
| D | 14652 | 12953 | 402 | 402 | 2.74% | 3.10% | 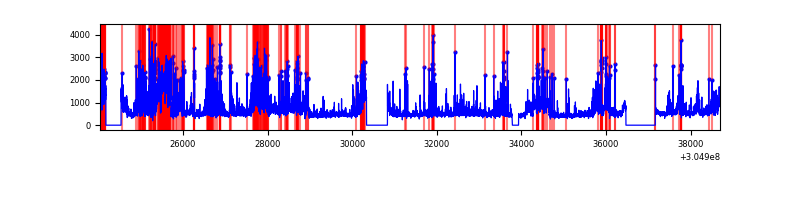 |
Top three noisy pixels from each quadrant. If the there are fewer than three noisy pixels in the level2.evt file, extra rows are filled as -1
| Pixel properties | Quadrant properties | ||||||
|---|---|---|---|---|---|---|---|
| Quadrant | DetID | PixID | Counts | Sigma | Mean | Median | Sigma |
| A | 15 | 236 | 18209423 | 73501.32 | 1225 | 1200 | 247.7 |
| A | 11 | 47 | 35852 | 139.88 | 1225 | 1200 | 247.7 |
| A | 13 | 254 | 12788 | 46.78 | 1225 | 1200 | 247.7 |
| B | 0 | 182 | 601647 | 1986.89 | 1565 | 1523 | 302.0 |
| B | 3 | 64 | 88220 | 287.04 | 1565 | 1523 | 302.0 |
| B | 12 | 111 | 36823 | 116.87 | 1565 | 1523 | 302.0 |
| C | 14 | 238 | 235235 | 654.44 | 1511 | 1517 | 357.1 |
| C | 3 | 233 | 57144 | 155.76 | 1511 | 1517 | 357.1 |
| C | 0 | 207 | 13007 | 32.17 | 1511 | 1517 | 357.1 |
| D | 7 | 238 | 2197013 | 6049.56 | 1499 | 1457 | 362.9 |
| D | 1 | 52 | 883822 | 2431.24 | 1499 | 1457 | 362.9 |
| D | 1 | 20 | 242062 | 662.96 | 1499 | 1457 | 362.9 |
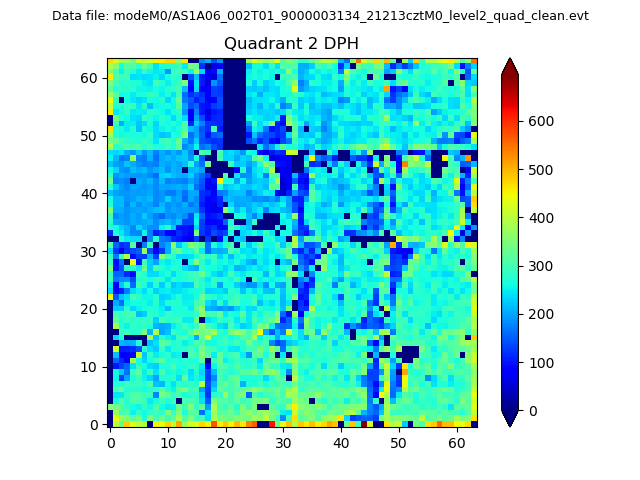
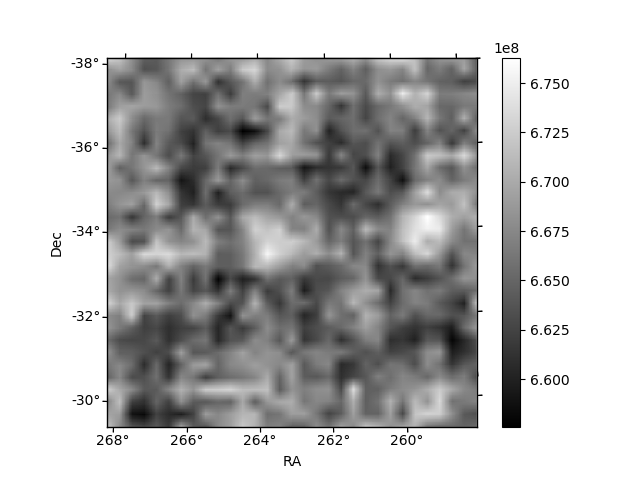
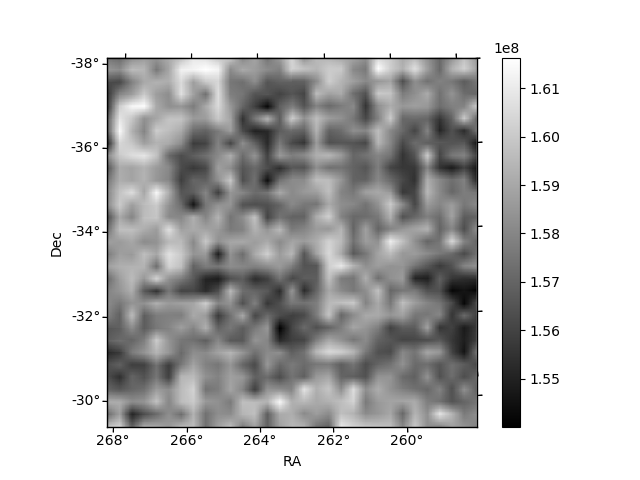
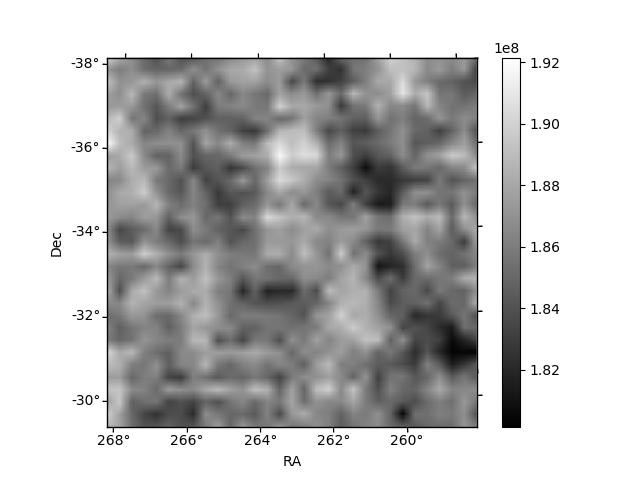
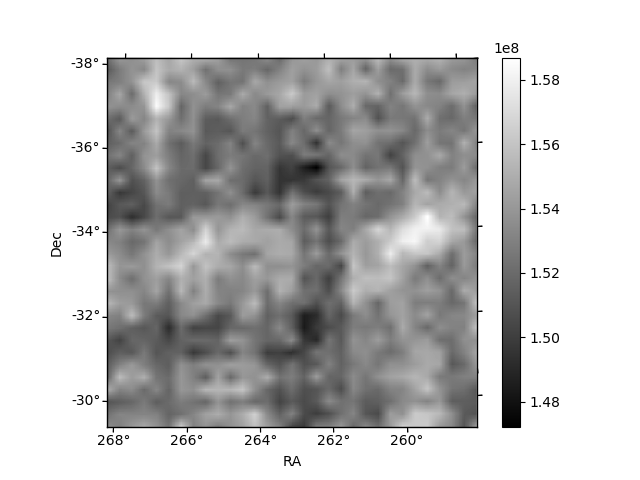
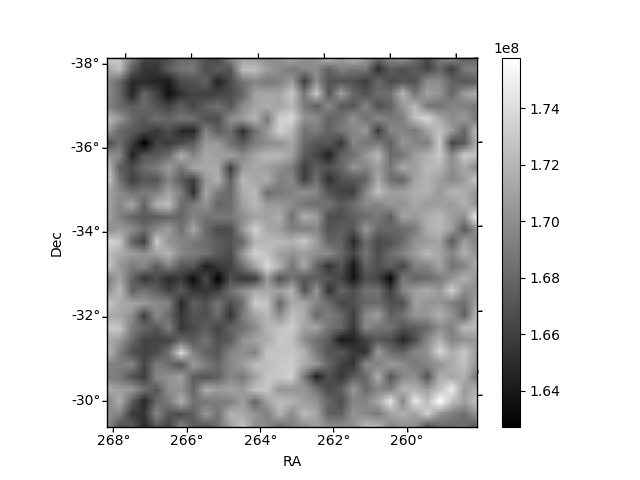
Histogram calculated using DETX and DETY for each event in the final _common_clean file
| Quadrant A | 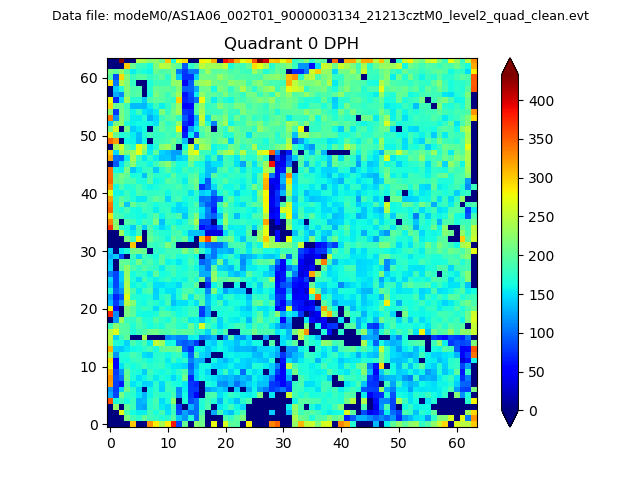 |
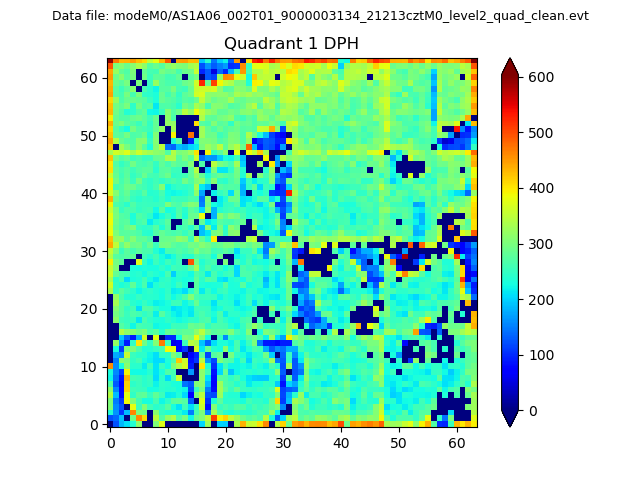 |
Quadrant B |
|---|---|---|---|
| Quadrant D | 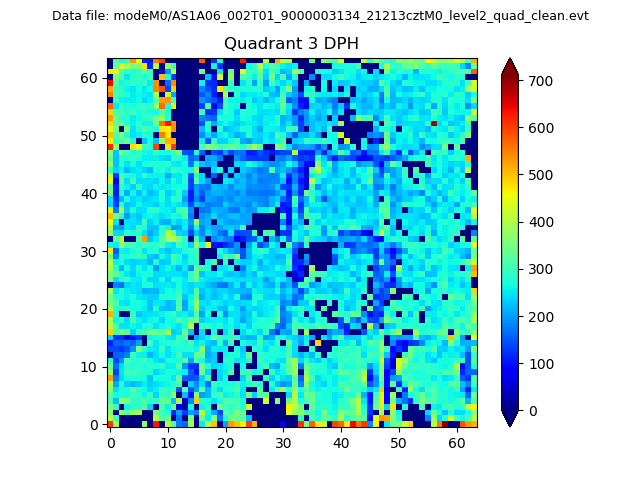 |
 |
Quadrant C |
| Plot type | Count rate plots | Images |
|---|---|---|
| Comparison with Poisson distribution Blue bars denote a histogram of data divided into 1 sec bins. Red curve is a Poisson curve with rate = median count rate of data. |
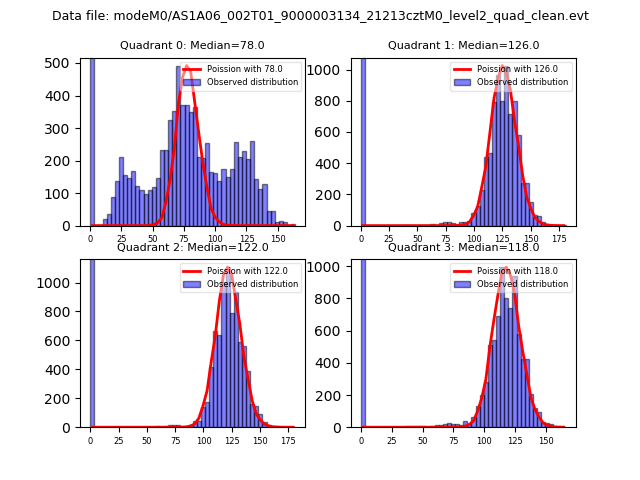 |
 |
| Quadrant-wise count rates Data is divided into 100 sec bins |
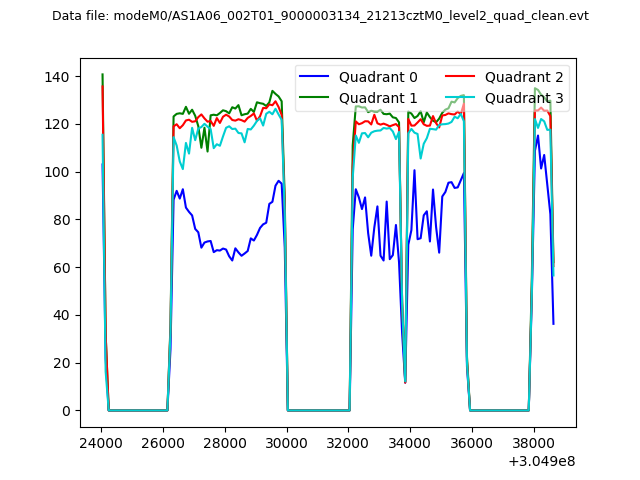 |
|
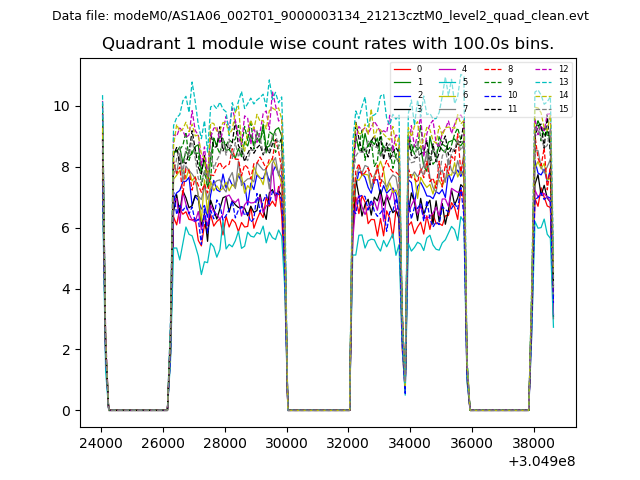
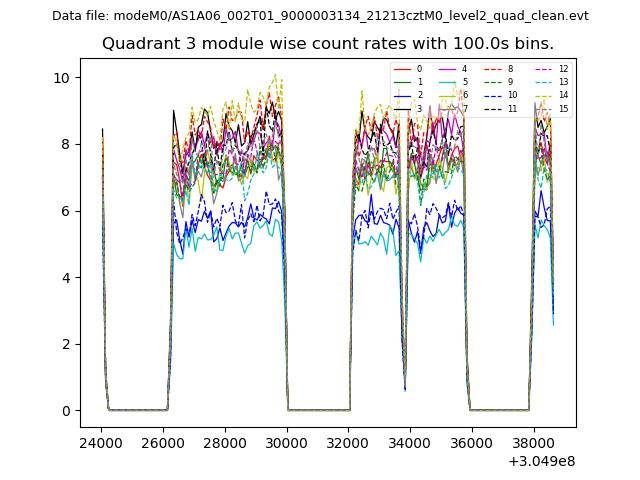
| Module-wise count rates for Quadrant A Data is divided into 100 sec bins |
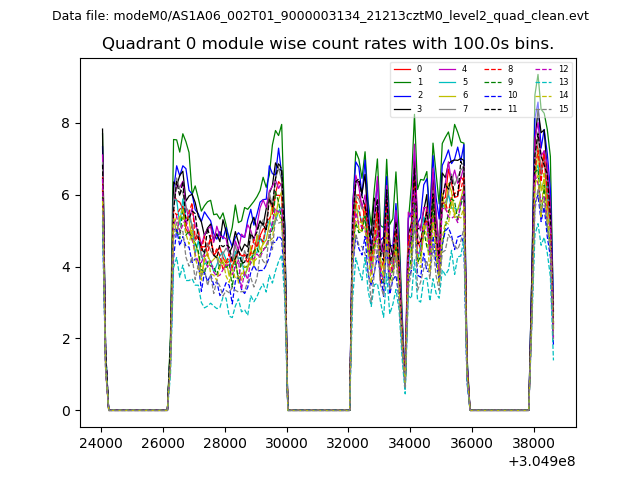 |
 |
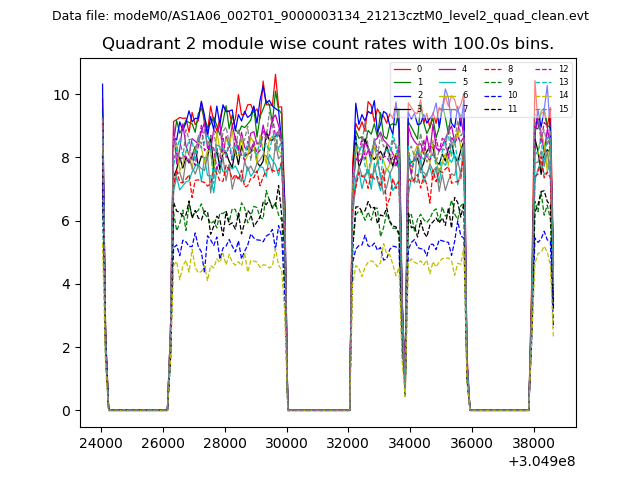
| Module-wise count rates for Quadrant B Data is divided into 100 sec bins |
 |
 |
| Module-wise count rates for Quadrant C Data is divided into 100 sec bins |
 |
 |
| Module-wise count rates for Quadrant D Data is divided into 100 sec bins |
 |
 |
| Parameter | Plot |
|---|---|
| CZT HV Monitor | 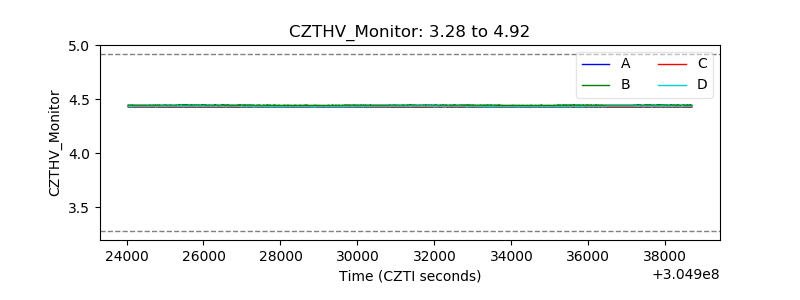 |
| D_VDD | 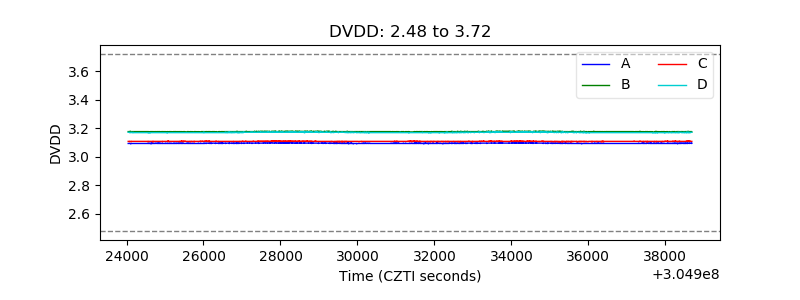 |
| Temperature 1 |  |
| Veto HV Monitor |  |
| Veto LLD | 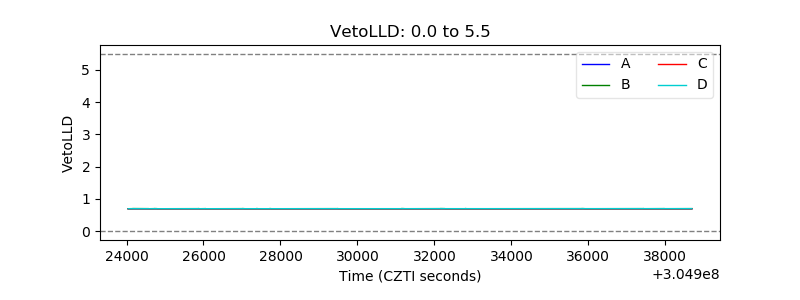 |
| Alpha Counter | 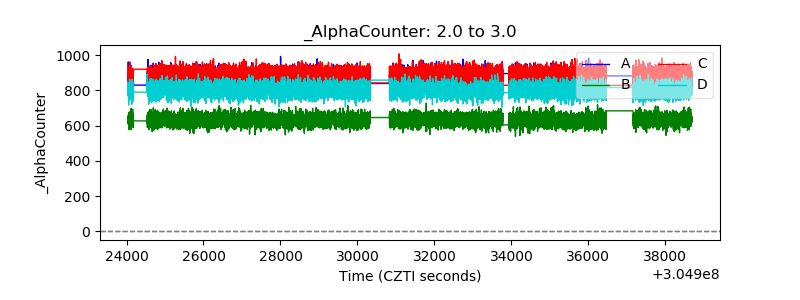 |
| _CPM_Rate | 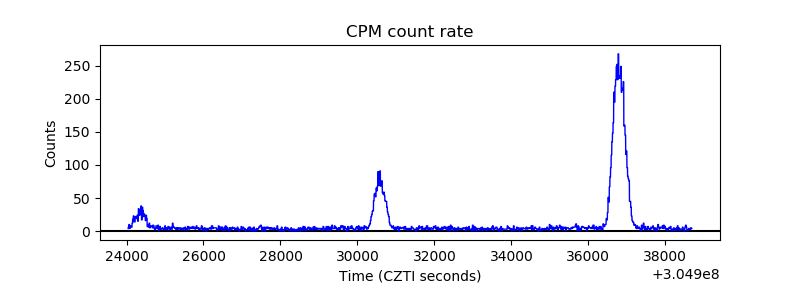 |
| CZT Counter | 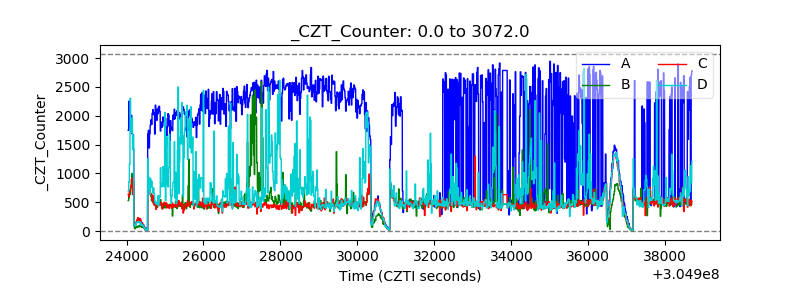 |
| +2.5 Volts monitor |  |
| +5 Volts monitor | 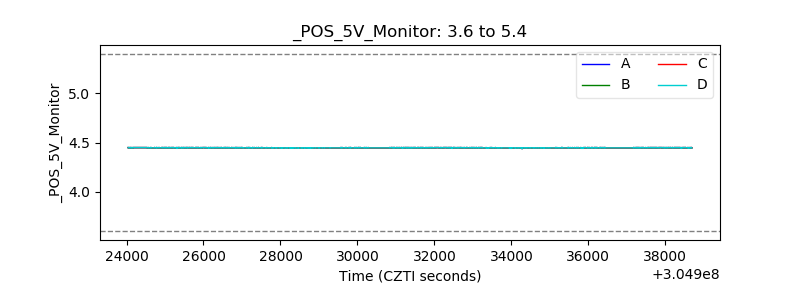 |
| _ROLL_ROT | 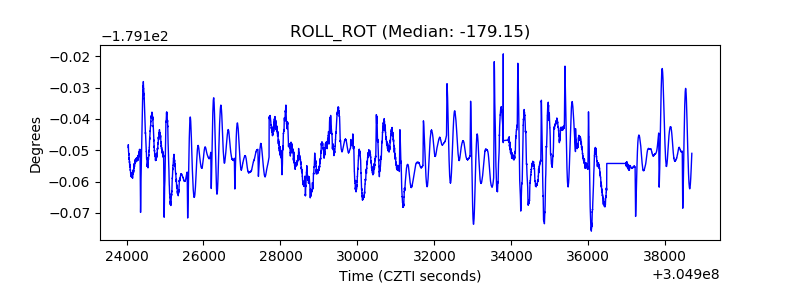 |
| _Roll_DEC | 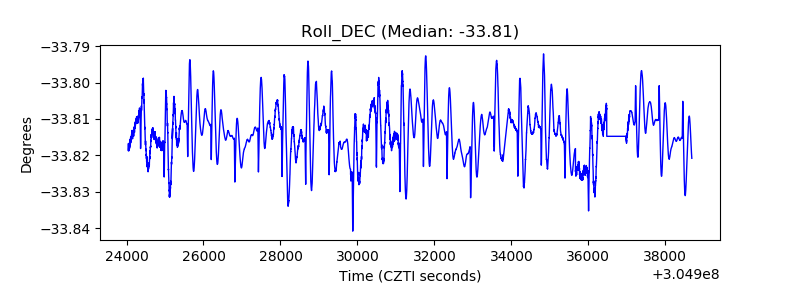 |
| _Roll_RA | 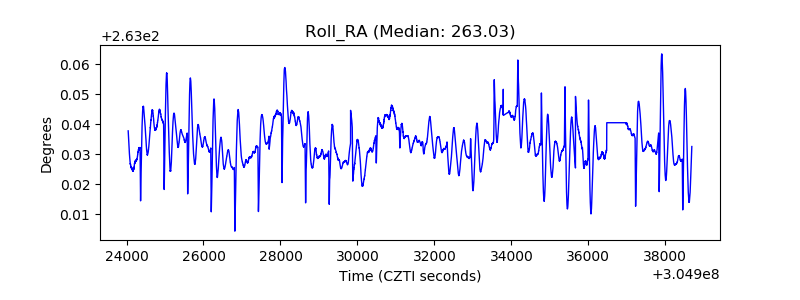 |
| Veto Counter |  |