| Param | Original file | Final file |
|---|---|---|
| Filename | modeM0/AS1A06_002T01_9000003134_21214cztM0_level2.evt | modeM0/AS1A06_002T01_9000003134_21214cztM0_level2_quad_clean.evt |
| Size (bytes) | 429,140,160 | 60,030,720 |
| Size | 409.3 MB | 57.2 MB |
| Events in quadrant A | 5,731,237 | 305,003 |
| Events in quadrant B | 1,951,130 | 420,576 |
| Events in quadrant C | 1,943,195 | 406,627 |
| Events in quadrant D | 3,086,030 | 389,680 |
| Mode SS | |||
|---|---|---|---|
| Quadrant | BADHDUFLAG | Total packets | Discarded packets |
| A | 0 | 84 | 0 |
| B | 0 | 84 | 0 |
| C | 0 | 84 | 0 |
| D | 0 | 84 | 0 |
| Mode M0 | |||
|---|---|---|---|
| Quadrant | BADHDUFLAG | Total packets | Discarded packets |
| A | 0 | 19677 | 1 |
| B | 0 | 8473 | 1 |
| C | 0 | 8489 | 1 |
| D | 0 | 11947 | 1 |
| Mode M9 | |||
|---|---|---|---|
| Quadrant | BADHDUFLAG | Total packets | Discarded packets |
| A | 0 | 4 | 0 |
| B | 0 | 5 | 0 |
| C | 0 | 5 | 0 |
| D | 0 | 5 | 0 |
| Quadrant | Total seconds | Saturated seconds | Saturation percentage |
|---|---|---|---|
| A | 4187 | 1701 | 40.625746% |
| B | 4187 | 17 | 0.406019% |
| C | 4187 | 30 | 0.716503% |
| D | 4187 | 83 | 1.982326% |
Noise dominated data is calculated using 1-second bins in cleaned event files. If a bin has >2000 counts, and if more than 50% of those come from <1% of pixels, then it is considered to be noise-dominated and hence unusable.
| Quadrant | # 1 sec bins | Bins with >0 counts | Bins with >2000 counts | High rate bins dominated by noise | Noise dominated (total time) | Noise dominated (detector-on time) | Marked lightcurve |
|---|---|---|---|---|---|---|---|
| A | 4186 | 4186 | 1554 | 1554 | 37.12% | 37.12% |  |
| B | 4187 | 4187 | 0 | 0 | 0.00% | 0.00% | 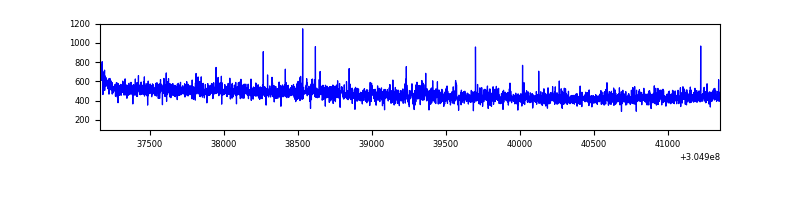 |
| C | 4187 | 4187 | 0 | 0 | 0.00% | 0.00% | 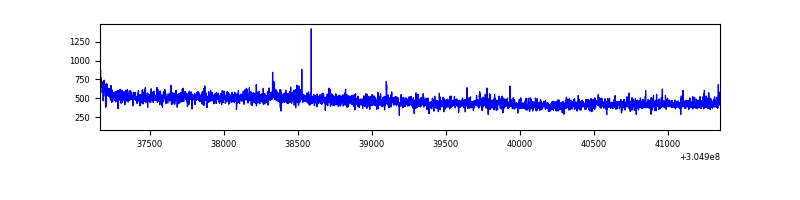 |
| D | 4187 | 4187 | 69 | 69 | 1.65% | 1.65% | 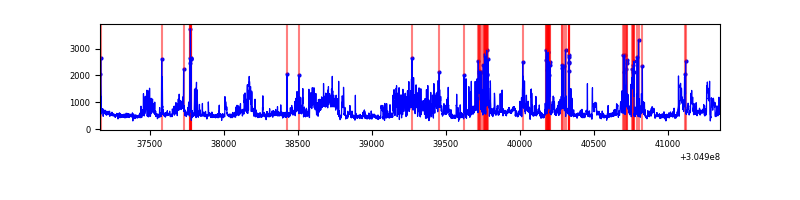 |
Top three noisy pixels from each quadrant. If the there are fewer than three noisy pixels in the level2.evt file, extra rows are filled as -1
| Pixel properties | Quadrant properties | ||||||
|---|---|---|---|---|---|---|---|
| Quadrant | DetID | PixID | Counts | Sigma | Mean | Median | Sigma |
| A | 15 | 236 | 4209018 | 52715.72 | 389 | 381 | 79.8 |
| A | 11 | 47 | 18058 | 221.42 | 389 | 381 | 79.8 |
| A | 13 | 254 | 3934 | 44.5 | 389 | 381 | 79.8 |
| B | 0 | 190 | 11324 | 112.15 | 491 | 479 | 96.7 |
| B | 12 | 111 | 11069 | 109.51 | 491 | 479 | 96.7 |
| B | 11 | 111 | 9704 | 95.4 | 491 | 479 | 96.7 |
| C | 14 | 238 | 75119 | 665.34 | 471 | 473 | 112.2 |
| C | 3 | 233 | 28553 | 250.28 | 471 | 473 | 112.2 |
| C | 13 | 61 | 3399 | 26.08 | 471 | 473 | 112.2 |
| D | 1 | 52 | 408184 | 3509.41 | 476 | 463 | 116.2 |
| D | 7 | 238 | 237692 | 2041.92 | 476 | 463 | 116.2 |
| D | 13 | 174 | 201154 | 1727.43 | 476 | 463 | 116.2 |
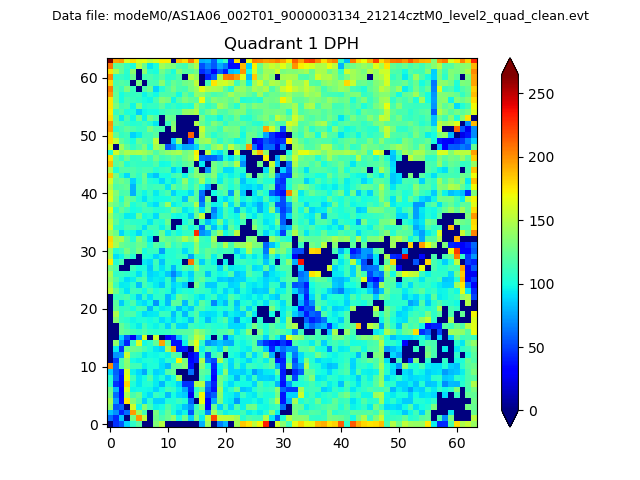
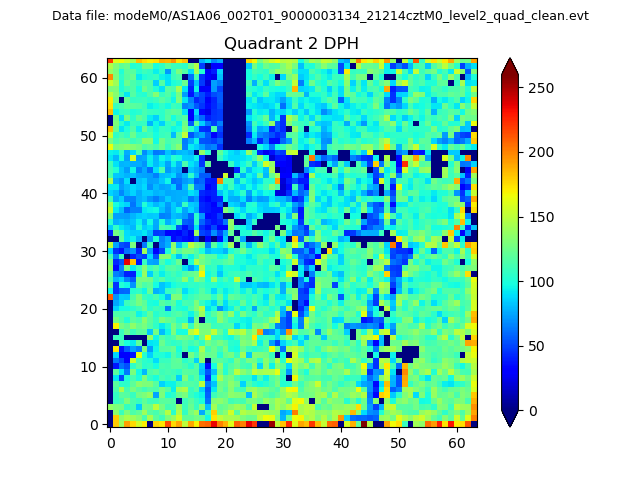
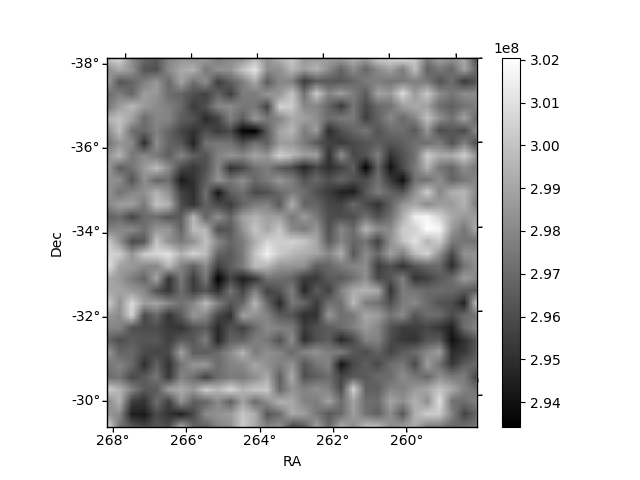
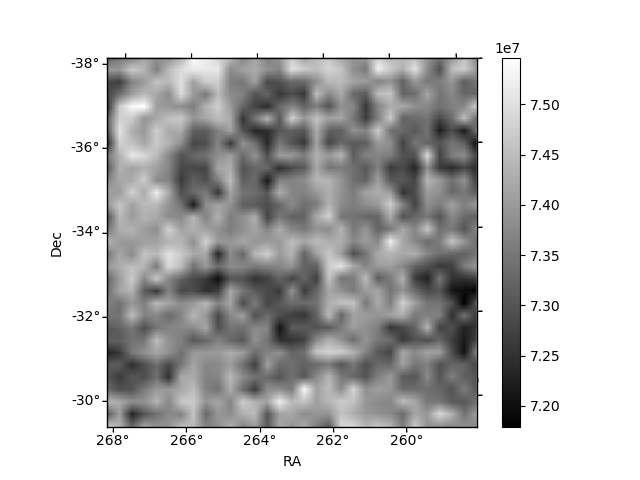
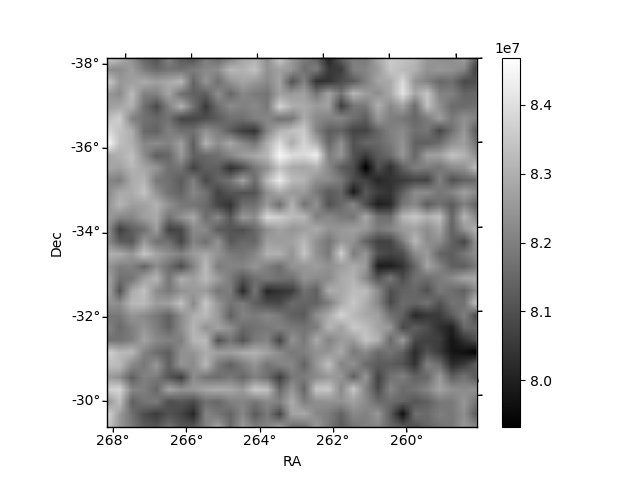
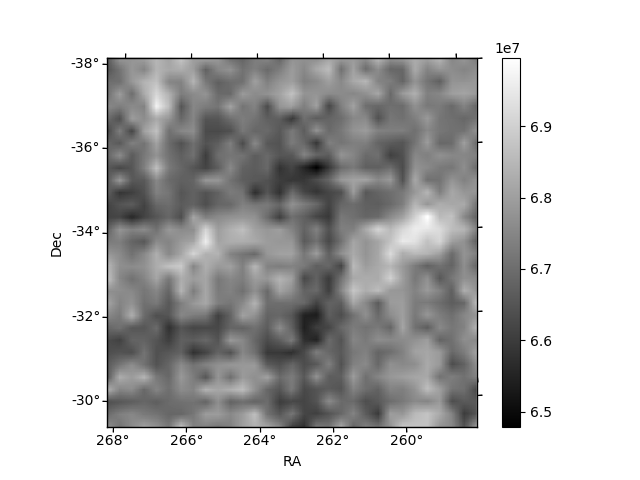
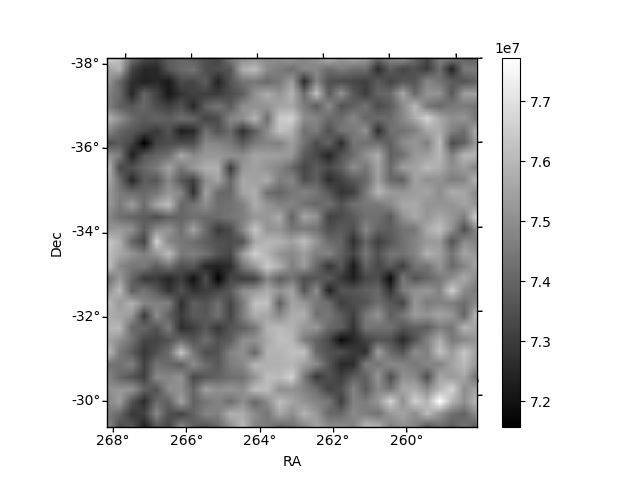
Histogram calculated using DETX and DETY for each event in the final _common_clean file
| Quadrant A | 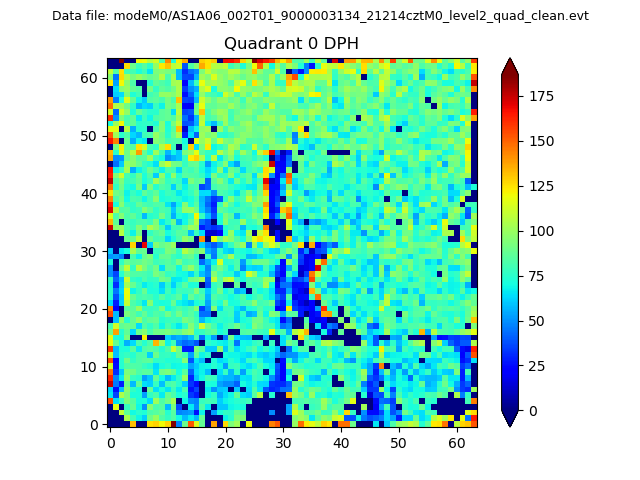 |
 |
Quadrant B |
|---|---|---|---|
| Quadrant D | 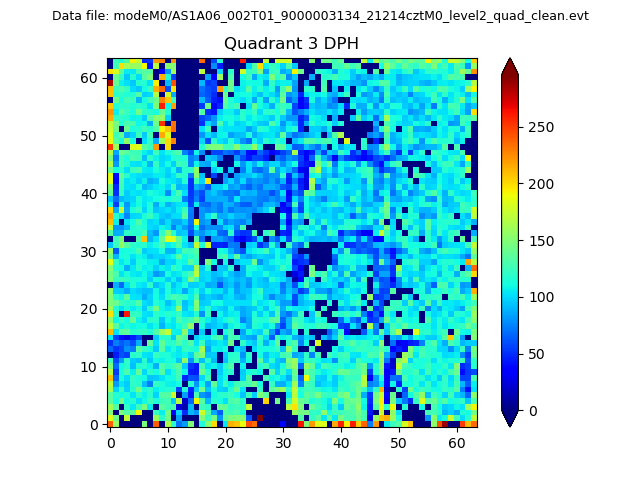 |
 |
Quadrant C |
| Plot type | Count rate plots | Images |
|---|---|---|
| Comparison with Poisson distribution Blue bars denote a histogram of data divided into 1 sec bins. Red curve is a Poisson curve with rate = median count rate of data. |
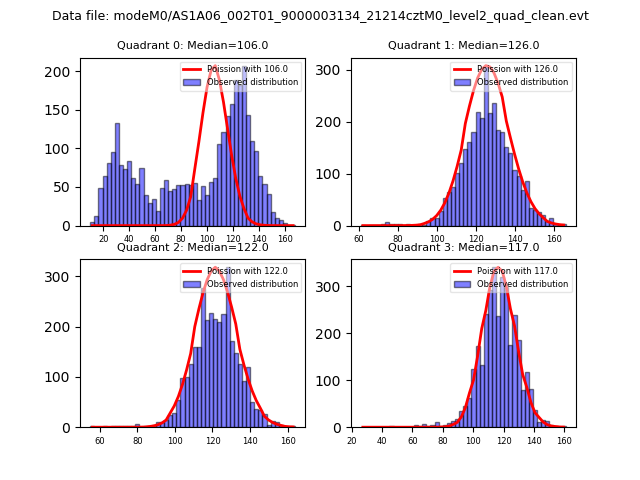 |
 |
| Quadrant-wise count rates Data is divided into 100 sec bins |
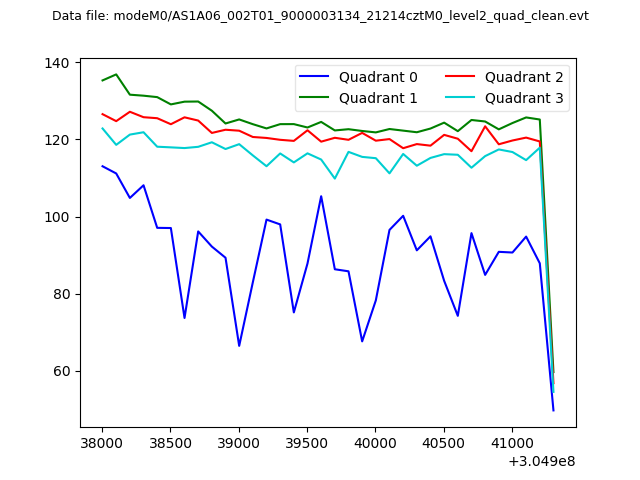 |
|
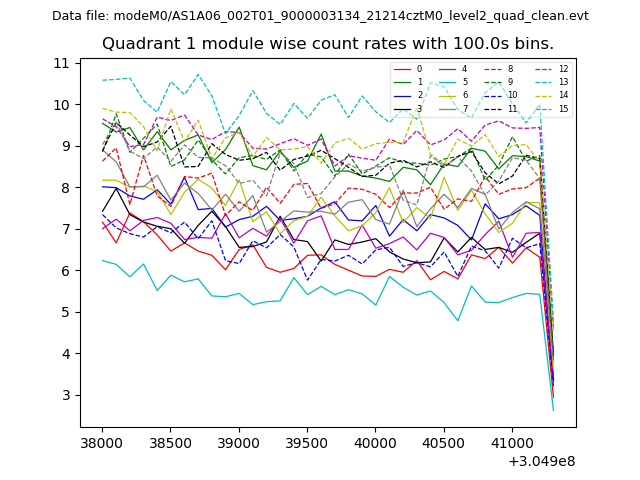
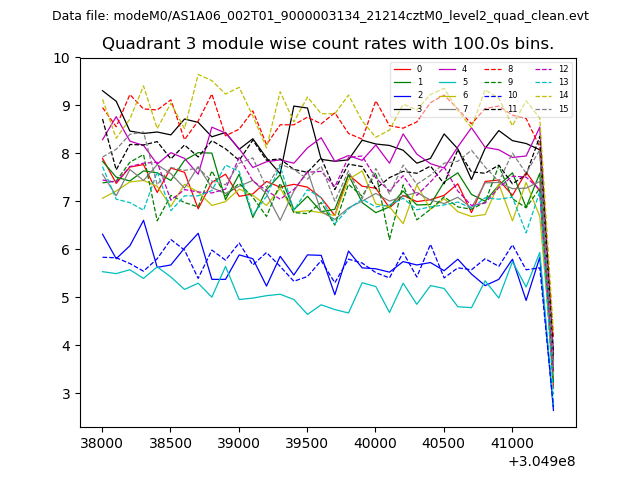
| Module-wise count rates for Quadrant A Data is divided into 100 sec bins |
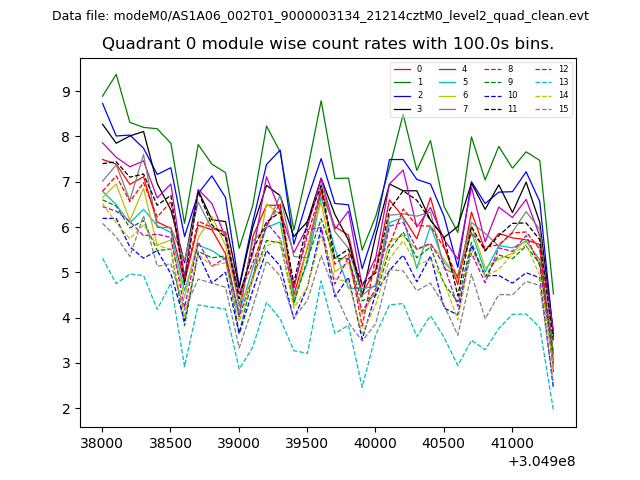 |
 |
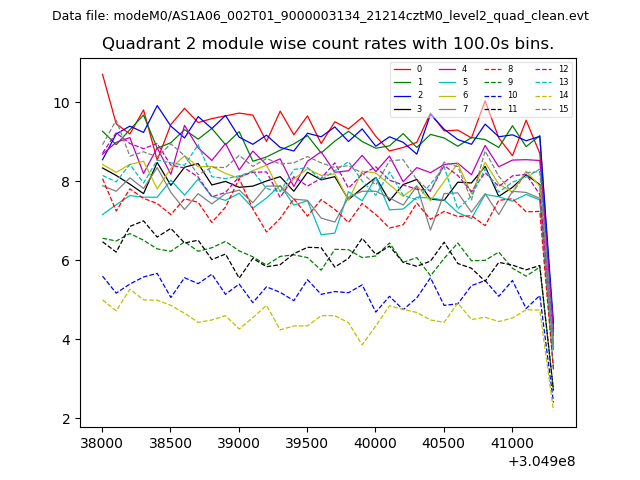
| Module-wise count rates for Quadrant B Data is divided into 100 sec bins |
 |
 |
| Module-wise count rates for Quadrant C Data is divided into 100 sec bins |
 |
 |
| Module-wise count rates for Quadrant D Data is divided into 100 sec bins |
 |
 |
| Parameter | Plot |
|---|---|
| CZT HV Monitor | 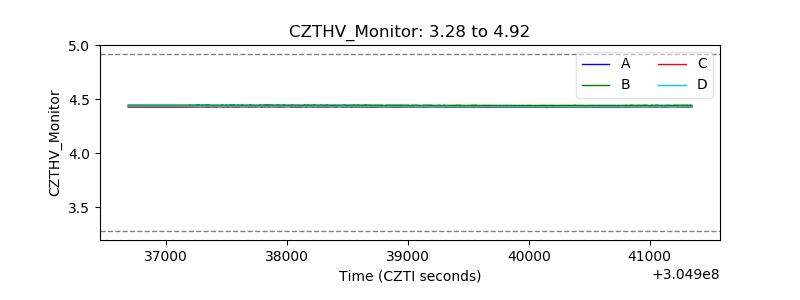 |
| D_VDD |  |
| Temperature 1 | 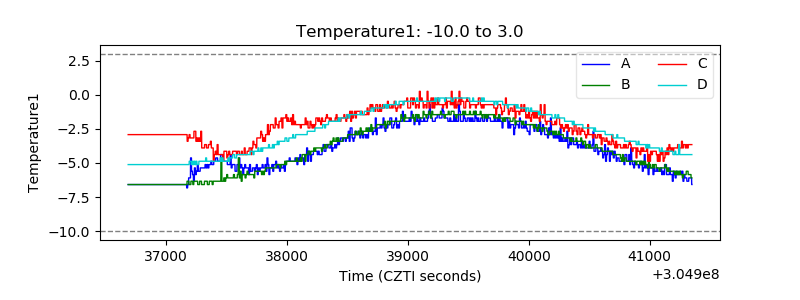 |
| Veto HV Monitor | 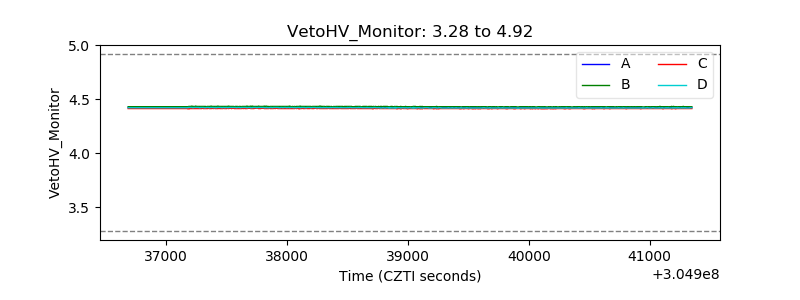 |
| Veto LLD | 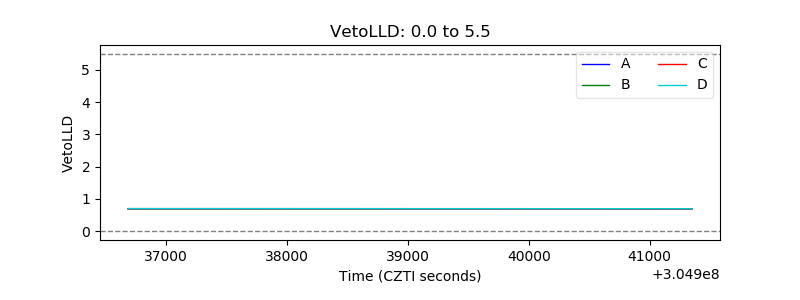 |
| Alpha Counter | 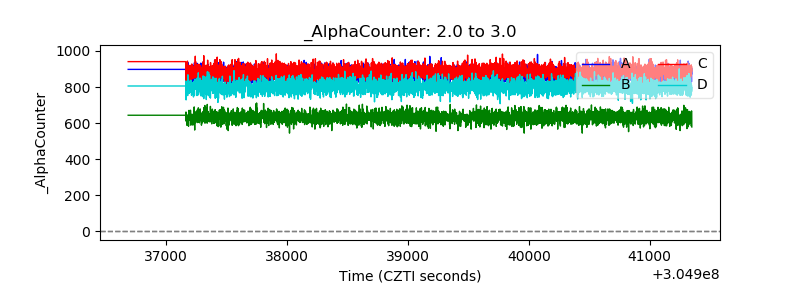 |
| _CPM_Rate | 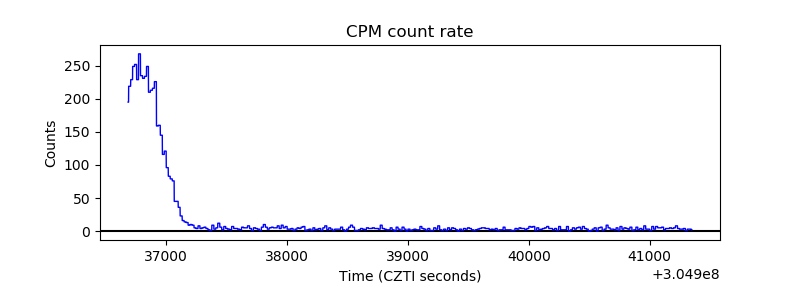 |
| CZT Counter | 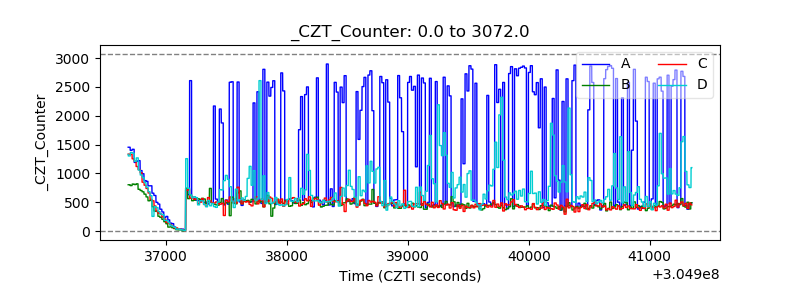 |
| +2.5 Volts monitor |  |
| +5 Volts monitor |  |
| _ROLL_ROT | 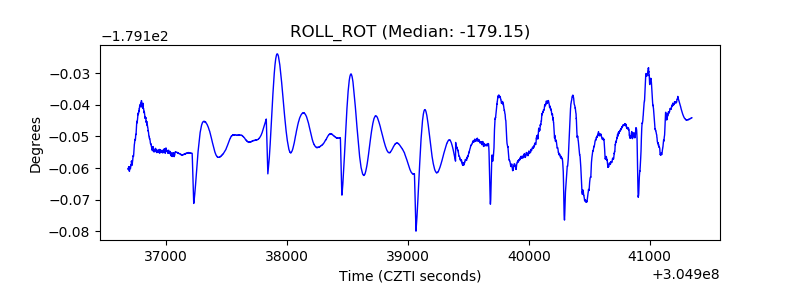 |
| _Roll_DEC | 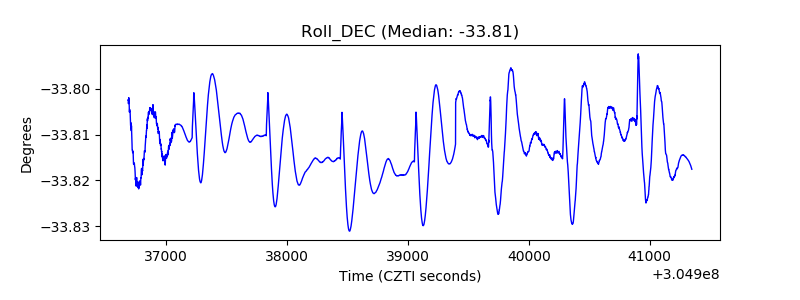 |
| _Roll_RA | 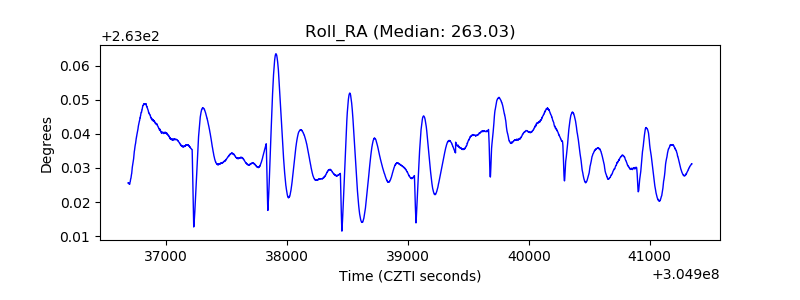 |
| Veto Counter | 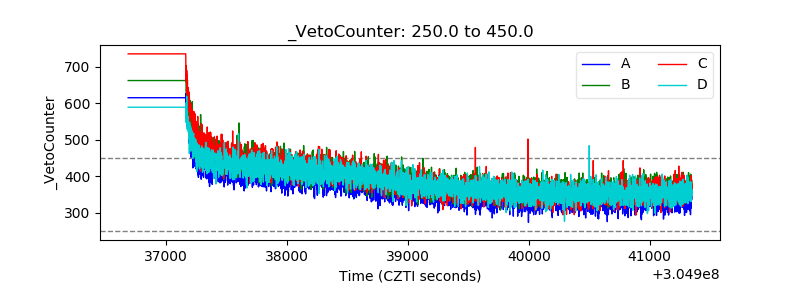 |