| Param | Original file | Final file |
|---|---|---|
| Filename | modeM0/AS1A06_005T05_9000003136cztM0_level2.fits | modeM0/AS1A06_005T05_9000003136cztM0_level2_quad_clean.evt |
| Size (bytes) | 619,974,720 | 526,227,840 |
| Size | 591.3 MB | 501.8 MB |
| Events in quadrant A | 3,535,550 | 2,507,790 |
| Events in quadrant B | 3,770,426 | 3,218,667 |
| Events in quadrant C | 3,793,796 | 3,100,124 |
| Events in quadrant D | 3,238,806 | 2,677,104 |
| Mode M9 | |||
|---|---|---|---|
| Quadrant | BADHDUFLAG | Total packets | Discarded packets |
| A | 0 | 109 | 0 |
| B | 0 | 109 | 0 |
| C | 0 | 109 | 0 |
| D | 0 | 109 | 0 |
| Mode M0 | |||
|---|---|---|---|
| Quadrant | BADHDUFLAG | Total packets | Discarded packets |
| A | 0 | 216860 | 0 |
| B | 0 | 138265 | 0 |
| C | 0 | 140782 | 0 |
| D | 0 | 188797 | 0 |
| Mode SS | |||
|---|---|---|---|
| Quadrant | BADHDUFLAG | Total packets | Discarded packets |
| A | 0 | 1316 | 0 |
| B | 0 | 1316 | 0 |
| C | 0 | 1316 | 0 |
| D | 0 | 1316 | 0 |
| Quadrant | Total seconds | Saturated seconds | Saturation percentage |
|---|---|---|---|
| A | 64612 | 10655 | 16.490745% |
| B | 64612 | 791 | 1.224231% |
| C | 64612 | 1413 | 2.186900% |
| D | 64612 | 3635 | 5.625890% |
Noise dominated data is calculated using 1-second bins in cleaned event files. If a bin has >2000 counts, and if more than 50% of those come from <1% of pixels, then it is considered to be noise-dominated and hence unusable.
| Quadrant | # 1 sec bins | Bins with >0 counts | Bins with >2000 counts | High rate bins dominated by noise | Noise dominated (total time) | Noise dominated (detector-on time) | Marked lightcurve |
|---|---|---|---|---|---|---|---|
| A | 75538 | 64249 | 0 | 0 | 0.00% | 0.00% |  |
| B | 75538 | 64606 | 0 | 0 | 0.00% | 0.00% |  |
| C | 75538 | 64606 | 0 | 0 | 0.00% | 0.00% |  |
| D | 75538 | 64589 | 0 | 0 | 0.00% | 0.00% |  |
Top three noisy pixels from each quadrant. If the there are fewer than three noisy pixels in the level2.evt file, extra rows are filled as -1
| Pixel properties | Quadrant properties | ||||||
|---|---|---|---|---|---|---|---|
| Quadrant | DetID | PixID | Counts | Sigma | Mean | Median | Sigma |
| A | 0 | 29 | 3378 | 11.16 | 922 | 868 | 225.0 |
| A | 7 | 110 | 2850 | 8.81 | 922 | 868 | 225.0 |
| A | 9 | 19 | 2759 | 8.41 | 922 | 868 | 225.0 |
| B | 2 | 9 | 2997 | 10.34 | 1000 | 957 | 197.4 |
| B | 14 | 254 | 2547 | 8.06 | 1000 | 957 | 197.4 |
| B | 2 | 8 | 2514 | 7.89 | 1000 | 957 | 197.4 |
| C | 12 | 241 | 2679 | 6.74 | 1002 | 934 | 259.0 |
| C | 2 | 191 | 2558 | 6.27 | 1002 | 934 | 259.0 |
| C | 9 | 209 | 2546 | 6.22 | 1002 | 934 | 259.0 |
| D | 3 | 14 | 2364 | 6.18 | 926 | 843 | 246.2 |
| D | 6 | 231 | 2322 | 6.01 | 926 | 843 | 246.2 |
| D | 6 | 38 | 2302 | 5.93 | 926 | 843 | 246.2 |
Histogram calculated using DETX and DETY for each event in the final _common_clean file
| Quadrant A |  |
 |
Quadrant B |
|---|---|---|---|
| Quadrant D |  |
 |
Quadrant C |
| Plot type | Count rate plots | Images |
|---|---|---|
| Comparison with Poisson distribution Blue bars denote a histogram of data divided into 1 sec bins. Red curve is a Poisson curve with rate = median count rate of data. |
 |
 |
| Quadrant-wise count rates Data is divided into 100 sec bins |
 |
|
| Module-wise count rates for Quadrant A Data is divided into 100 sec bins |
 |
 |
| Module-wise count rates for Quadrant B Data is divided into 100 sec bins |
 |
 |
| Module-wise count rates for Quadrant C Data is divided into 100 sec bins |
 |
 |
| Module-wise count rates for Quadrant D Data is divided into 100 sec bins |
 |
 |
| Parameter | Plot |
|---|---|
| CZT HV Monitor |  |
| D_VDD | 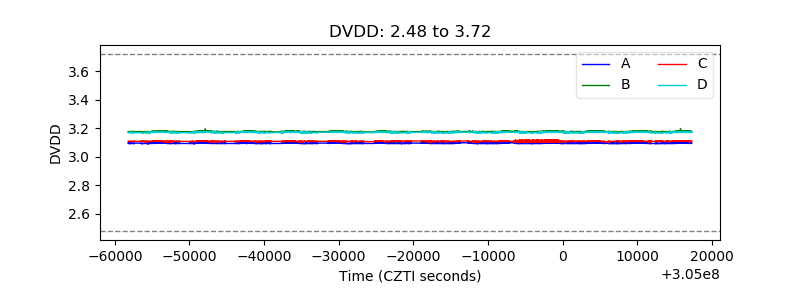 |
| Temperature 1 |  |
| Veto HV Monitor |  |
| Veto LLD |  |
| Alpha Counter |  |
| _CPM_Rate |  |
| CZT Counter |  |
| +2.5 Volts monitor |  |
| +5 Volts monitor |  |
| _ROLL_ROT |  |
| _Roll_DEC |  |
| _Roll_RA |  |
| Veto Counter |  |