| Param | Original file | Final file |
|---|---|---|
| Filename | modeM0/AS1A06_005T05_9000003136_21214cztM0_level2.evt | modeM0/AS1A06_005T05_9000003136_21214cztM0_level2_quad_clean.evt |
| Size (bytes) | 227,514,240 | 24,048,000 |
| Size | 217.0 MB | 22.9 MB |
| Events in quadrant A | 1,786,341 | 139,614 |
| Events in quadrant B | 1,217,998 | 148,348 |
| Events in quadrant C | 1,203,467 | 141,792 |
| Events in quadrant D | 2,527,075 | 134,914 |
| Mode M9 | |||
|---|---|---|---|
| Quadrant | BADHDUFLAG | Total packets | Discarded packets |
| A | 0 | 9 | 0 |
| B | 0 | 9 | 0 |
| C | 0 | 9 | 0 |
| D | 0 | 9 | 0 |
| Mode M0 | |||
|---|---|---|---|
| Quadrant | BADHDUFLAG | Total packets | Discarded packets |
| A | 0 | 6617 | 1 |
| B | 0 | 4868 | 1 |
| C | 0 | 4837 | 1 |
| D | 0 | 9002 | 1 |
| Mode SS | |||
|---|---|---|---|
| Quadrant | BADHDUFLAG | Total packets | Discarded packets |
| A | 0 | 46 | 0 |
| B | 0 | 46 | 0 |
| C | 0 | 46 | 0 |
| D | 0 | 46 | 0 |
| Quadrant | Total seconds | Saturated seconds | Saturation percentage |
|---|---|---|---|
| A | 2262 | 286 | 12.643678% |
| B | 2262 | 47 | 2.077807% |
| C | 2262 | 74 | 3.271441% |
| D | 2262 | 564 | 24.933687% |
Noise dominated data is calculated using 1-second bins in cleaned event files. If a bin has >2000 counts, and if more than 50% of those come from <1% of pixels, then it is considered to be noise-dominated and hence unusable.
| Quadrant | # 1 sec bins | Bins with >0 counts | Bins with >2000 counts | High rate bins dominated by noise | Noise dominated (total time) | Noise dominated (detector-on time) | Marked lightcurve |
|---|---|---|---|---|---|---|---|
| A | 3172 | 2262 | 216 | 216 | 6.81% | 9.55% | 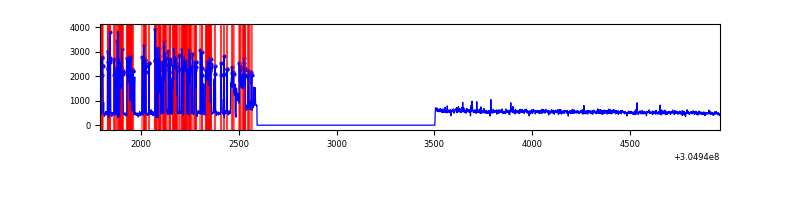 |
| B | 3172 | 2262 | 1 | 1 | 0.03% | 0.04% | 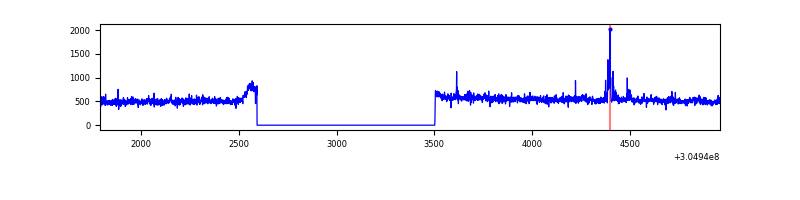 |
| C | 3172 | 2262 | 0 | 0 | 0.00% | 0.00% | 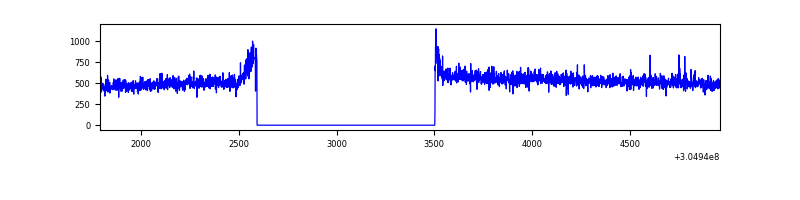 |
| D | 3172 | 2262 | 430 | 430 | 13.56% | 19.01% | 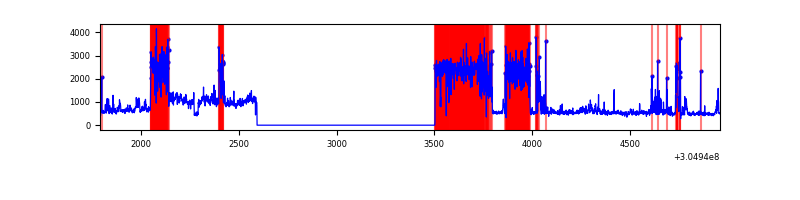 |
Top three noisy pixels from each quadrant. If the there are fewer than three noisy pixels in the level2.evt file, extra rows are filled as -1
| Pixel properties | Quadrant properties | ||||||
|---|---|---|---|---|---|---|---|
| Quadrant | DetID | PixID | Counts | Sigma | Mean | Median | Sigma |
| A | 15 | 236 | 634594 | 10383.76 | 294 | 288 | 61.1 |
| A | 11 | 47 | 11489 | 183.36 | 294 | 288 | 61.1 |
| A | 5 | 16 | 7476 | 117.67 | 294 | 288 | 61.1 |
| B | 0 | 244 | 12702 | 206.82 | 302 | 295 | 60.0 |
| B | 0 | 197 | 7452 | 119.3 | 302 | 295 | 60.0 |
| B | 12 | 111 | 7128 | 113.9 | 302 | 295 | 60.0 |
| C | 14 | 238 | 45254 | 632.86 | 292 | 293 | 71.0 |
| C | 3 | 233 | 16459 | 227.55 | 292 | 293 | 71.0 |
| C | 13 | 61 | 2063 | 24.91 | 292 | 293 | 71.0 |
| D | 1 | 52 | 973604 | 14750.8 | 266 | 259 | 66.0 |
| D | 13 | 174 | 288254 | 4364.49 | 266 | 259 | 66.0 |
| D | 7 | 238 | 192566 | 2914.36 | 266 | 259 | 66.0 |
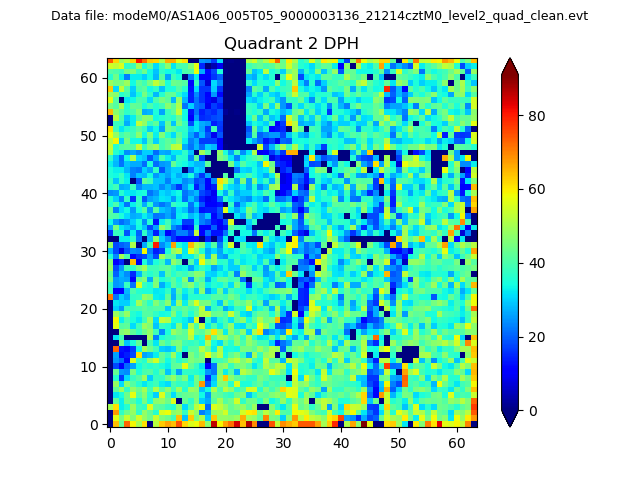
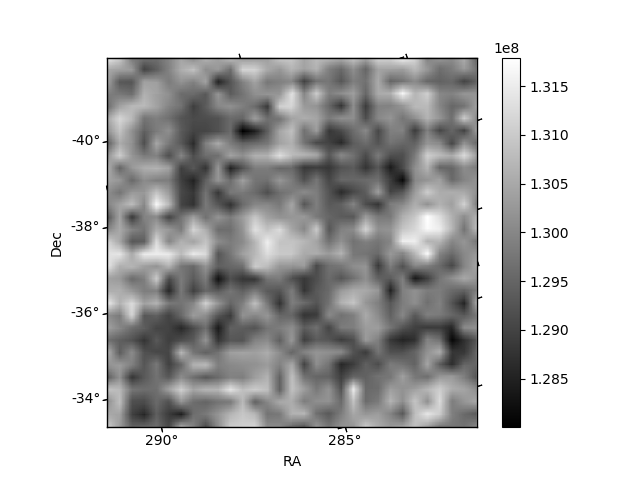
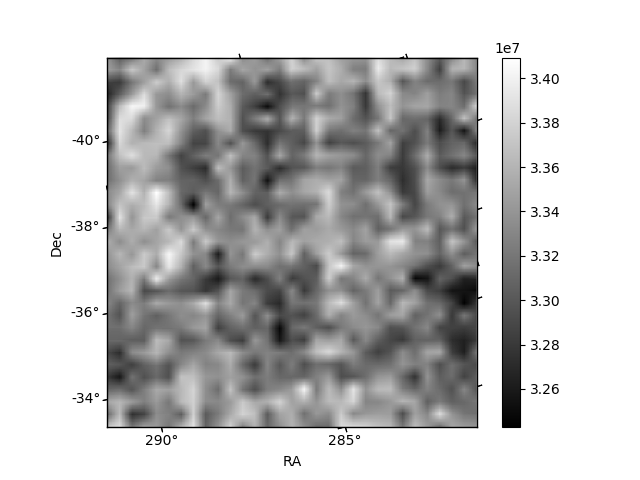
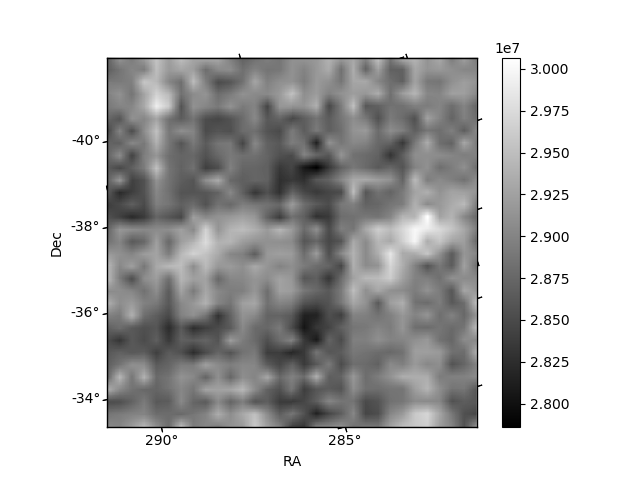
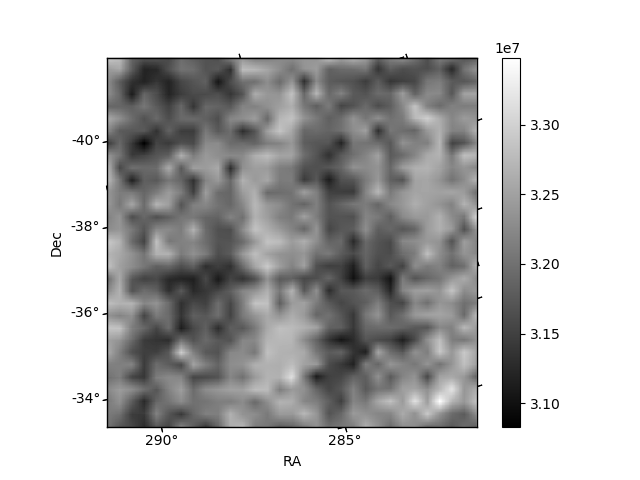
Histogram calculated using DETX and DETY for each event in the final _common_clean file
| Quadrant A | 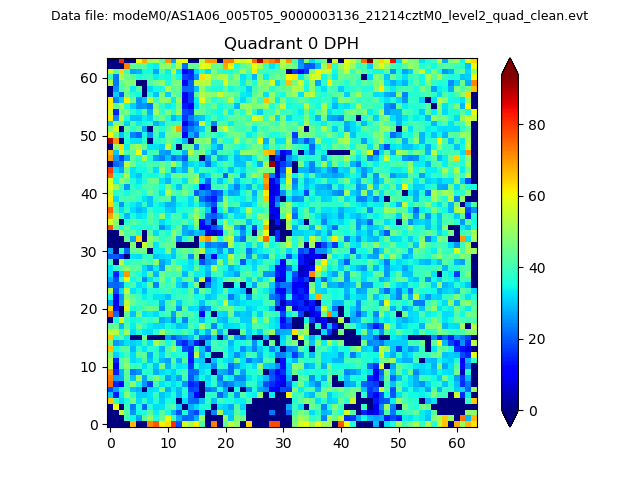 |
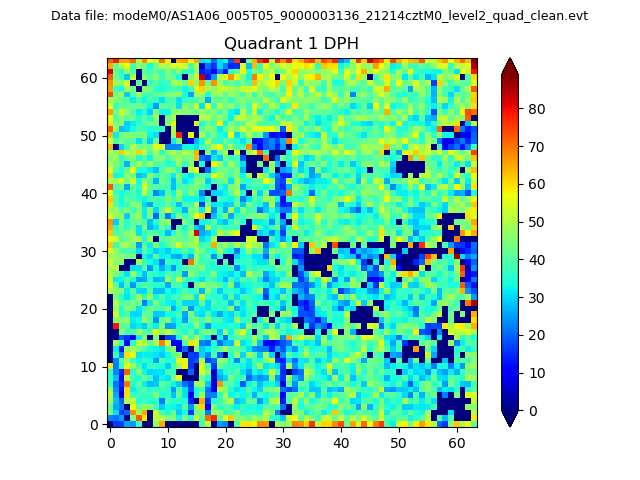 |
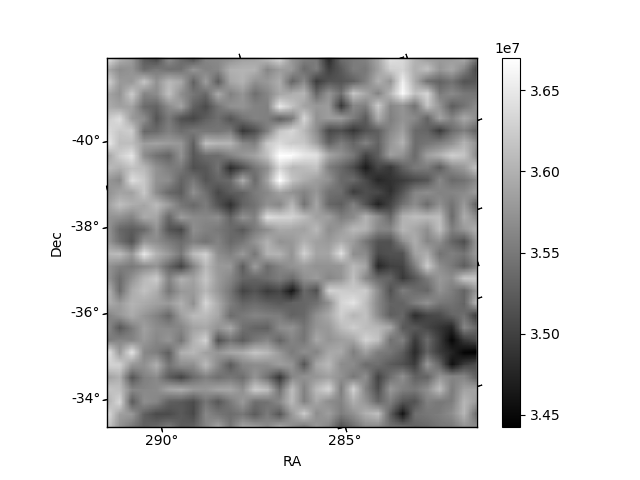
Quadrant B |
|---|---|---|---|
| Quadrant D | 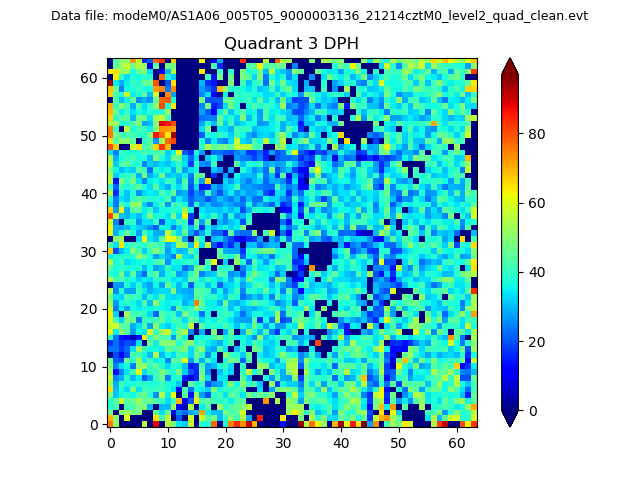 |
 |
Quadrant C |
| Plot type | Count rate plots | Images |
|---|---|---|
| Comparison with Poisson distribution Blue bars denote a histogram of data divided into 1 sec bins. Red curve is a Poisson curve with rate = median count rate of data. |
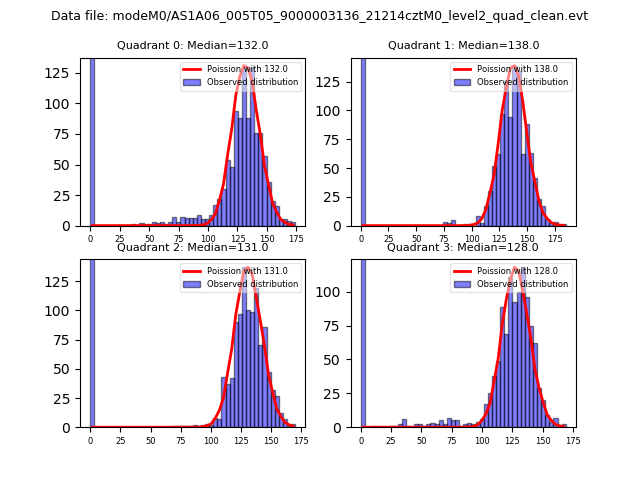 |
 |
| Quadrant-wise count rates Data is divided into 100 sec bins |
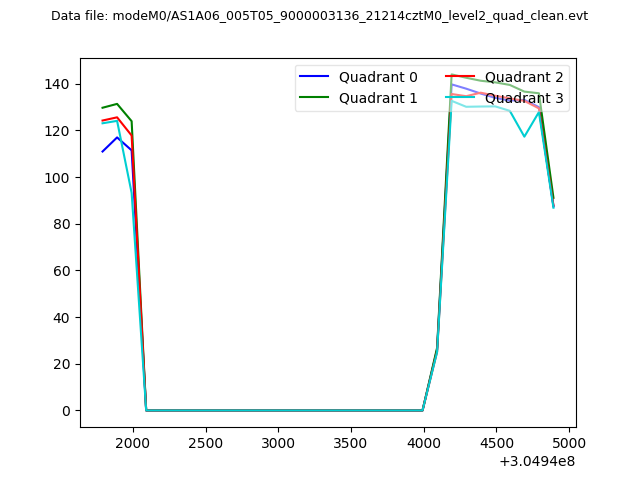 |
|
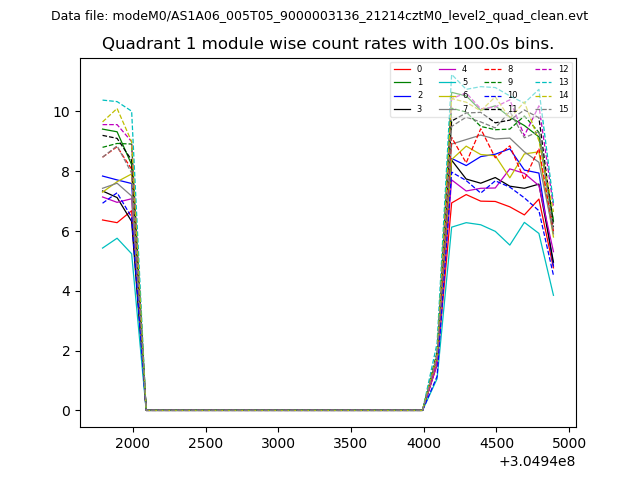
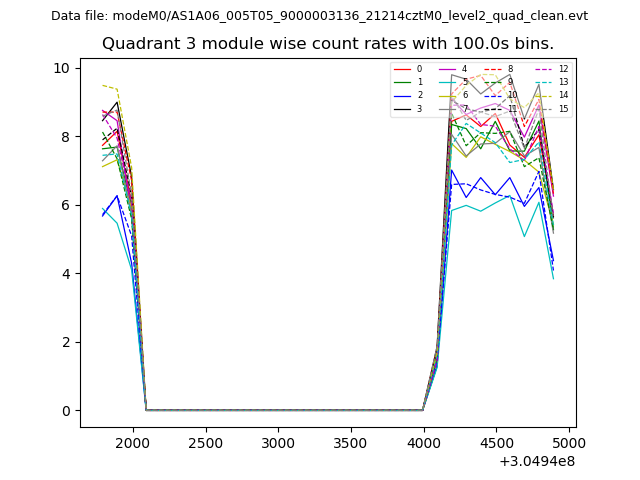
| Module-wise count rates for Quadrant A Data is divided into 100 sec bins |
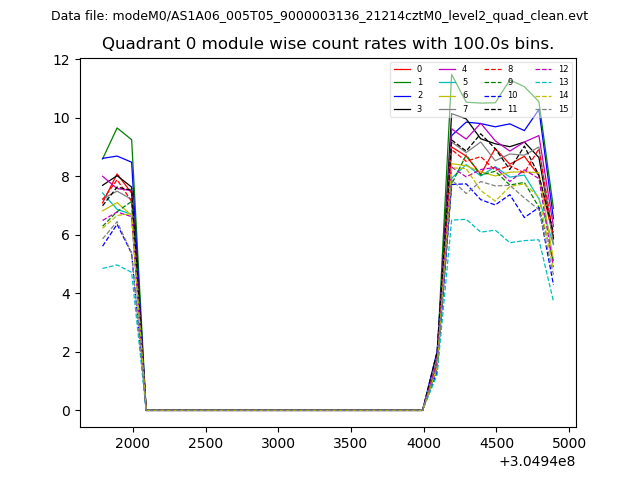 |
 |
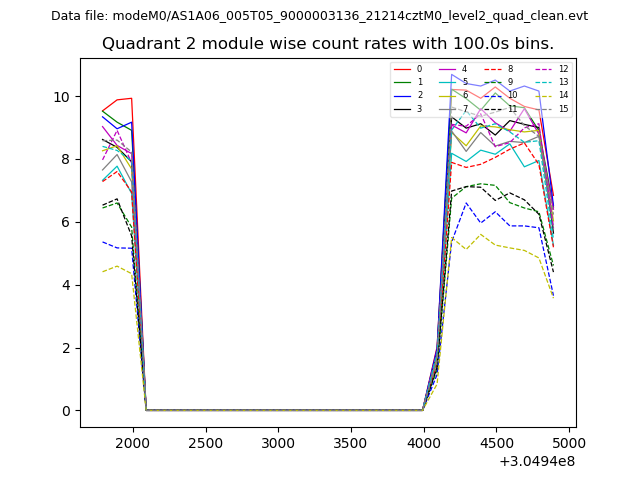
| Module-wise count rates for Quadrant B Data is divided into 100 sec bins |
 |
 |
| Module-wise count rates for Quadrant C Data is divided into 100 sec bins |
 |
 |
| Module-wise count rates for Quadrant D Data is divided into 100 sec bins |
 |
 |
| Parameter | Plot |
|---|---|
| CZT HV Monitor | 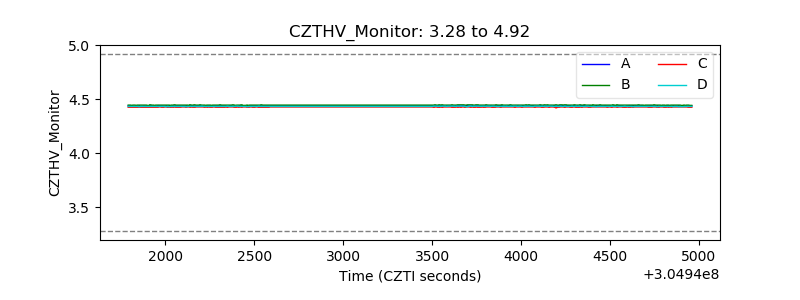 |
| D_VDD | 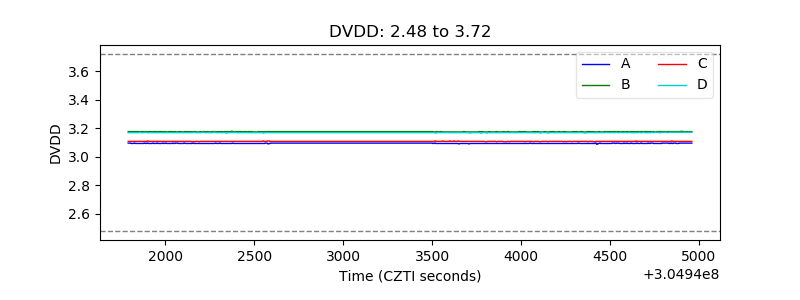 |
| Temperature 1 | 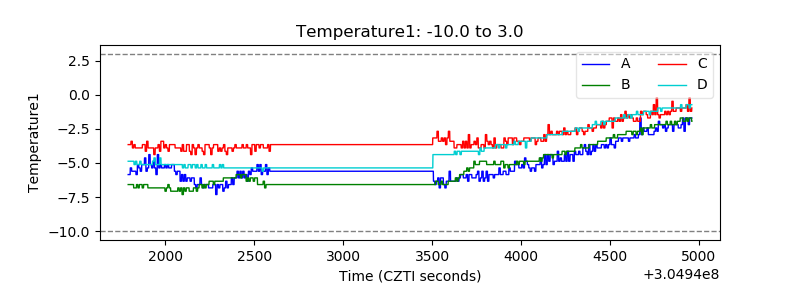 |
| Veto HV Monitor | 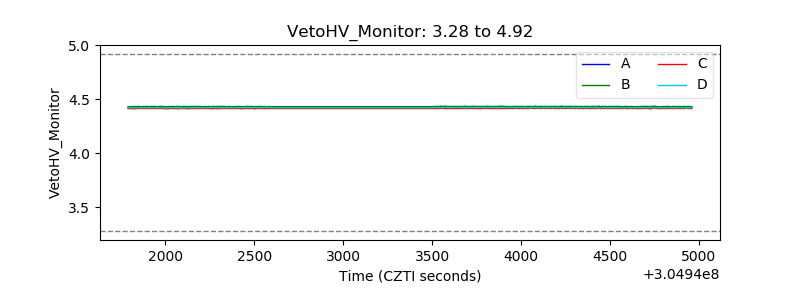 |
| Veto LLD | 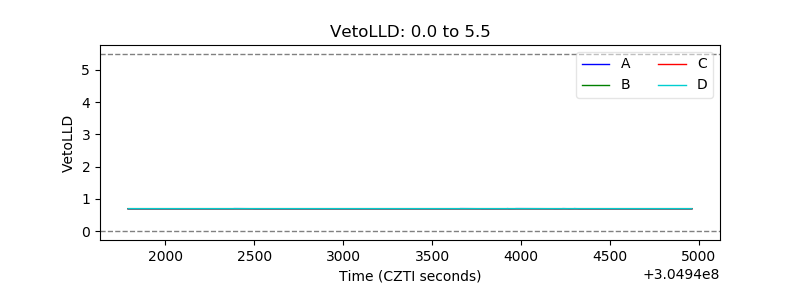 |
| Alpha Counter | 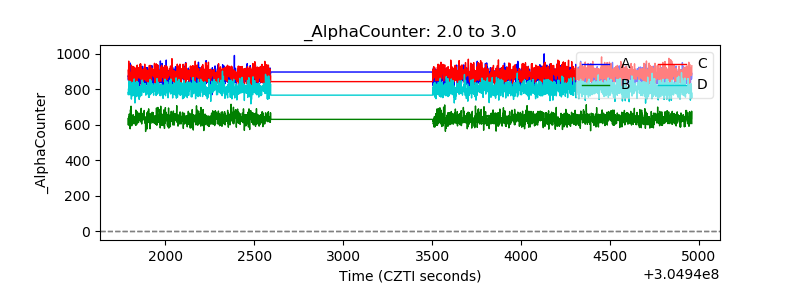 |
| _CPM_Rate | 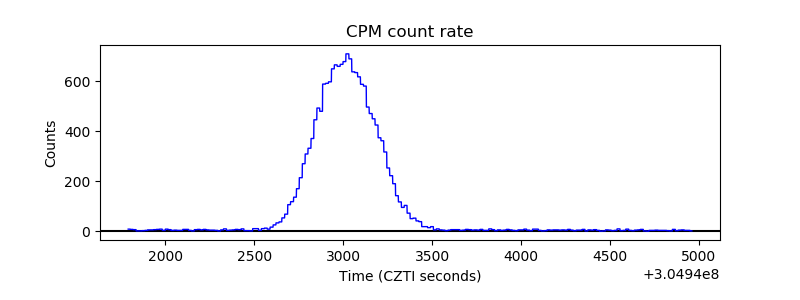 |
| CZT Counter | 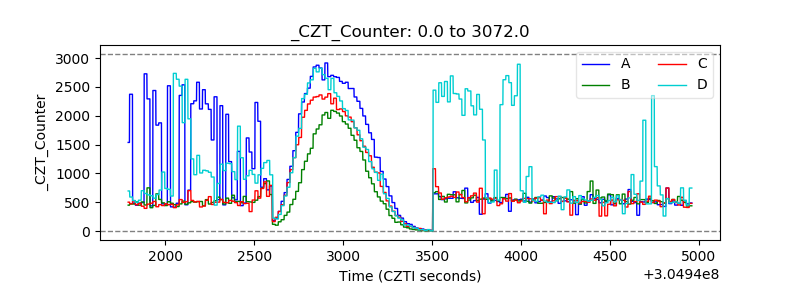 |
| +2.5 Volts monitor | 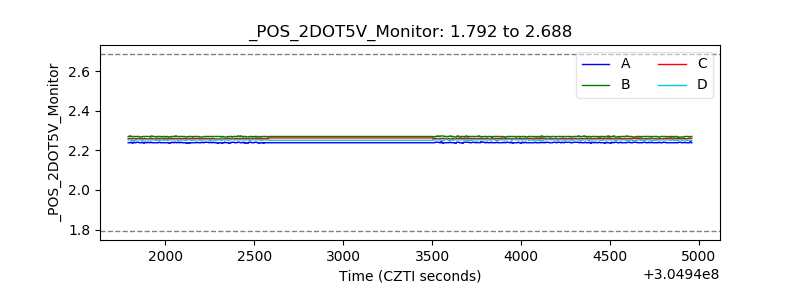 |
| +5 Volts monitor | 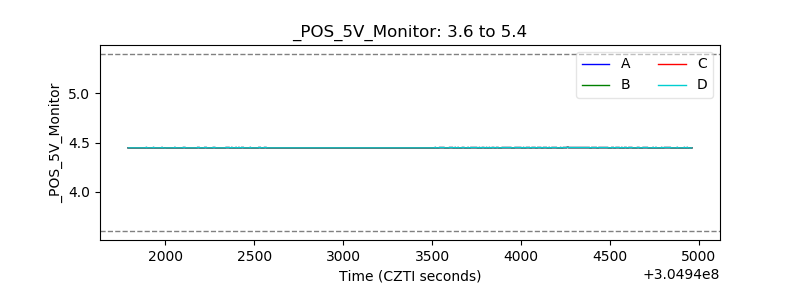 |
| _ROLL_ROT | 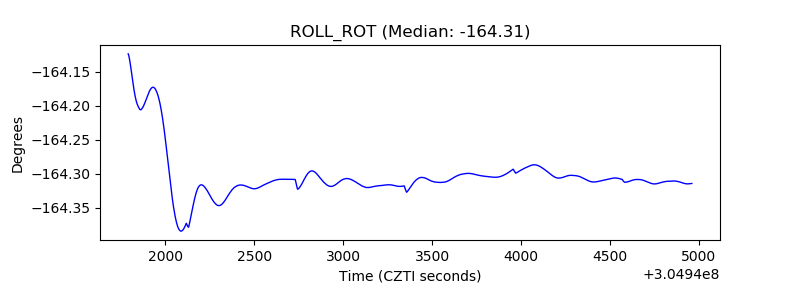 |
| _Roll_DEC | 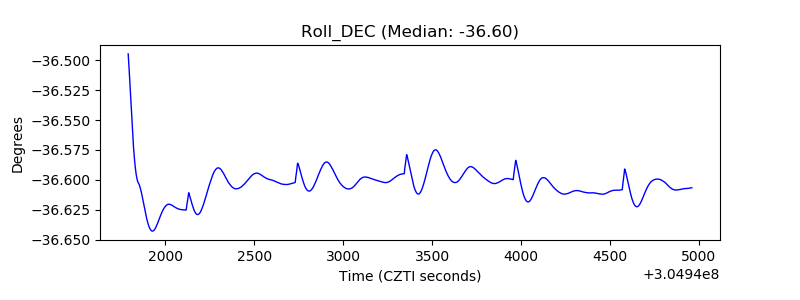 |
| _Roll_RA | 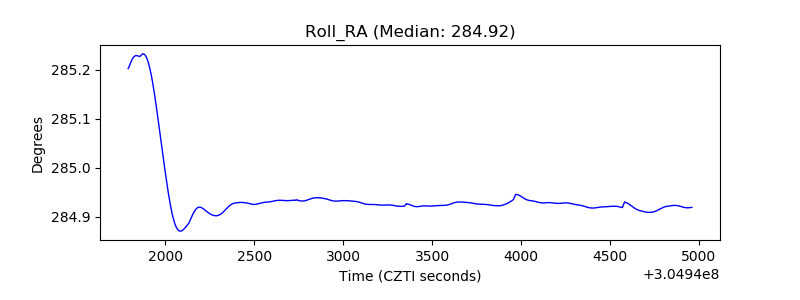 |
| Veto Counter | 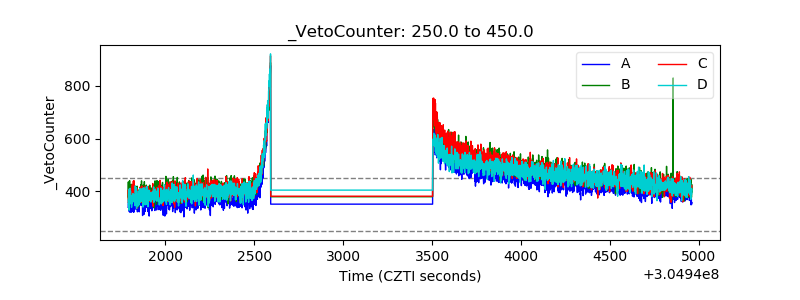 |