| Param | Original file | Final file |
|---|---|---|
| Filename | modeM0/AS1A06_005T05_9000003136_21215cztM0_level2.evt | modeM0/AS1A06_005T05_9000003136_21215cztM0_level2_quad_clean.evt |
| Size (bytes) | 614,741,760 | 108,129,600 |
| Size | 586.3 MB | 103.1 MB |
| Events in quadrant A | 4,796,958 | 681,135 |
| Events in quadrant B | 3,823,506 | 716,424 |
| Events in quadrant C | 3,819,513 | 688,097 |
| Events in quadrant D | 5,666,413 | 664,600 |
| Mode M9 | |||
|---|---|---|---|
| Quadrant | BADHDUFLAG | Total packets | Discarded packets |
| A | 0 | 19 | 0 |
| B | 0 | 19 | 0 |
| C | 0 | 19 | 0 |
| D | 0 | 19 | 0 |
| Mode M0 | |||
|---|---|---|---|
| Quadrant | BADHDUFLAG | Total packets | Discarded packets |
| A | 0 | 19005 | 2 |
| B | 0 | 16123 | 2 |
| C | 0 | 16199 | 2 |
| D | 0 | 21830 | 2 |
| Mode SS | |||
|---|---|---|---|
| Quadrant | BADHDUFLAG | Total packets | Discarded packets |
| A | 0 | 154 | 0 |
| B | 0 | 154 | 0 |
| C | 0 | 154 | 0 |
| D | 0 | 154 | 0 |
| Quadrant | Total seconds | Saturated seconds | Saturation percentage |
|---|---|---|---|
| A | 7540 | 514 | 6.816976% |
| B | 7540 | 101 | 1.339523% |
| C | 7540 | 160 | 2.122016% |
| D | 7540 | 707 | 9.376658% |
Noise dominated data is calculated using 1-second bins in cleaned event files. If a bin has >2000 counts, and if more than 50% of those come from <1% of pixels, then it is considered to be noise-dominated and hence unusable.
| Quadrant | # 1 sec bins | Bins with >0 counts | Bins with >2000 counts | High rate bins dominated by noise | Noise dominated (total time) | Noise dominated (detector-on time) | Marked lightcurve |
|---|---|---|---|---|---|---|---|
| A | 9490 | 7540 | 347 | 347 | 3.66% | 4.60% | 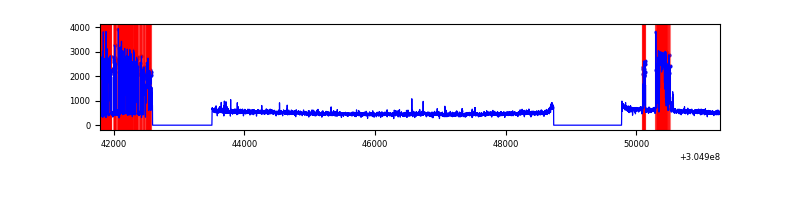 |
| B | 9490 | 7540 | 1 | 1 | 0.01% | 0.01% | 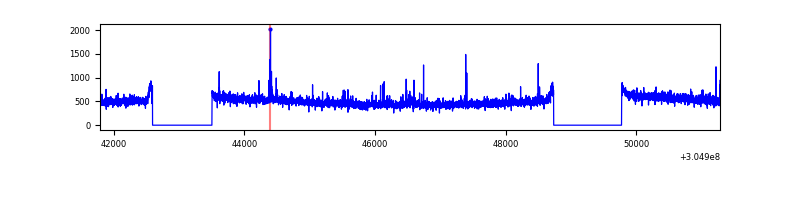 |
| C | 9490 | 7540 | 0 | 0 | 0.00% | 0.00% | 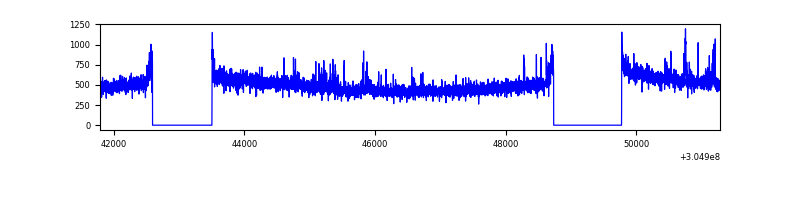 |
| D | 9490 | 7540 | 521 | 521 | 5.49% | 6.91% | 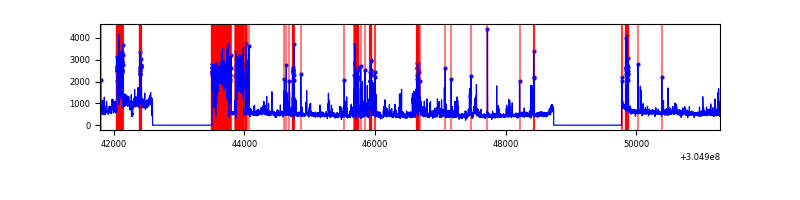 |
Top three noisy pixels from each quadrant. If the there are fewer than three noisy pixels in the level2.evt file, extra rows are filled as -1
| Pixel properties | Quadrant properties | ||||||
|---|---|---|---|---|---|---|---|
| Quadrant | DetID | PixID | Counts | Sigma | Mean | Median | Sigma |
| A | 15 | 236 | 672818 | 3551.26 | 936 | 919 | 189.2 |
| A | 5 | 16 | 436199 | 2300.63 | 936 | 919 | 189.2 |
| A | 11 | 47 | 84298 | 440.69 | 936 | 919 | 189.2 |
| B | 0 | 197 | 23666 | 125.64 | 952 | 930 | 181.0 |
| B | 12 | 111 | 21763 | 115.12 | 952 | 930 | 181.0 |
| B | 3 | 64 | 21019 | 111.01 | 952 | 930 | 181.0 |
| C | 14 | 238 | 143159 | 662.24 | 912 | 918 | 214.8 |
| C | 3 | 233 | 114085 | 526.87 | 912 | 918 | 214.8 |
| C | 0 | 207 | 7096 | 28.76 | 912 | 918 | 214.8 |
| D | 1 | 52 | 984585 | 4493.69 | 893 | 867 | 218.9 |
| D | 13 | 174 | 448796 | 2046.17 | 893 | 867 | 218.9 |
| D | 7 | 238 | 324325 | 1477.58 | 893 | 867 | 218.9 |
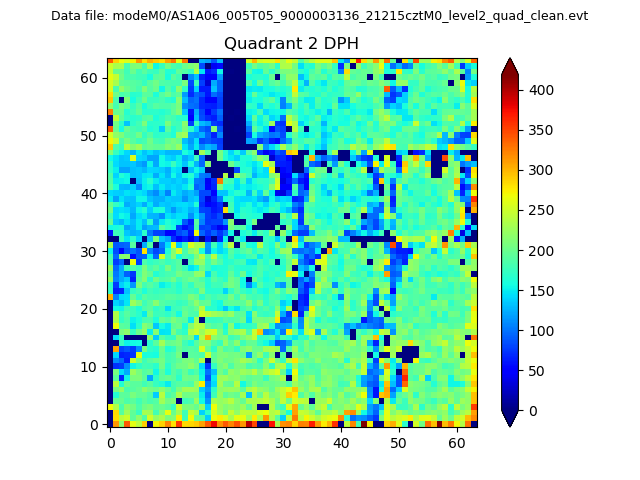
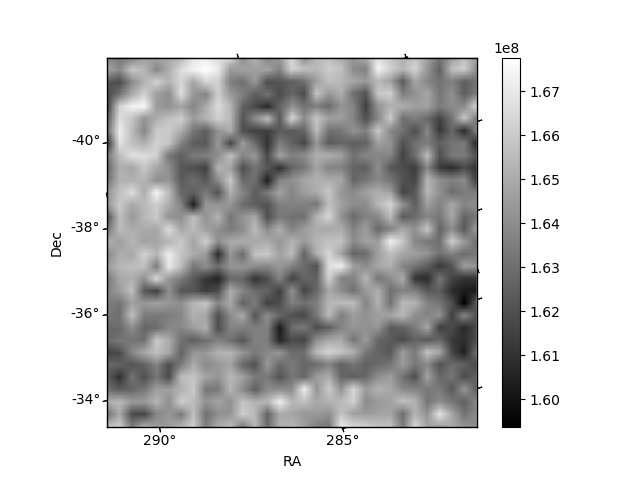
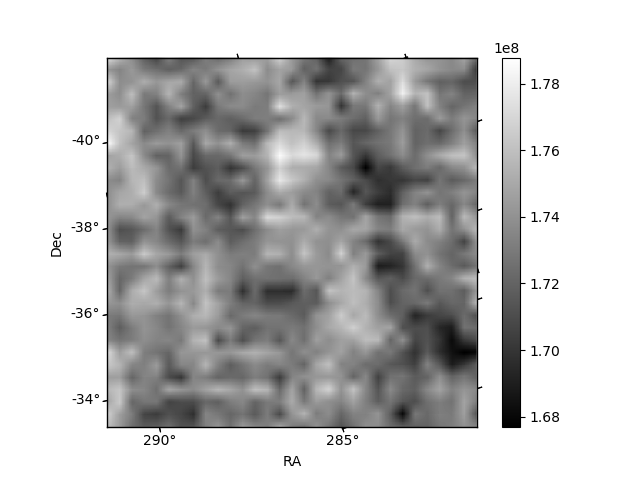
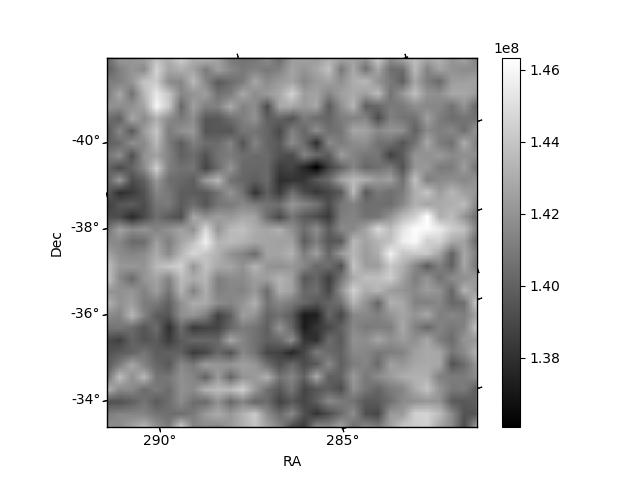
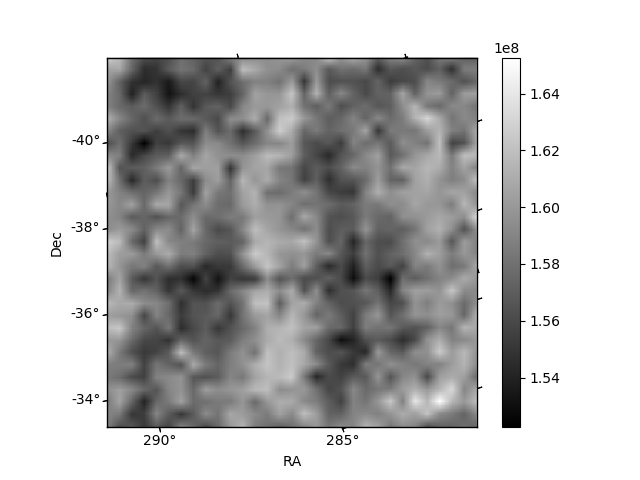
Histogram calculated using DETX and DETY for each event in the final _common_clean file
| Quadrant A | 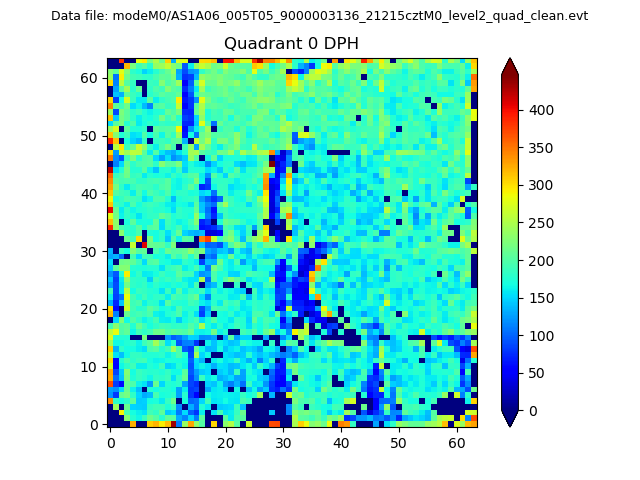 |
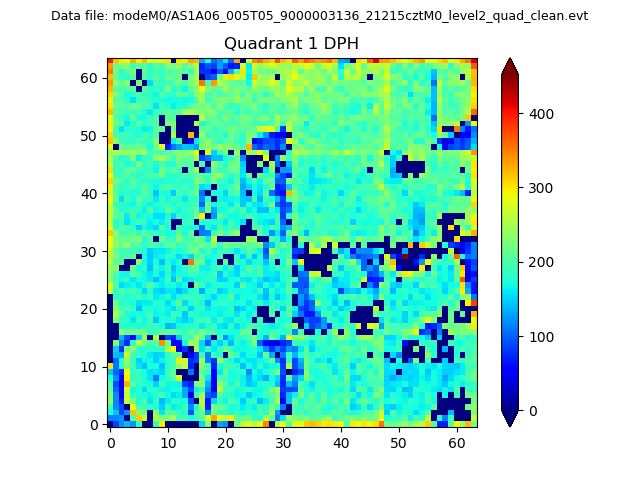 |
Quadrant B |
|---|---|---|---|
| Quadrant D | 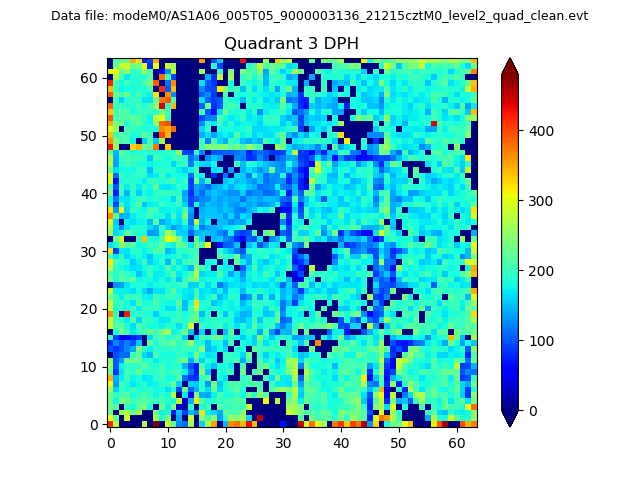 |
 |
Quadrant C |
| Plot type | Count rate plots | Images |
|---|---|---|
| Comparison with Poisson distribution Blue bars denote a histogram of data divided into 1 sec bins. Red curve is a Poisson curve with rate = median count rate of data. |
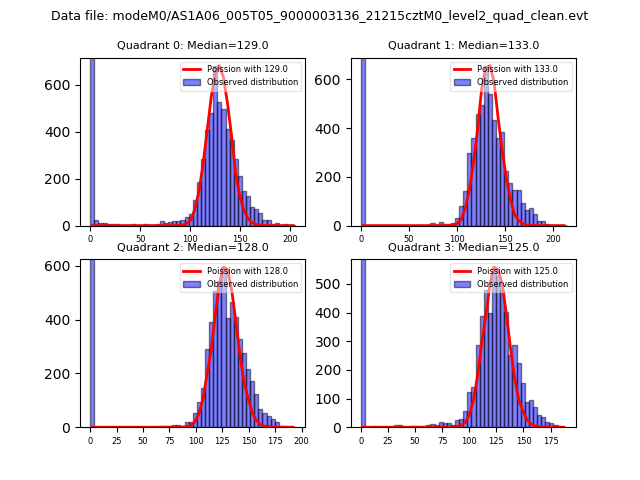 |
 |
| Quadrant-wise count rates Data is divided into 100 sec bins |
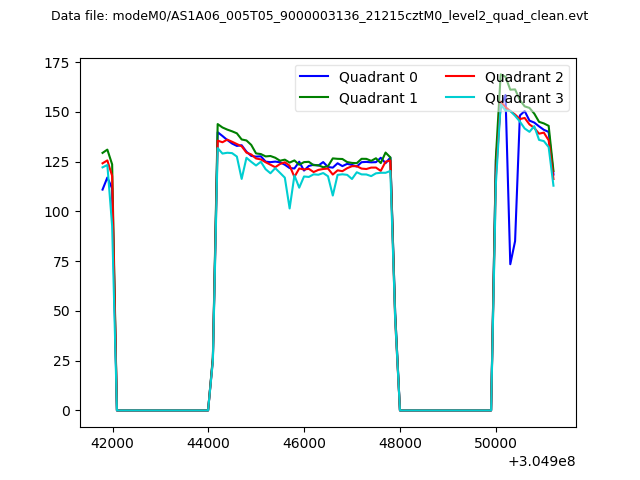 |
|
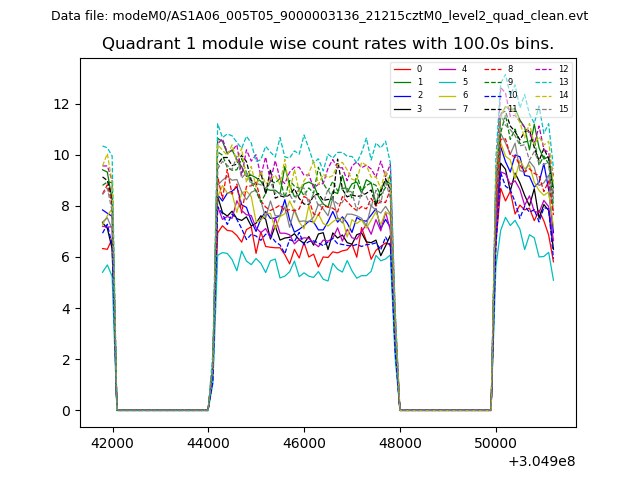
| Module-wise count rates for Quadrant A Data is divided into 100 sec bins |
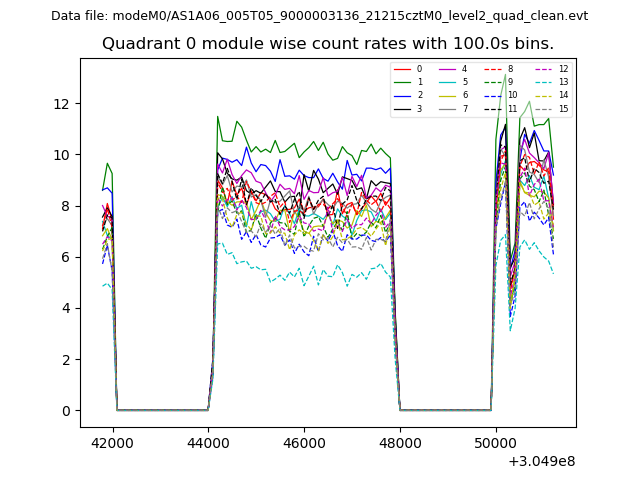 |
 |
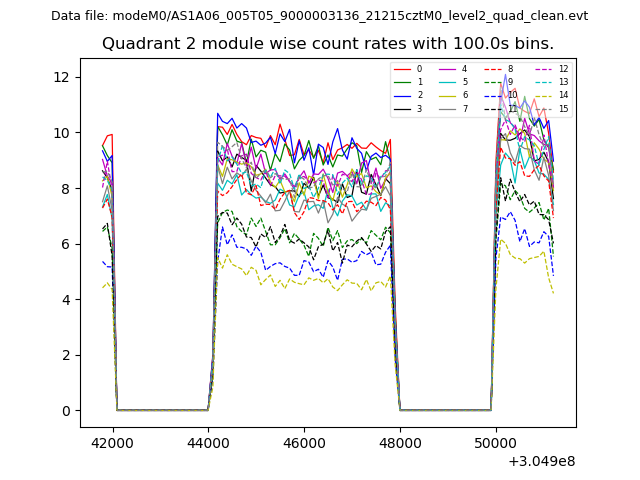
| Module-wise count rates for Quadrant B Data is divided into 100 sec bins |
 |
 |
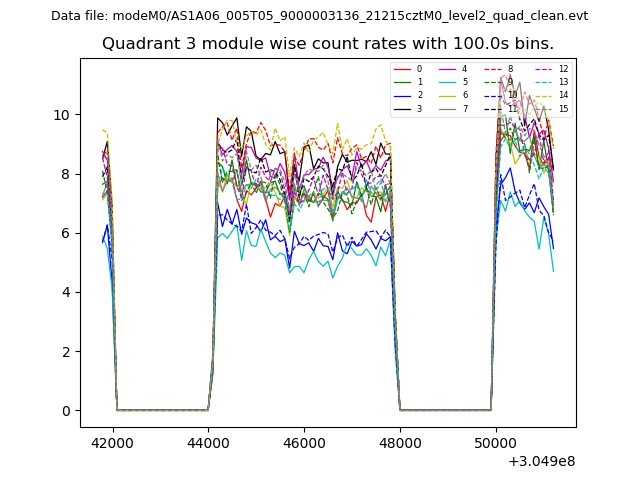
| Module-wise count rates for Quadrant C Data is divided into 100 sec bins |
 |
 |
| Module-wise count rates for Quadrant D Data is divided into 100 sec bins |
 |
 |
| Parameter | Plot |
|---|---|
| CZT HV Monitor | 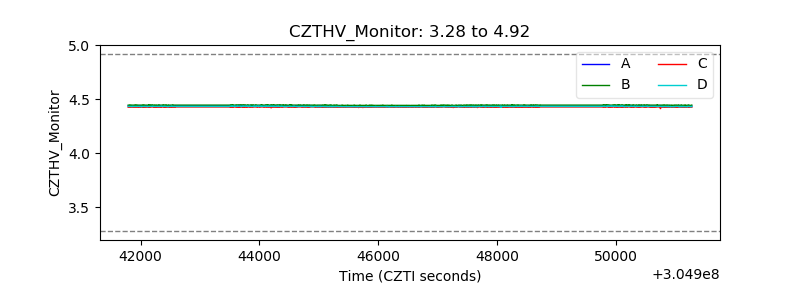 |
| D_VDD | 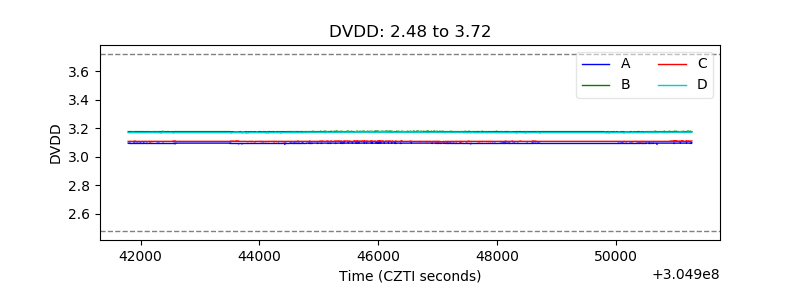 |
| Temperature 1 | 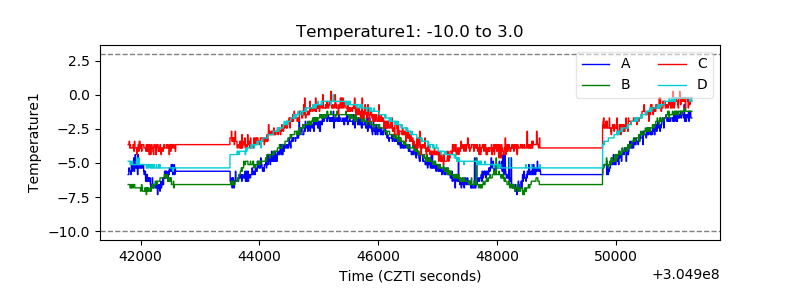 |
| Veto HV Monitor | 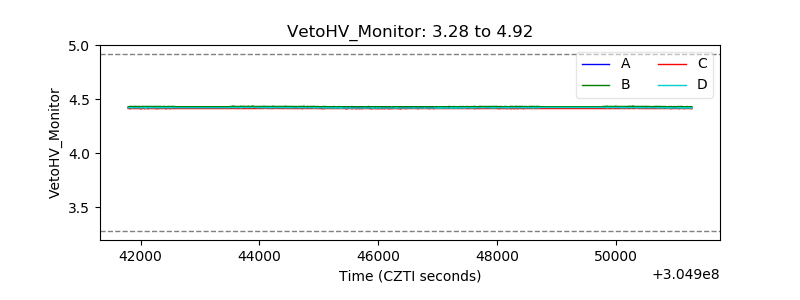 |
| Veto LLD | 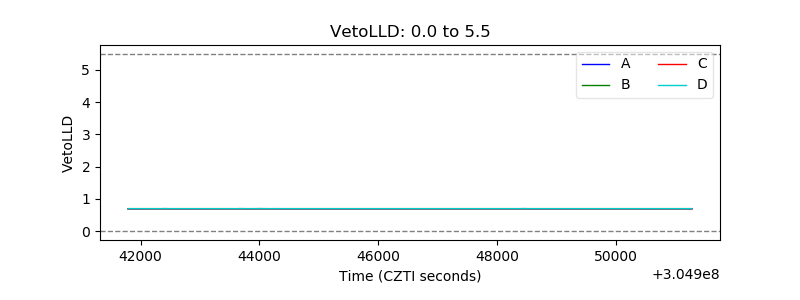 |
| Alpha Counter | 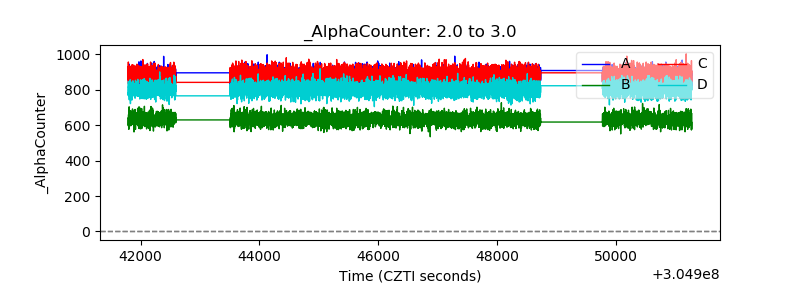 |
| _CPM_Rate | 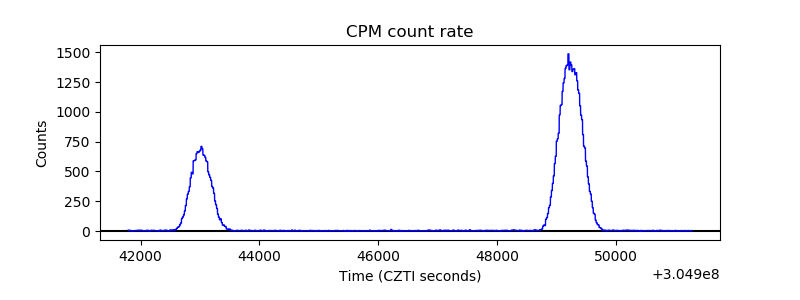 |
| CZT Counter | 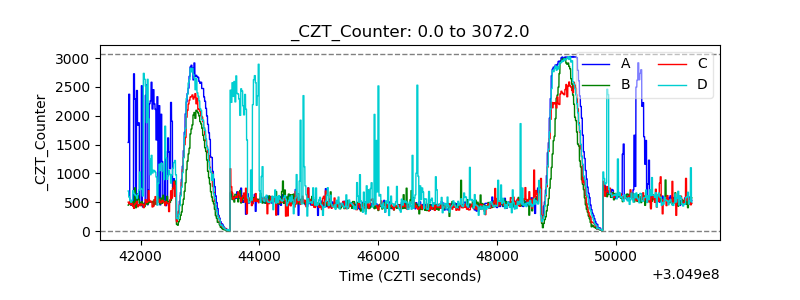 |
| +2.5 Volts monitor | 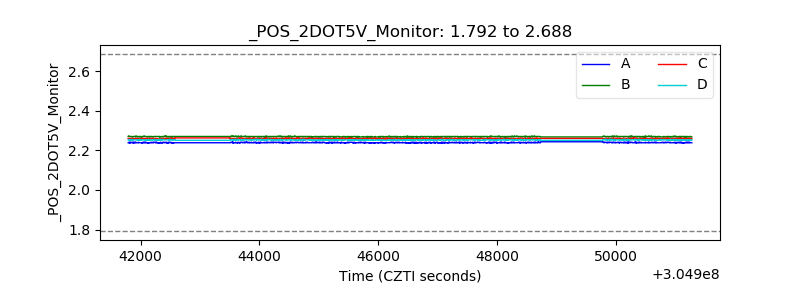 |
| +5 Volts monitor | 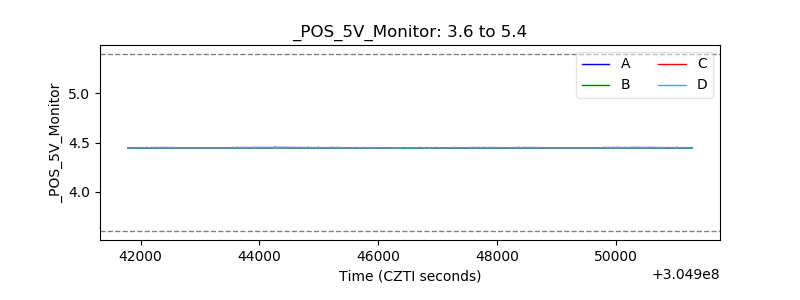 |
| _ROLL_ROT | 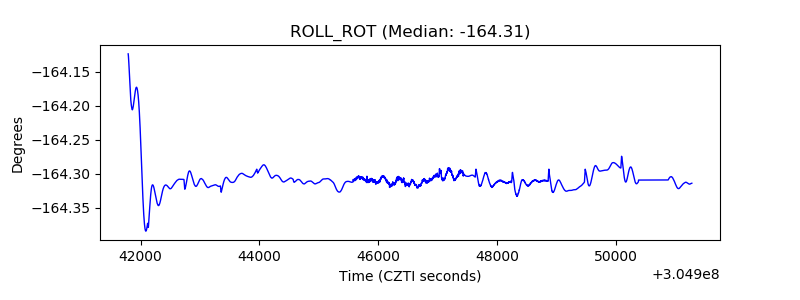 |
| _Roll_DEC | 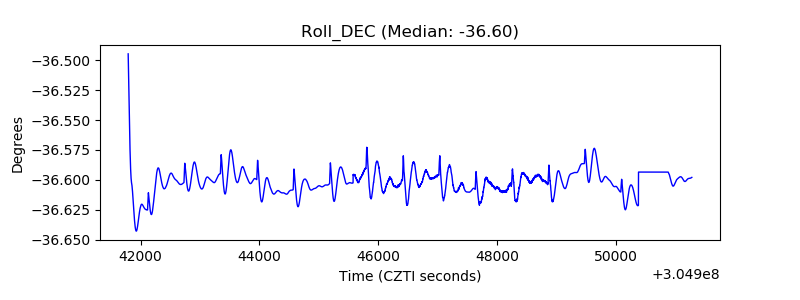 |
| _Roll_RA | 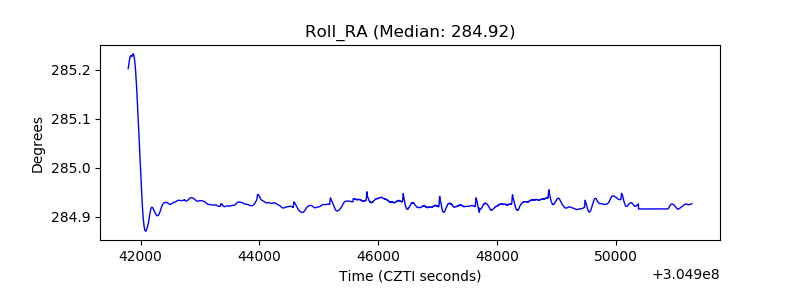 |
| Veto Counter |  |