| Param | Original file | Final file |
|---|---|---|
| Filename | modeM0/AS1A06_005T05_9000003136_21217cztM0_level2.evt | modeM0/AS1A06_005T05_9000003136_21217cztM0_level2_quad_clean.evt |
| Size (bytes) | 514,103,040 | 102,401,280 |
| Size | 490.3 MB | 97.7 MB |
| Events in quadrant A | 3,463,960 | 680,654 |
| Events in quadrant B | 3,101,424 | 706,426 |
| Events in quadrant C | 3,017,783 | 672,806 |
| Events in quadrant D | 5,584,598 | 627,028 |
| Mode M9 | |||
|---|---|---|---|
| Quadrant | BADHDUFLAG | Total packets | Discarded packets |
| A | 0 | 12 | 0 |
| B | 0 | 12 | 0 |
| C | 0 | 12 | 0 |
| D | 0 | 12 | 0 |
| Mode M0 | |||
|---|---|---|---|
| Quadrant | BADHDUFLAG | Total packets | Discarded packets |
| A | 0 | 14078 | 1 |
| B | 0 | 13088 | 1 |
| C | 0 | 12925 | 1 |
| D | 0 | 20617 | 1 |
| Mode SS | |||
|---|---|---|---|
| Quadrant | BADHDUFLAG | Total packets | Discarded packets |
| A | 0 | 120 | 0 |
| B | 0 | 120 | 0 |
| C | 0 | 120 | 0 |
| D | 0 | 120 | 0 |
| Quadrant | Total seconds | Saturated seconds | Saturation percentage |
|---|---|---|---|
| A | 5928 | 211 | 3.559379% |
| B | 5929 | 74 | 1.248103% |
| C | 5929 | 90 | 1.517963% |
| D | 5929 | 584 | 9.849890% |
Noise dominated data is calculated using 1-second bins in cleaned event files. If a bin has >2000 counts, and if more than 50% of those come from <1% of pixels, then it is considered to be noise-dominated and hence unusable.
| Quadrant | # 1 sec bins | Bins with >0 counts | Bins with >2000 counts | High rate bins dominated by noise | Noise dominated (total time) | Noise dominated (detector-on time) | Marked lightcurve |
|---|---|---|---|---|---|---|---|
| A | 7093 | 5928 | 123 | 123 | 1.73% | 2.07% |  |
| B | 7094 | 5929 | 14 | 14 | 0.20% | 0.24% |  |
| C | 7094 | 5929 | 0 | 0 | 0.00% | 0.00% |  |
| D | 7094 | 5929 | 576 | 576 | 8.12% | 9.71% |  |
Top three noisy pixels from each quadrant. If the there are fewer than three noisy pixels in the level2.evt file, extra rows are filled as -1
| Pixel properties | Quadrant properties | ||||||
|---|---|---|---|---|---|---|---|
| Quadrant | DetID | PixID | Counts | Sigma | Mean | Median | Sigma |
| A | 5 | 16 | 385576 | 2549.83 | 753 | 738 | 150.9 |
| A | 11 | 47 | 135661 | 893.96 | 753 | 738 | 150.9 |
| A | 15 | 236 | 45304 | 295.28 | 753 | 738 | 150.9 |
| B | 0 | 189 | 57594 | 399.88 | 757 | 741 | 142.2 |
| B | 3 | 64 | 25267 | 172.51 | 757 | 741 | 142.2 |
| B | 0 | 190 | 24402 | 166.42 | 757 | 741 | 142.2 |
| C | 14 | 238 | 114083 | 679.31 | 719 | 724 | 166.9 |
| C | 3 | 233 | 88890 | 528.34 | 719 | 724 | 166.9 |
| C | 0 | 207 | 9213 | 50.87 | 719 | 724 | 166.9 |
| D | 7 | 238 | 1813803 | 10447.38 | 717 | 697 | 173.5 |
| D | 1 | 239 | 289567 | 1664.51 | 717 | 697 | 173.5 |
| D | 13 | 153 | 196338 | 1127.31 | 717 | 697 | 173.5 |
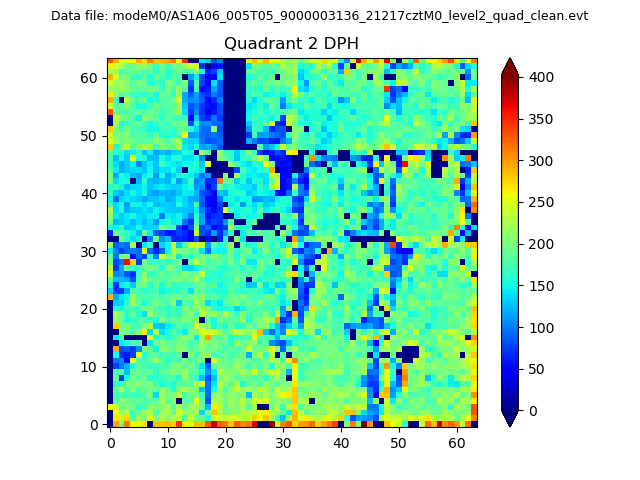
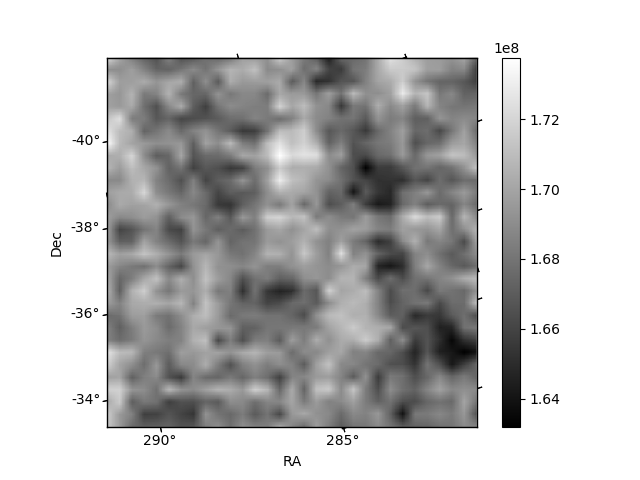
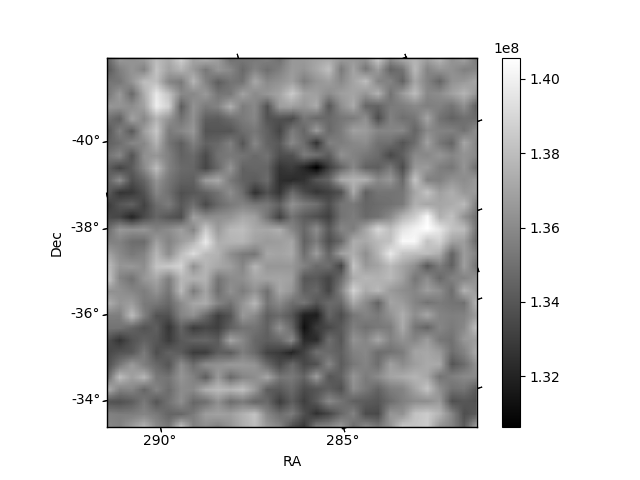
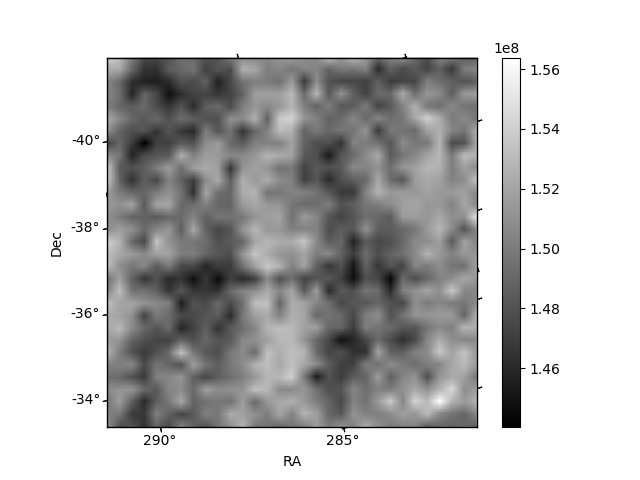
Histogram calculated using DETX and DETY for each event in the final _common_clean file
| Quadrant A | 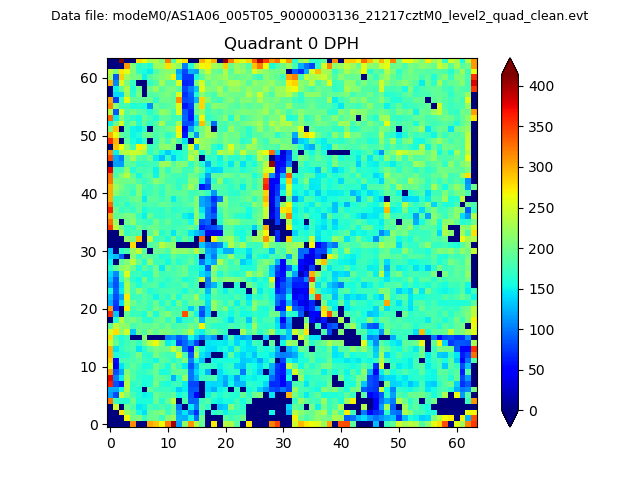 |
 |
Quadrant B |
|---|---|---|---|
| Quadrant D | 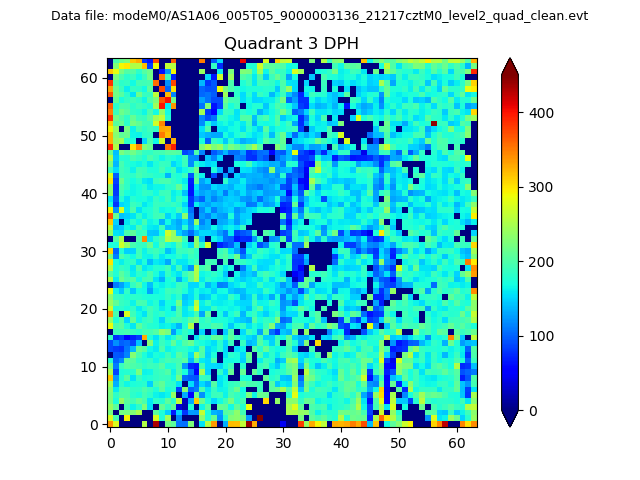 |
 |
Quadrant C |
| Plot type | Count rate plots | Images |
|---|---|---|
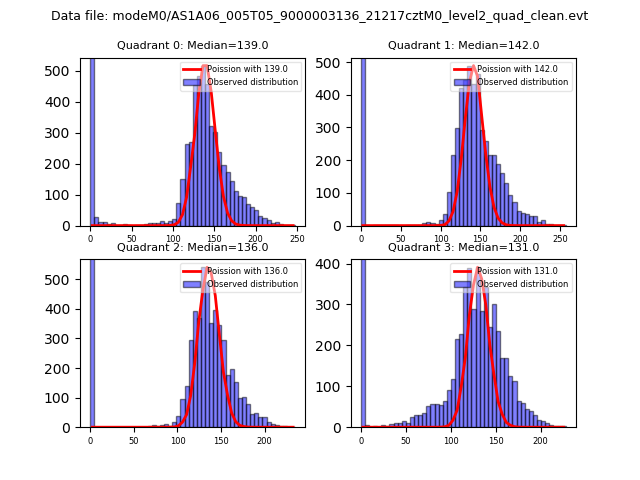
| Comparison with Poisson distribution Blue bars denote a histogram of data divided into 1 sec bins. Red curve is a Poisson curve with rate = median count rate of data. |
 |
 |
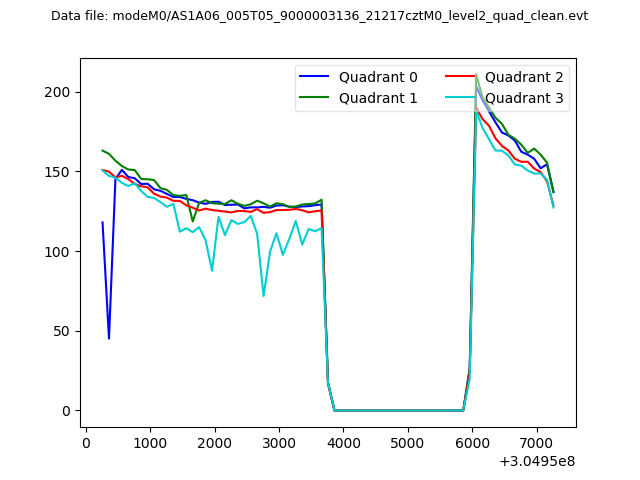
| Quadrant-wise count rates Data is divided into 100 sec bins |
 |
|
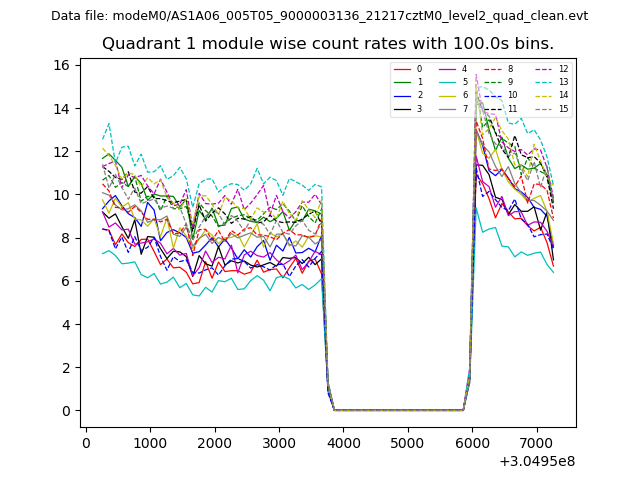
| Module-wise count rates for Quadrant A Data is divided into 100 sec bins |
 |
 |
| Module-wise count rates for Quadrant B Data is divided into 100 sec bins |
 |
 |
| Module-wise count rates for Quadrant C Data is divided into 100 sec bins |
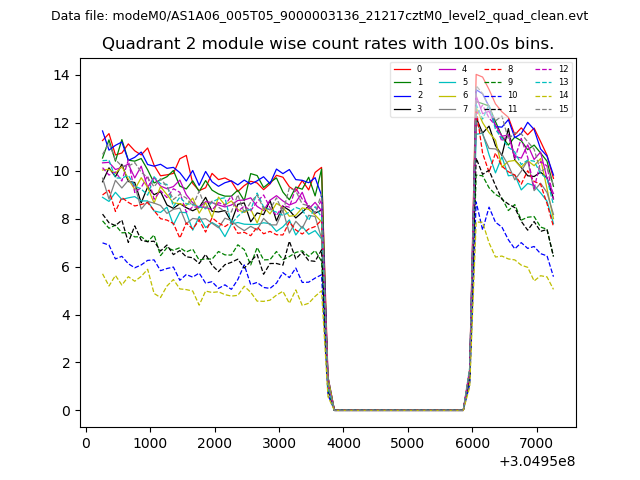 |
 |
| Module-wise count rates for Quadrant D Data is divided into 100 sec bins |
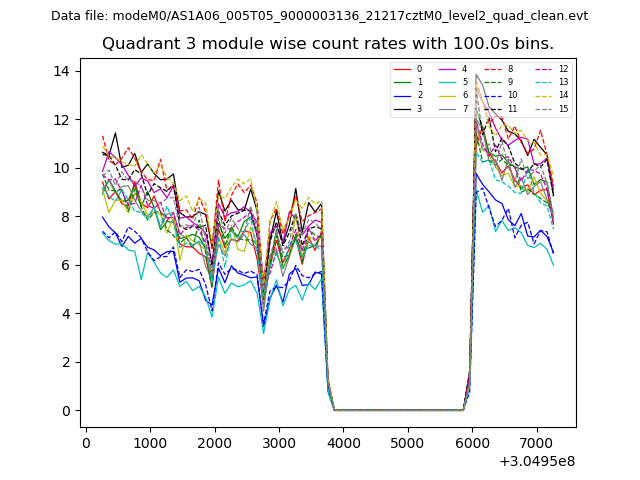 |
 |
| Parameter | Plot |
|---|---|
| CZT HV Monitor | 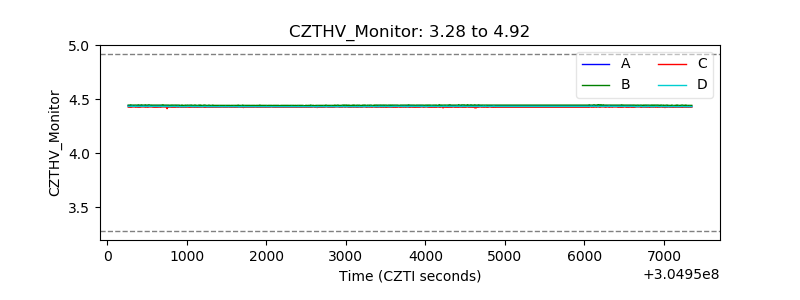 |
| D_VDD | 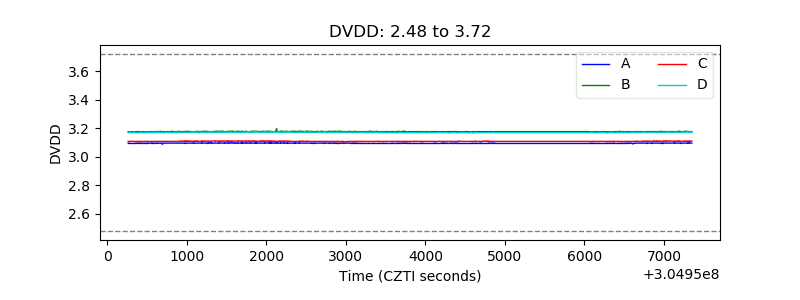 |
| Temperature 1 | 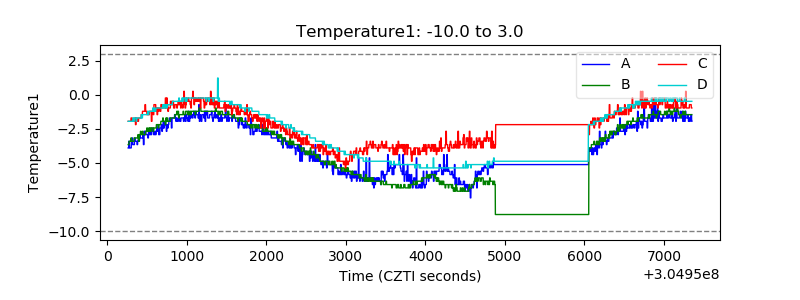 |
| Veto HV Monitor | 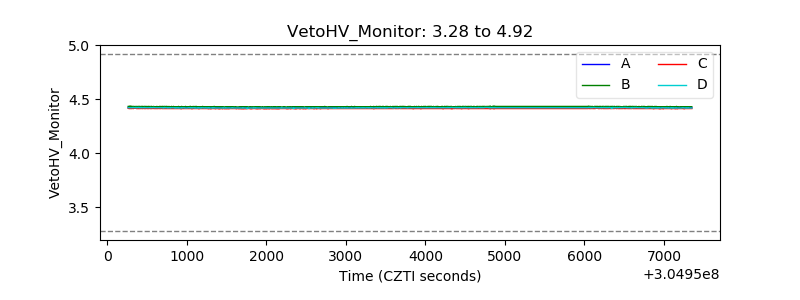 |
| Veto LLD | 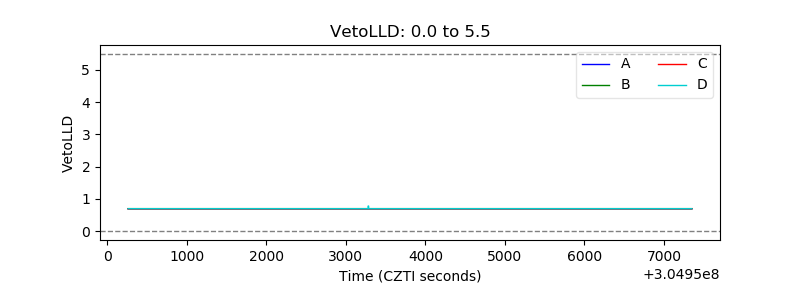 |
| Alpha Counter | 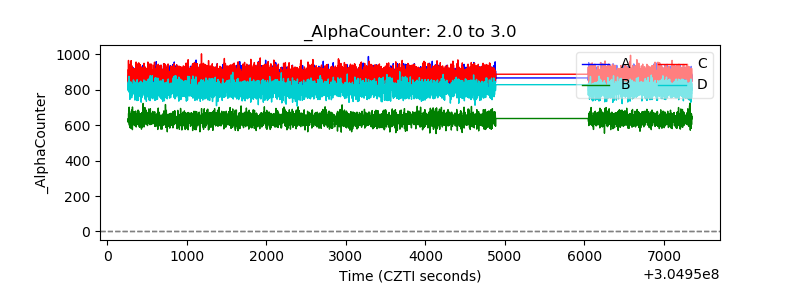 |
| _CPM_Rate | 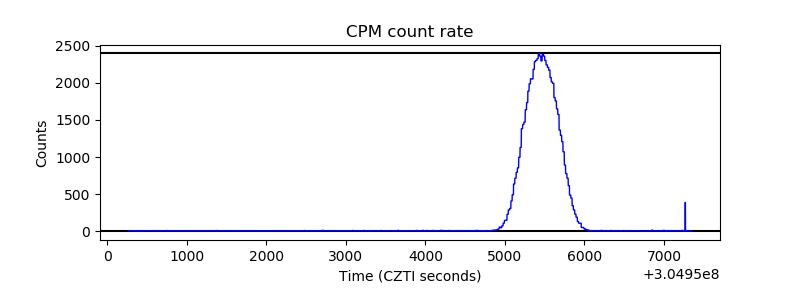 |
| CZT Counter | 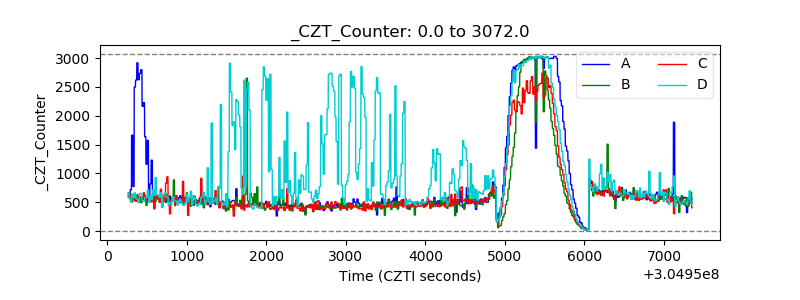 |
| +2.5 Volts monitor |  |
| +5 Volts monitor |  |
| _ROLL_ROT | 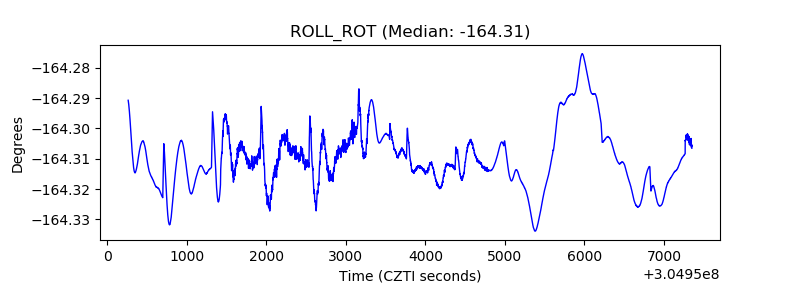 |
| _Roll_DEC | 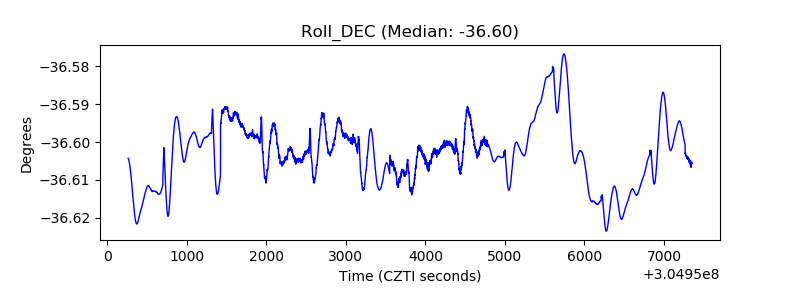 |
| _Roll_RA | 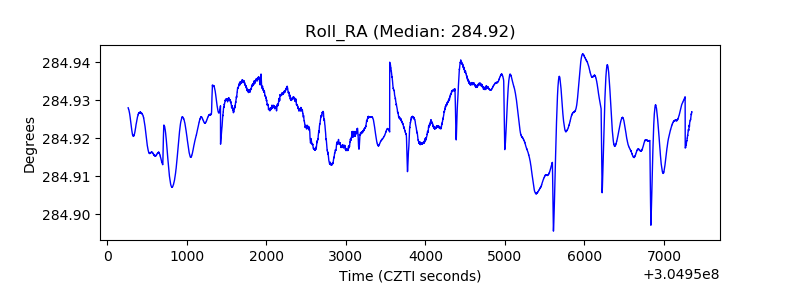 |
| Veto Counter | 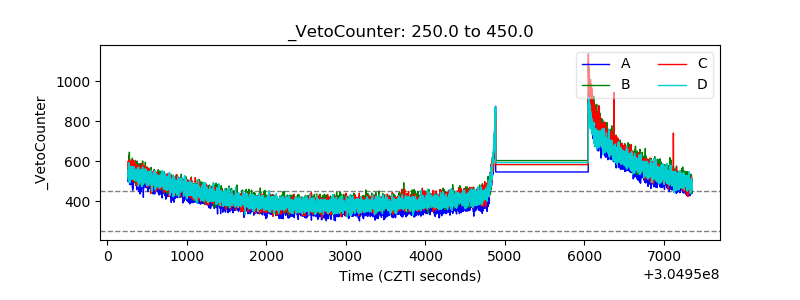 |