| Param | Original file | Final file |
|---|---|---|
| Filename | modeM0/AS1A06_005T05_9000003136_21218cztM0_level2.evt | modeM0/AS1A06_005T05_9000003136_21218cztM0_level2_quad_clean.evt |
| Size (bytes) | 516,977,280 | 105,998,400 |
| Size | 493.0 MB | 101.1 MB |
| Events in quadrant A | 3,293,114 | 724,843 |
| Events in quadrant B | 3,190,635 | 736,819 |
| Events in quadrant C | 4,577,420 | 660,629 |
| Events in quadrant D | 4,180,577 | 660,602 |
| Mode M9 | |||
|---|---|---|---|
| Quadrant | BADHDUFLAG | Total packets | Discarded packets |
| A | 0 | 13 | 0 |
| B | 0 | 13 | 0 |
| C | 0 | 13 | 0 |
| D | 0 | 13 | 0 |
| Mode M0 | |||
|---|---|---|---|
| Quadrant | BADHDUFLAG | Total packets | Discarded packets |
| A | 0 | 13729 | 1 |
| B | 0 | 13394 | 1 |
| C | 0 | 17696 | 1 |
| D | 0 | 16626 | 1 |
| Mode SS | |||
|---|---|---|---|
| Quadrant | BADHDUFLAG | Total packets | Discarded packets |
| A | 0 | 124 | 0 |
| B | 0 | 124 | 0 |
| C | 0 | 124 | 0 |
| D | 0 | 124 | 0 |
| Quadrant | Total seconds | Saturated seconds | Saturation percentage |
|---|---|---|---|
| A | 6119 | 59 | 0.964210% |
| B | 6120 | 50 | 0.816993% |
| C | 6120 | 539 | 8.807190% |
| D | 6120 | 224 | 3.660131% |
Noise dominated data is calculated using 1-second bins in cleaned event files. If a bin has >2000 counts, and if more than 50% of those come from <1% of pixels, then it is considered to be noise-dominated and hence unusable.
| Quadrant | # 1 sec bins | Bins with >0 counts | Bins with >2000 counts | High rate bins dominated by noise | Noise dominated (total time) | Noise dominated (detector-on time) | Marked lightcurve |
|---|---|---|---|---|---|---|---|
| A | 7414 | 6119 | 7 | 7 | 0.09% | 0.11% | 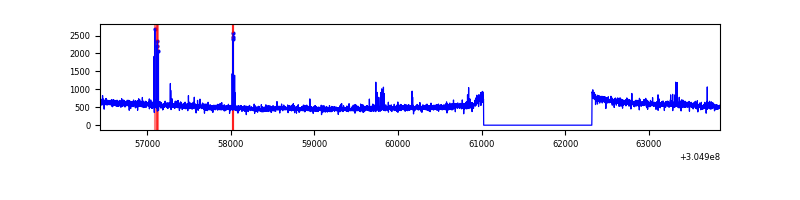 |
| B | 7415 | 6120 | 2 | 2 | 0.03% | 0.03% | 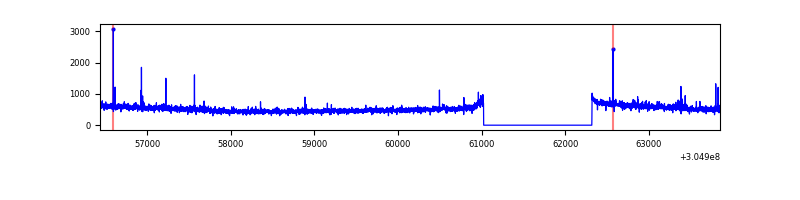 |
| C | 7415 | 6120 | 320 | 320 | 4.32% | 5.23% | 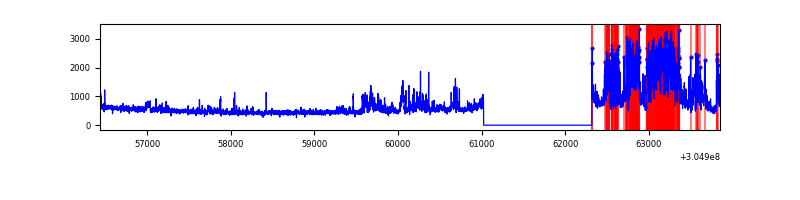 |
| D | 7415 | 6120 | 180 | 180 | 2.43% | 2.94% | 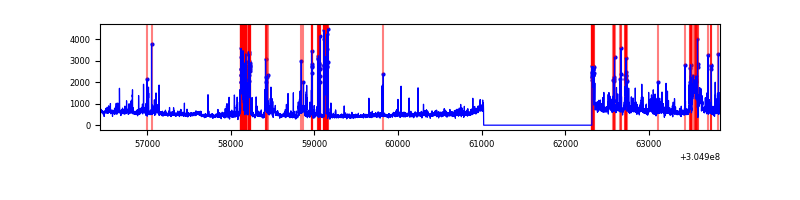 |
Top three noisy pixels from each quadrant. If the there are fewer than three noisy pixels in the level2.evt file, extra rows are filled as -1
| Pixel properties | Quadrant properties | ||||||
|---|---|---|---|---|---|---|---|
| Quadrant | DetID | PixID | Counts | Sigma | Mean | Median | Sigma |
| A | 11 | 47 | 94511 | 576.87 | 809 | 797 | 162.5 |
| A | 15 | 236 | 74690 | 454.86 | 809 | 797 | 162.5 |
| A | 13 | 254 | 10246 | 58.16 | 809 | 797 | 162.5 |
| B | 0 | 190 | 18381 | 116.9 | 801 | 785 | 150.5 |
| B | 12 | 111 | 17002 | 107.74 | 801 | 785 | 150.5 |
| B | 3 | 64 | 15250 | 96.1 | 801 | 785 | 150.5 |
| C | 3 | 233 | 1581385 | 9294.81 | 736 | 742 | 170.1 |
| C | 14 | 238 | 116083 | 678.25 | 736 | 742 | 170.1 |
| C | 0 | 207 | 7930 | 42.27 | 736 | 742 | 170.1 |
| D | 14 | 34 | 337139 | 1830.43 | 763 | 743 | 183.8 |
| D | 1 | 52 | 249281 | 1352.37 | 763 | 743 | 183.8 |
| D | 7 | 238 | 228484 | 1239.2 | 763 | 743 | 183.8 |
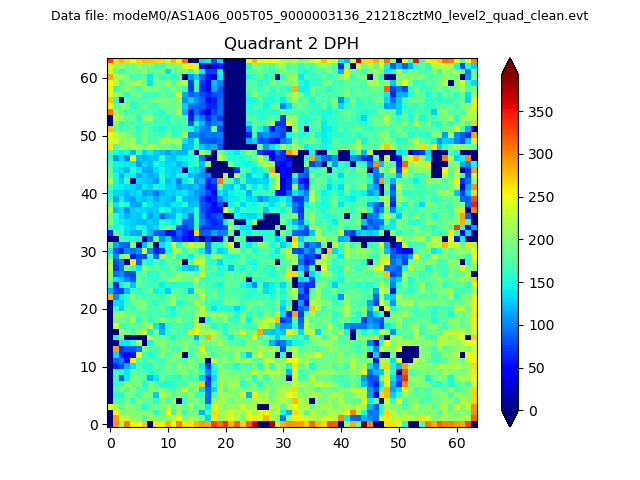
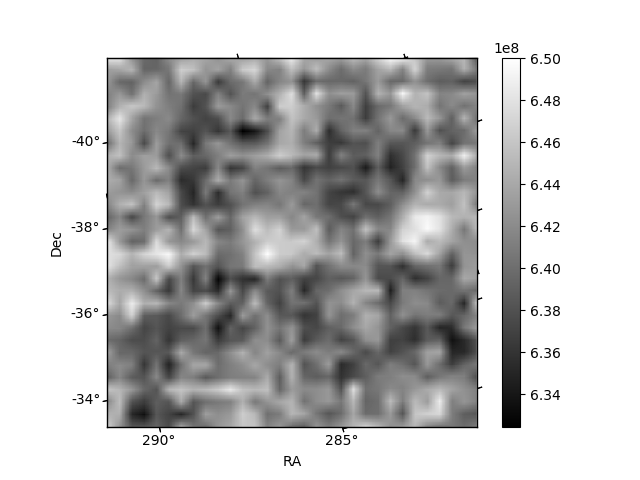
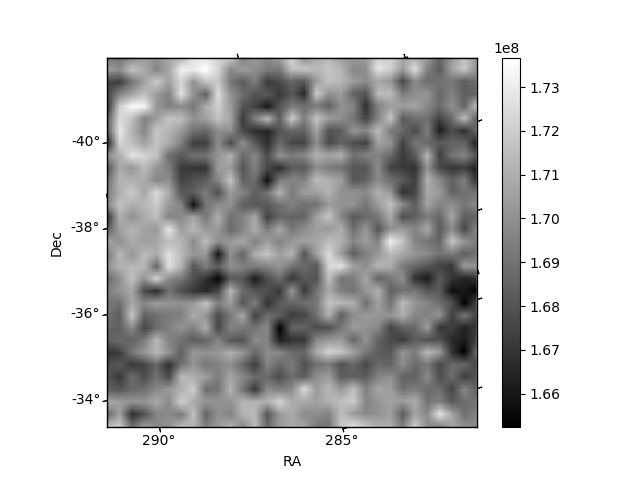
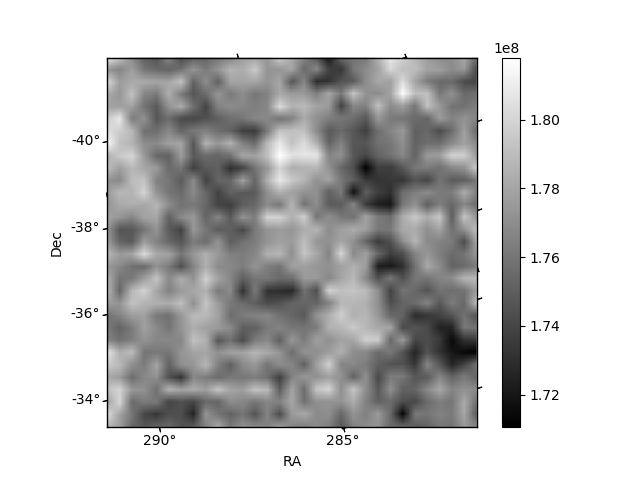
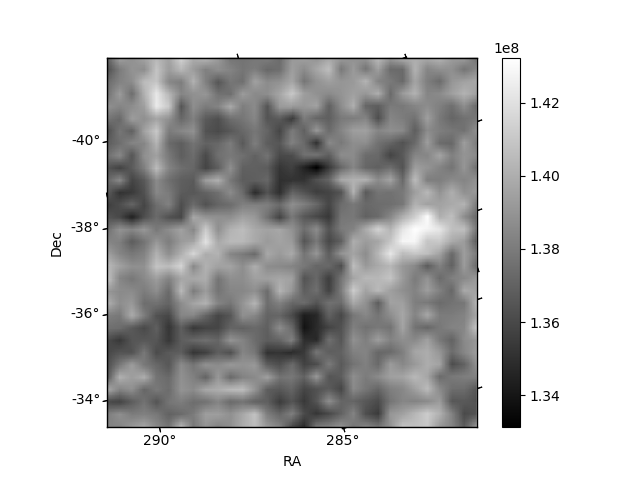
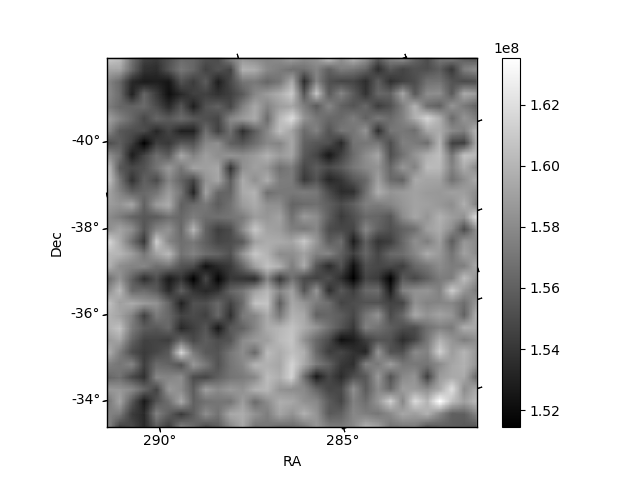
Histogram calculated using DETX and DETY for each event in the final _common_clean file
| Quadrant A | 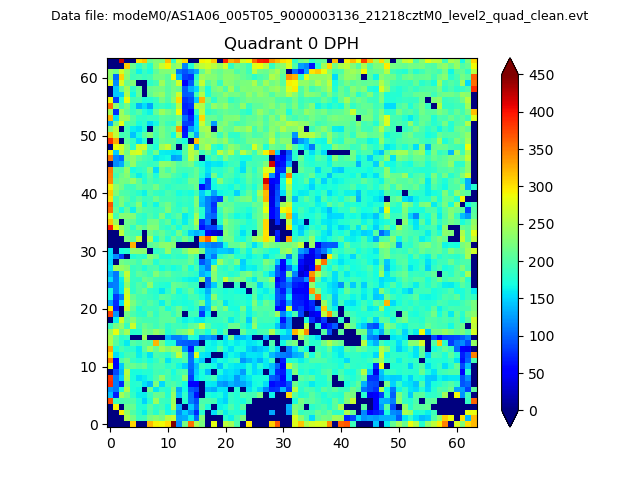 |
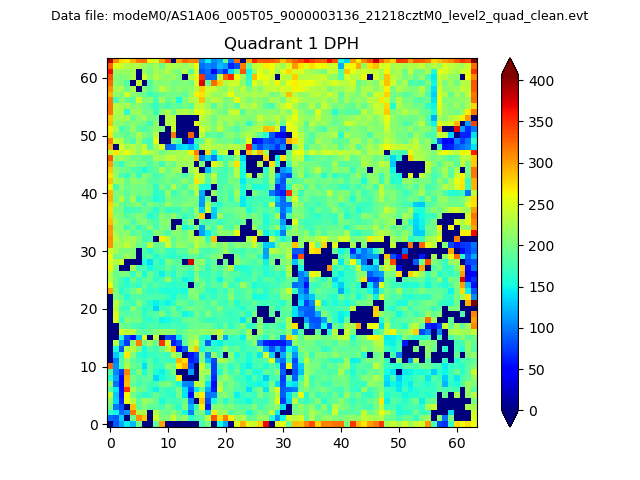 |
Quadrant B |
|---|---|---|---|
| Quadrant D | 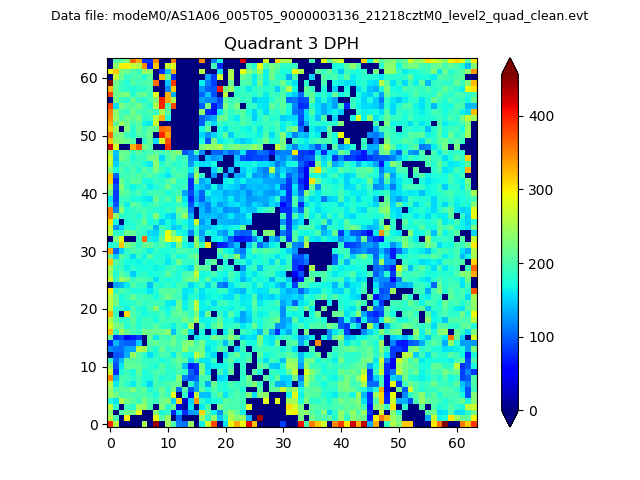 |
 |
Quadrant C |
| Plot type | Count rate plots | Images |
|---|---|---|
| Comparison with Poisson distribution Blue bars denote a histogram of data divided into 1 sec bins. Red curve is a Poisson curve with rate = median count rate of data. |
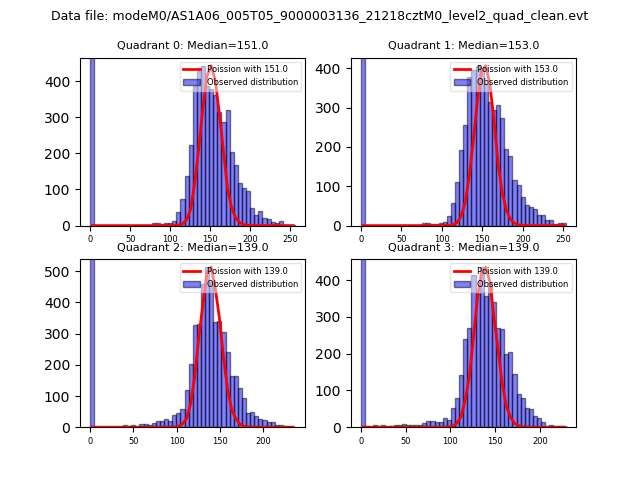 |
 |
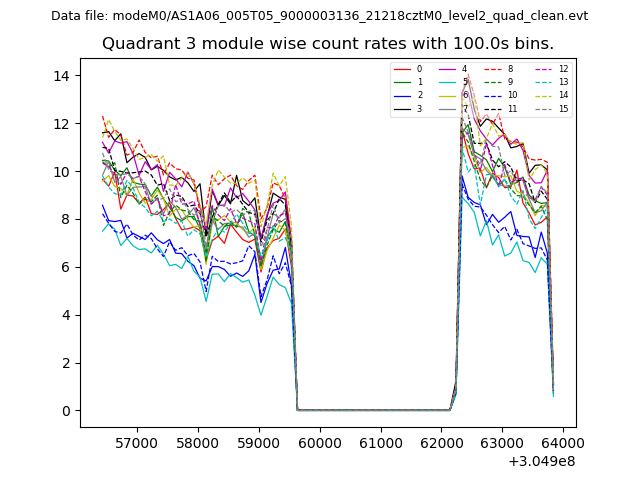
| Quadrant-wise count rates Data is divided into 100 sec bins |
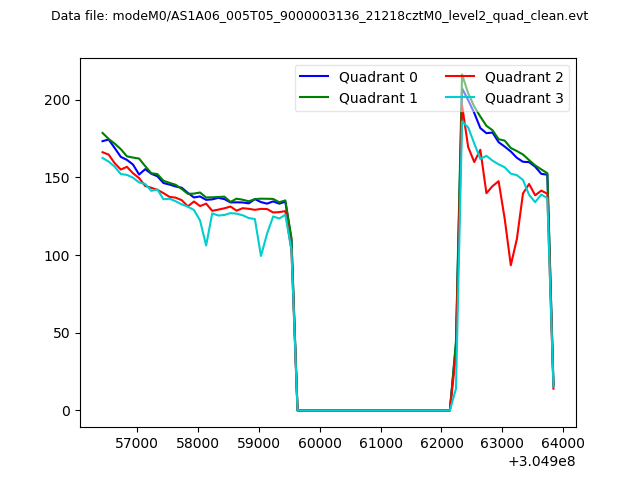 |
|
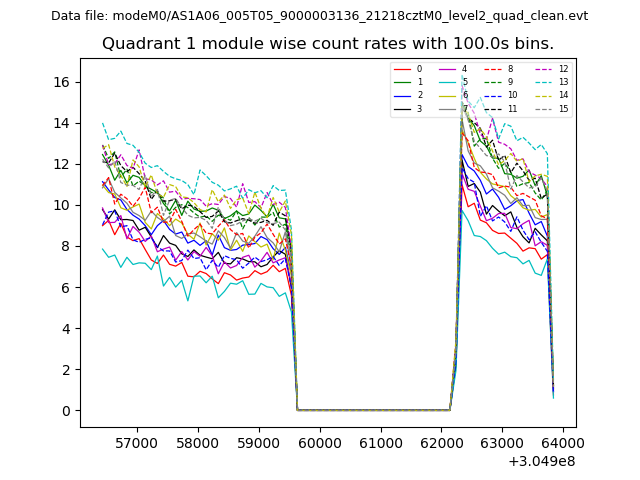
| Module-wise count rates for Quadrant A Data is divided into 100 sec bins |
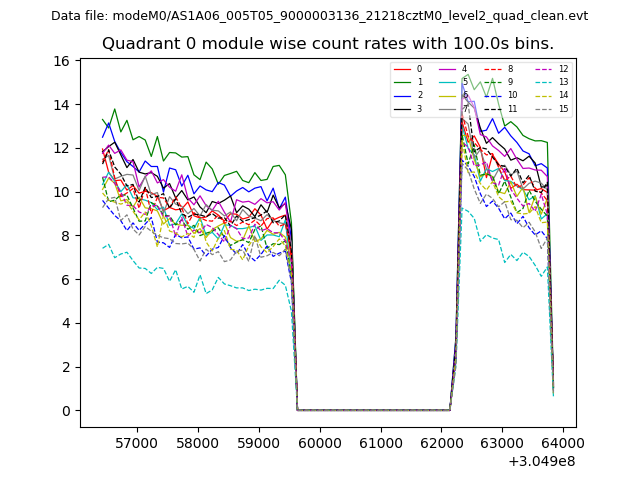 |
 |
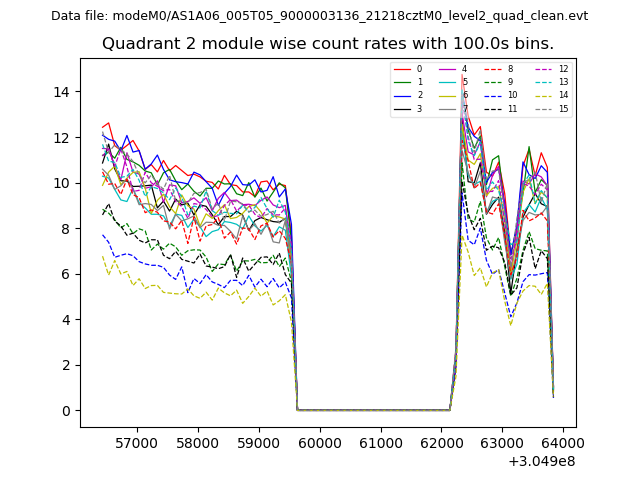
| Module-wise count rates for Quadrant B Data is divided into 100 sec bins |
 |
 |
| Module-wise count rates for Quadrant C Data is divided into 100 sec bins |
 |
 |
| Module-wise count rates for Quadrant D Data is divided into 100 sec bins |
 |
 |
| Parameter | Plot |
|---|---|
| CZT HV Monitor | 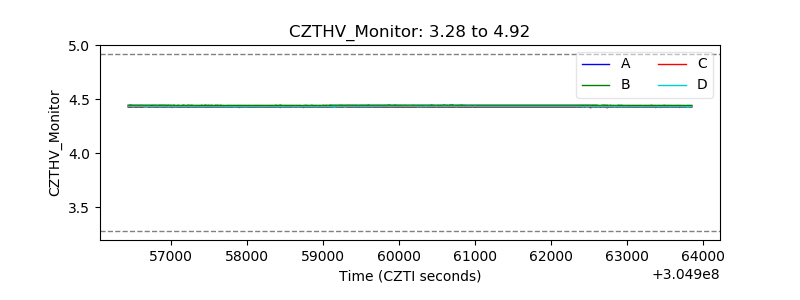 |
| D_VDD | 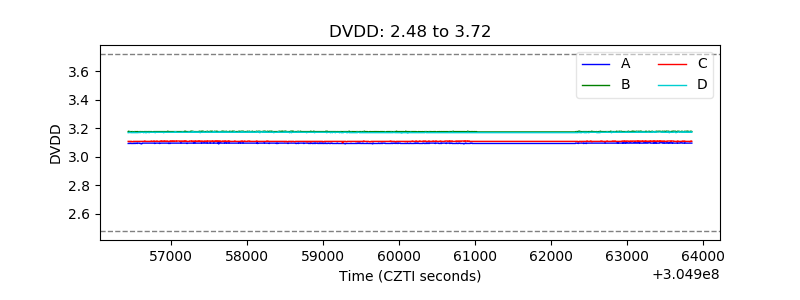 |
| Temperature 1 | 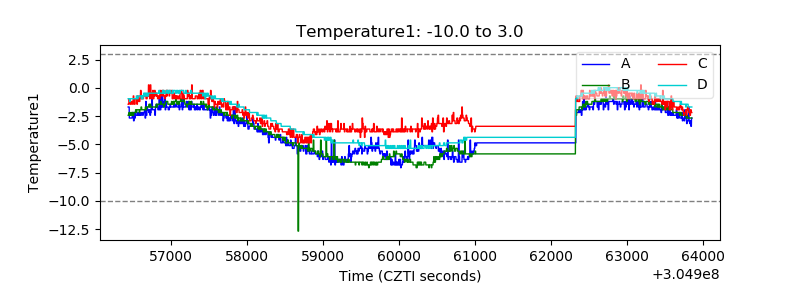 |
| Veto HV Monitor | 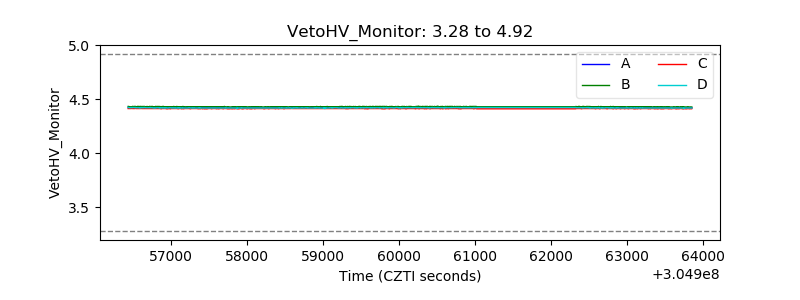 |
| Veto LLD | 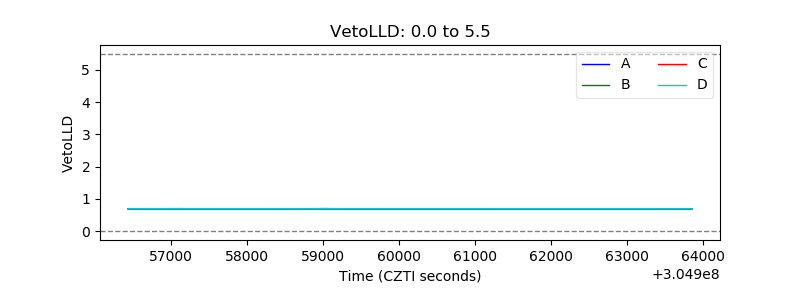 |
| Alpha Counter | 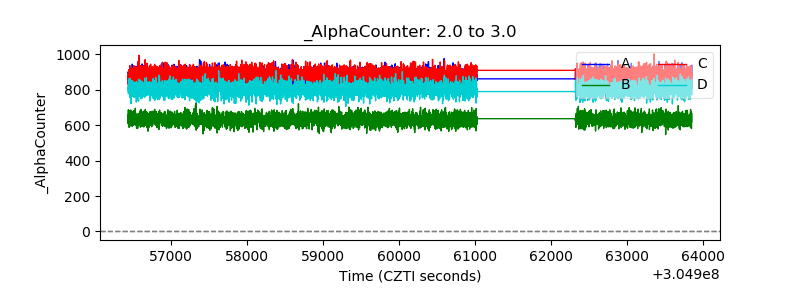 |
| _CPM_Rate | 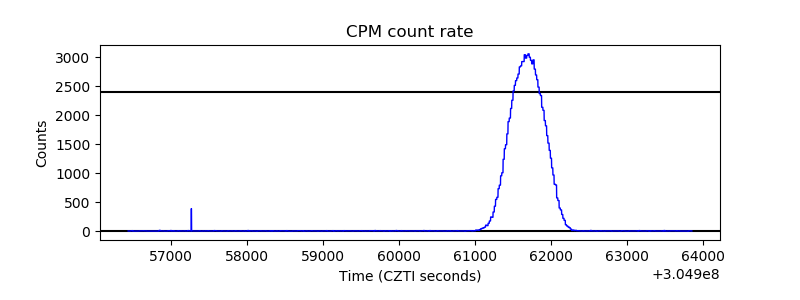 |
| CZT Counter | 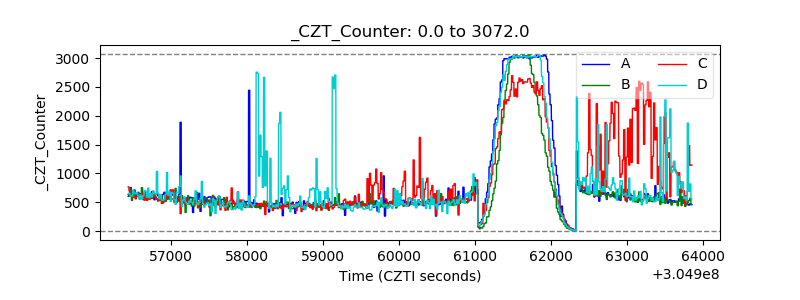 |
| +2.5 Volts monitor |  |
| +5 Volts monitor |  |
| _ROLL_ROT | 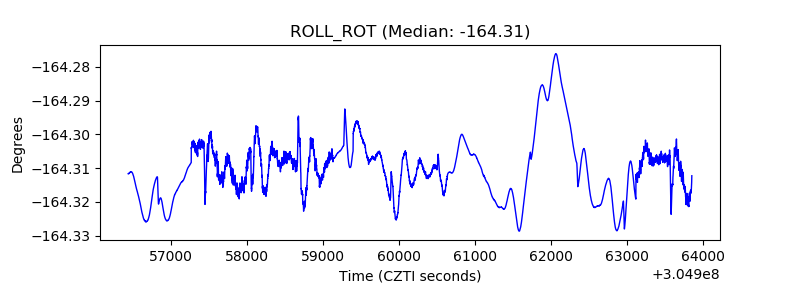 |
| _Roll_DEC | 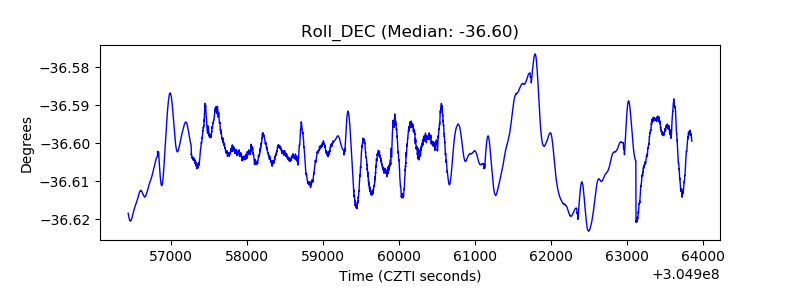 |
| _Roll_RA | 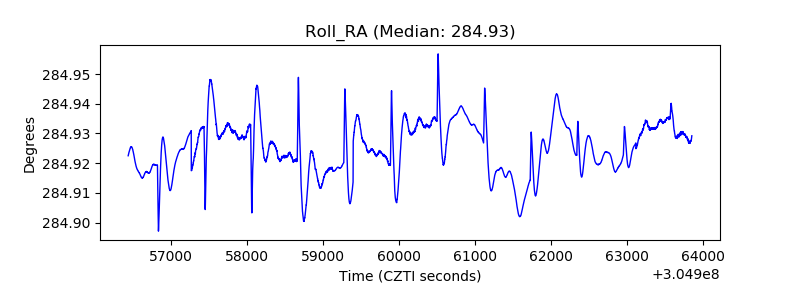 |
| Veto Counter | 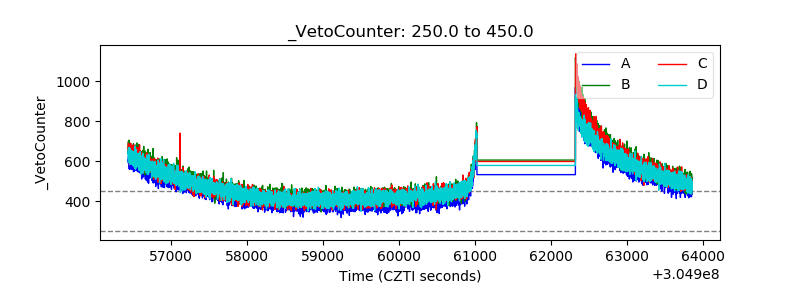 |