| Param | Original file | Final file |
|---|---|---|
| Filename | modeM0/AS1A06_005T05_9000003136_21219cztM0_level2.evt | modeM0/AS1A06_005T05_9000003136_21219cztM0_level2_quad_clean.evt |
| Size (bytes) | 527,774,400 | 95,083,200 |
| Size | 503.3 MB | 90.7 MB |
| Events in quadrant A | 3,229,973 | 645,542 |
| Events in quadrant B | 3,134,666 | 658,208 |
| Events in quadrant C | 4,304,282 | 588,233 |
| Events in quadrant D | 4,917,830 | 578,052 |
| Mode M9 | |||
|---|---|---|---|
| Quadrant | BADHDUFLAG | Total packets | Discarded packets |
| A | 0 | 13 | 0 |
| B | 0 | 13 | 0 |
| C | 0 | 13 | 0 |
| D | 0 | 13 | 0 |
| Mode M0 | |||
|---|---|---|---|
| Quadrant | BADHDUFLAG | Total packets | Discarded packets |
| A | 0 | 13294 | 1 |
| B | 0 | 13009 | 1 |
| C | 0 | 16574 | 1 |
| D | 0 | 18614 | 1 |
| Mode SS | |||
|---|---|---|---|
| Quadrant | BADHDUFLAG | Total packets | Discarded packets |
| A | 0 | 120 | 0 |
| B | 0 | 120 | 0 |
| C | 0 | 120 | 0 |
| D | 0 | 120 | 0 |
| Quadrant | Total seconds | Saturated seconds | Saturation percentage |
|---|---|---|---|
| A | 5856 | 53 | 0.905055% |
| B | 5855 | 68 | 1.161401% |
| C | 5855 | 454 | 7.754056% |
| D | 5855 | 350 | 5.977797% |
Noise dominated data is calculated using 1-second bins in cleaned event files. If a bin has >2000 counts, and if more than 50% of those come from <1% of pixels, then it is considered to be noise-dominated and hence unusable.
| Quadrant | # 1 sec bins | Bins with >0 counts | Bins with >2000 counts | High rate bins dominated by noise | Noise dominated (total time) | Noise dominated (detector-on time) | Marked lightcurve |
|---|---|---|---|---|---|---|---|
| A | 7206 | 5857 | 3 | 3 | 0.04% | 0.05% | 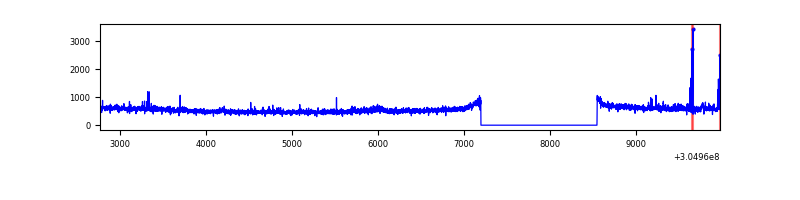 |
| B | 7205 | 5856 | 6 | 6 | 0.08% | 0.10% | 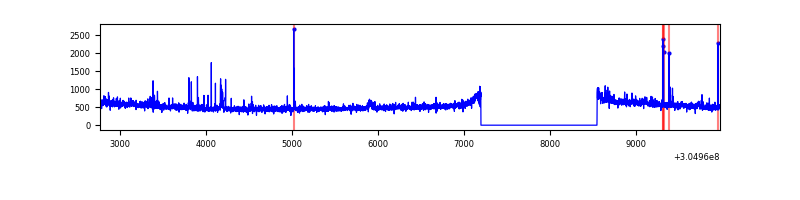 |
| C | 7205 | 5856 | 291 | 291 | 4.04% | 4.97% | 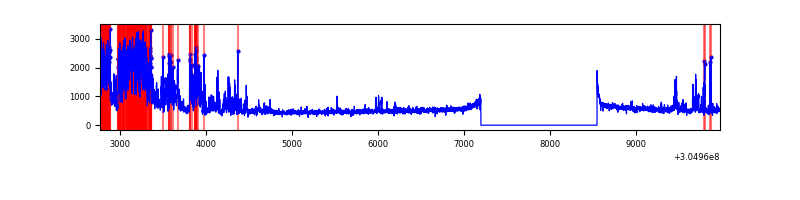 |
| D | 7205 | 5855 | 299 | 299 | 4.15% | 5.11% | 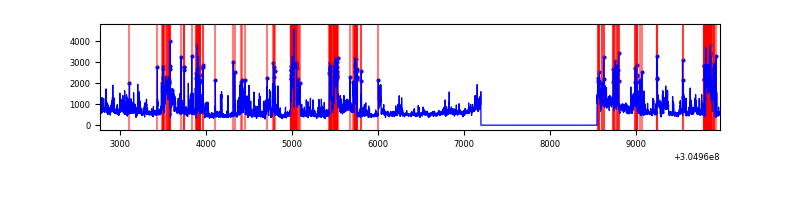 |
Top three noisy pixels from each quadrant. If the there are fewer than three noisy pixels in the level2.evt file, extra rows are filled as -1
| Pixel properties | Quadrant properties | ||||||
|---|---|---|---|---|---|---|---|
| Quadrant | DetID | PixID | Counts | Sigma | Mean | Median | Sigma |
| A | 11 | 47 | 181302 | 1163.45 | 775 | 763 | 155.2 |
| A | 15 | 236 | 52554 | 333.76 | 775 | 763 | 155.2 |
| A | 13 | 254 | 9478 | 56.16 | 775 | 763 | 155.2 |
| B | 3 | 64 | 36372 | 245.5 | 773 | 756 | 145.1 |
| B | 0 | 190 | 34190 | 230.46 | 773 | 756 | 145.1 |
| B | 0 | 219 | 17819 | 117.61 | 773 | 756 | 145.1 |
| C | 3 | 233 | 1411979 | 8530.89 | 711 | 716 | 165.4 |
| C | 14 | 238 | 112469 | 675.53 | 711 | 716 | 165.4 |
| C | 0 | 10 | 9991 | 56.07 | 711 | 716 | 165.4 |
| D | 7 | 238 | 875387 | 5002.65 | 724 | 704 | 174.8 |
| D | 15 | 0 | 304222 | 1735.94 | 724 | 704 | 174.8 |
| D | 1 | 239 | 298747 | 1704.62 | 724 | 704 | 174.8 |
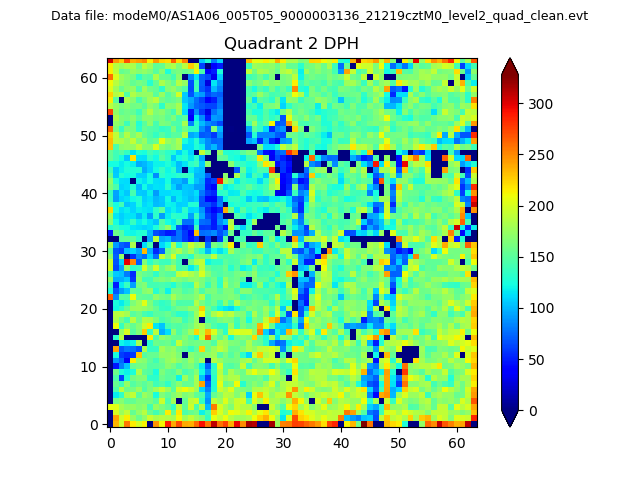
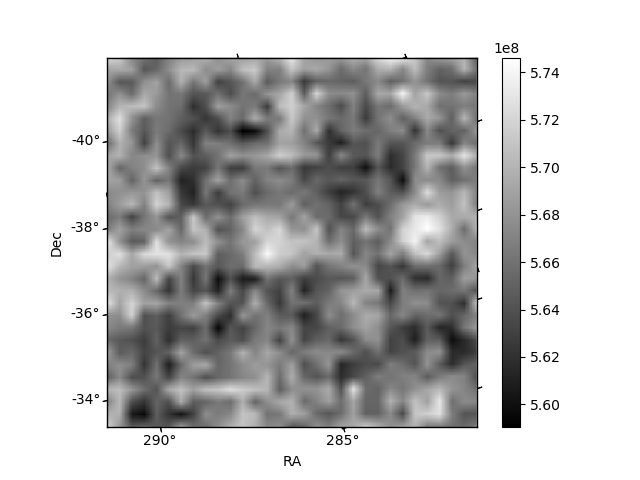
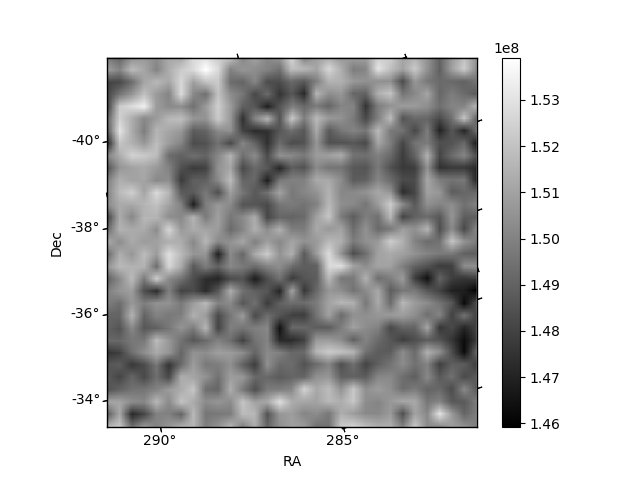
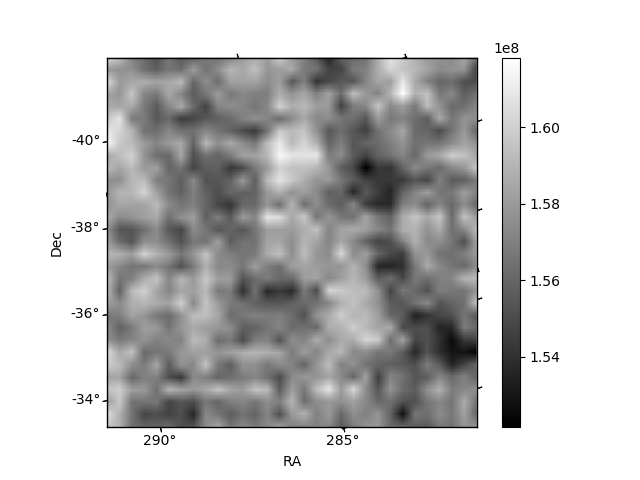
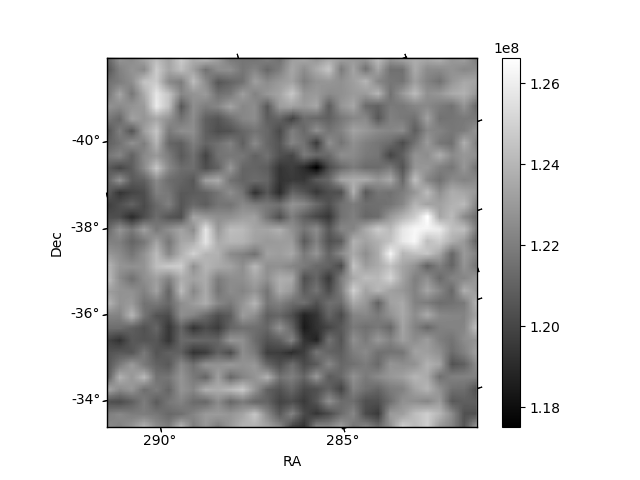
Histogram calculated using DETX and DETY for each event in the final _common_clean file
| Quadrant A | 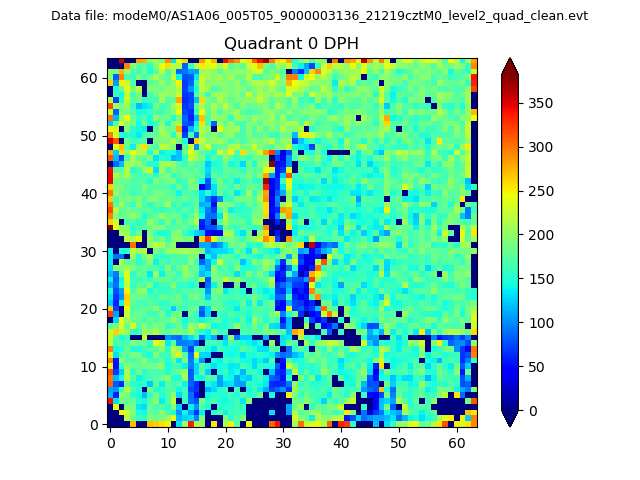 |
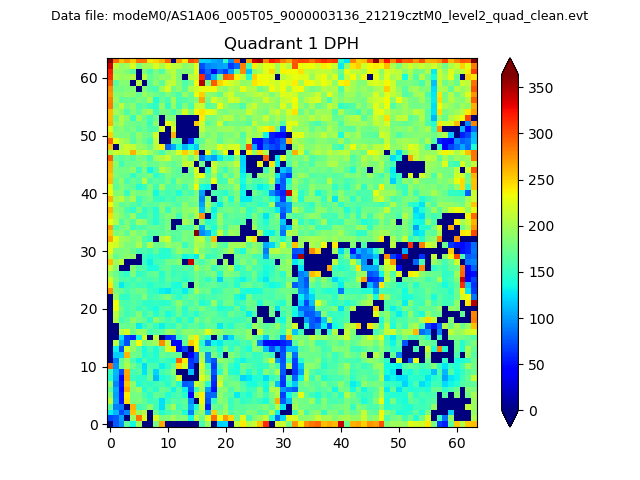 |
Quadrant B |
|---|---|---|---|
| Quadrant D | 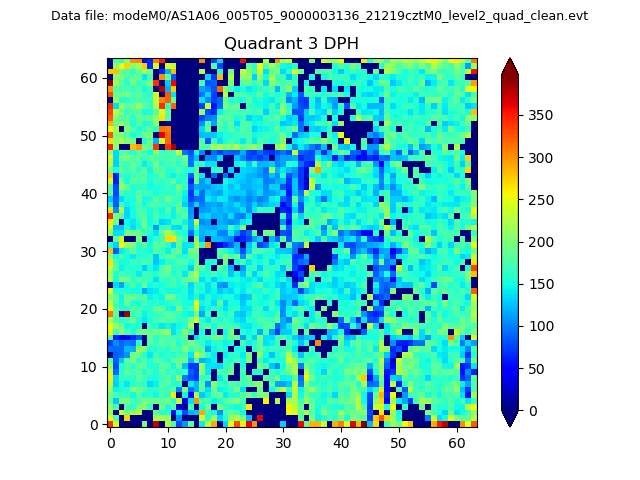 |
 |
Quadrant C |
| Plot type | Count rate plots | Images |
|---|---|---|
| Comparison with Poisson distribution Blue bars denote a histogram of data divided into 1 sec bins. Red curve is a Poisson curve with rate = median count rate of data. |
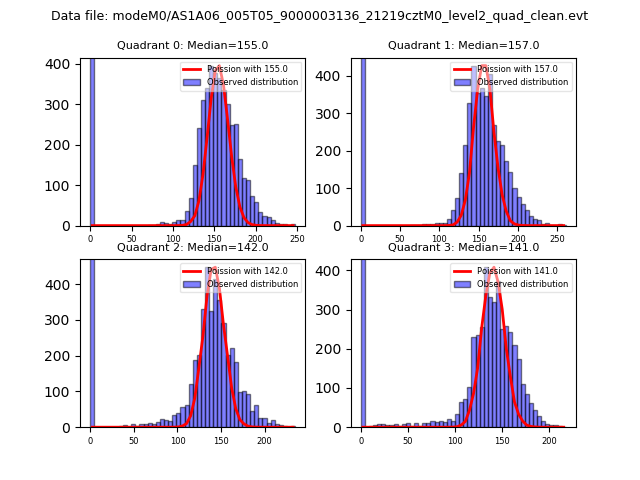 |
 |
| Quadrant-wise count rates Data is divided into 100 sec bins |
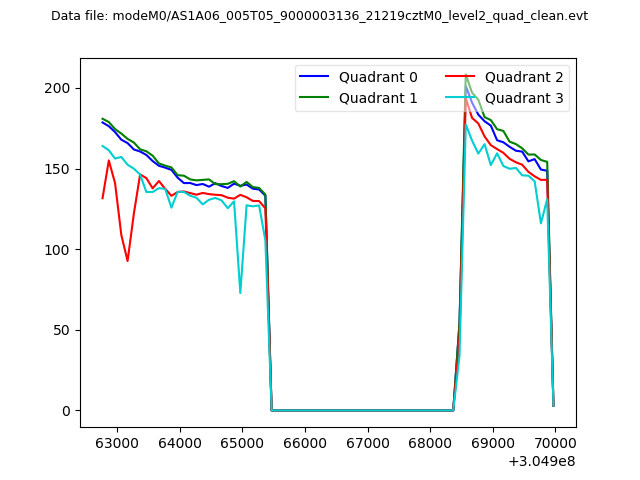 |
|
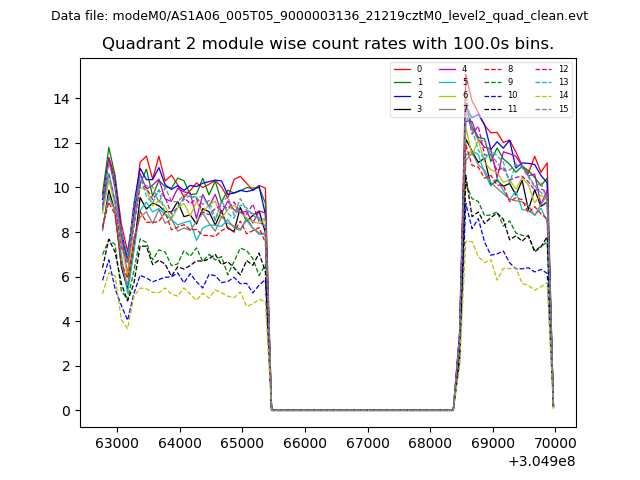
| Module-wise count rates for Quadrant A Data is divided into 100 sec bins |
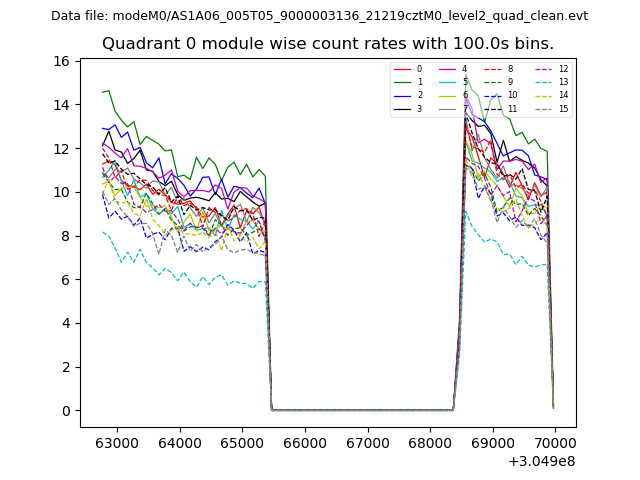 |
 |
| Module-wise count rates for Quadrant B Data is divided into 100 sec bins |
 |
 |
| Module-wise count rates for Quadrant C Data is divided into 100 sec bins |
 |
 |
| Module-wise count rates for Quadrant D Data is divided into 100 sec bins |
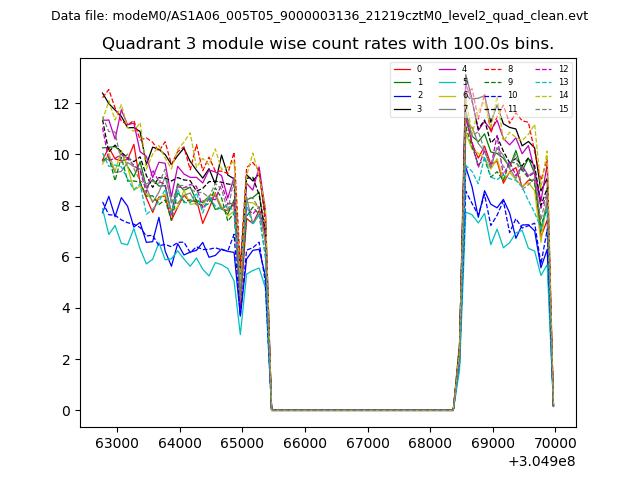 |
 |
| Parameter | Plot |
|---|---|
| CZT HV Monitor | 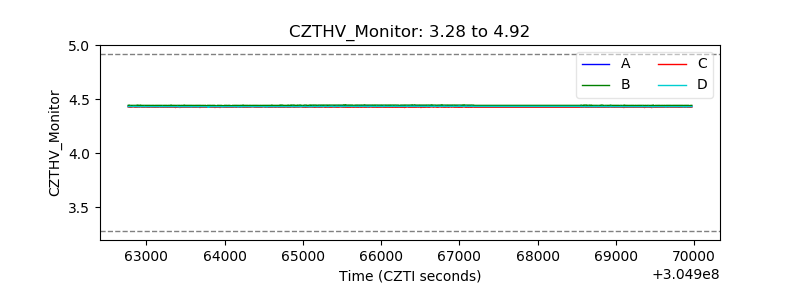 |
| D_VDD | 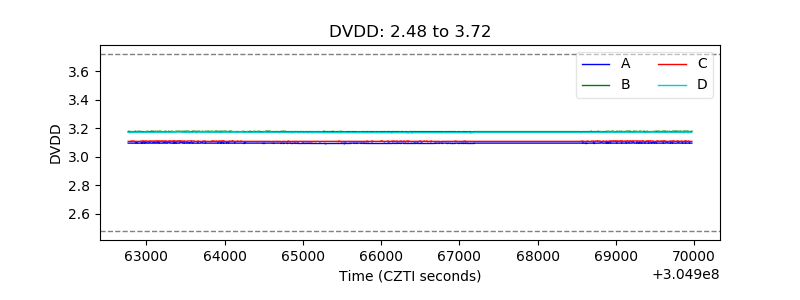 |
| Temperature 1 | 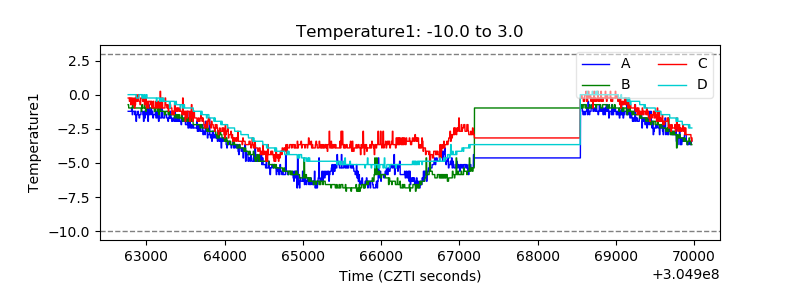 |
| Veto HV Monitor | 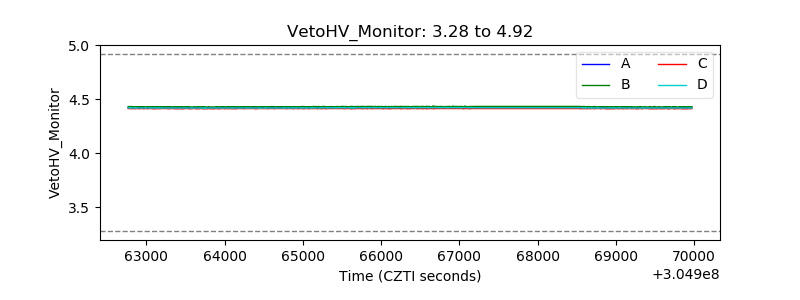 |
| Veto LLD | 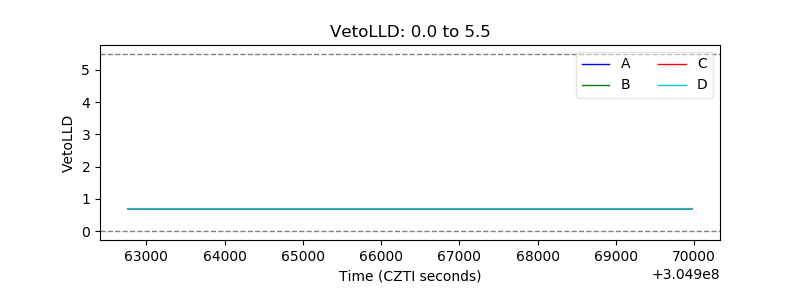 |
| Alpha Counter | 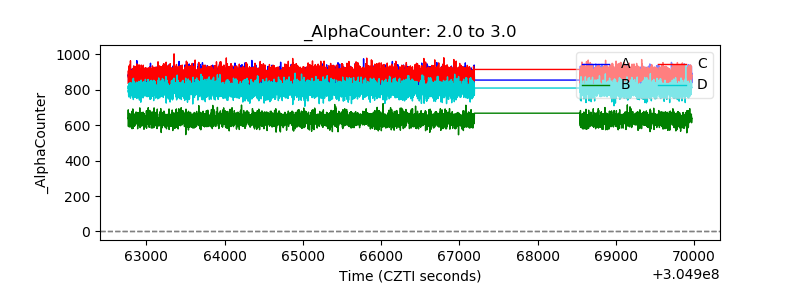 |
| _CPM_Rate | 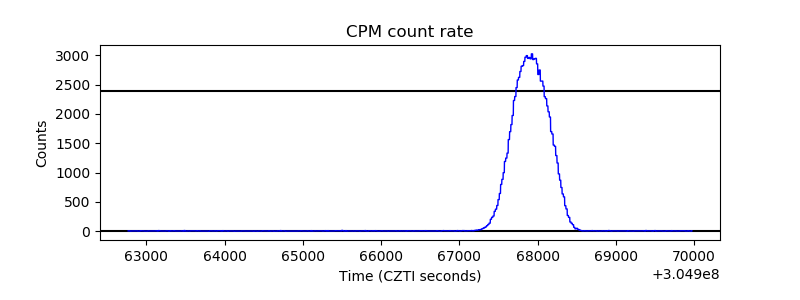 |
| CZT Counter | 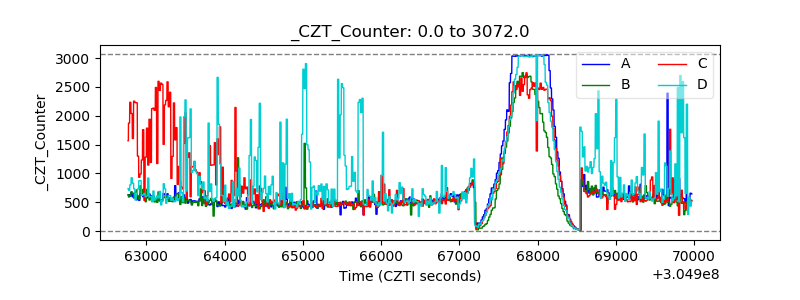 |
| +2.5 Volts monitor |  |
| +5 Volts monitor |  |
| _ROLL_ROT | 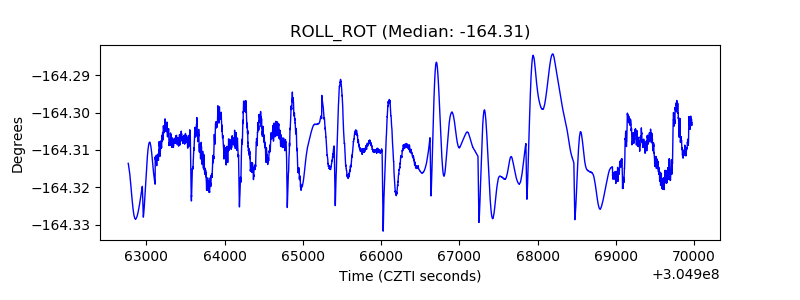 |
| _Roll_DEC | 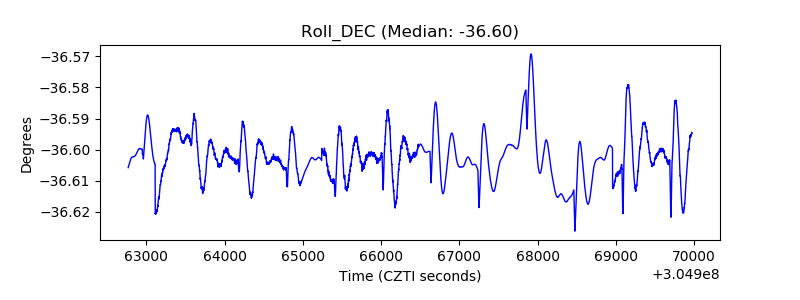 |
| _Roll_RA | 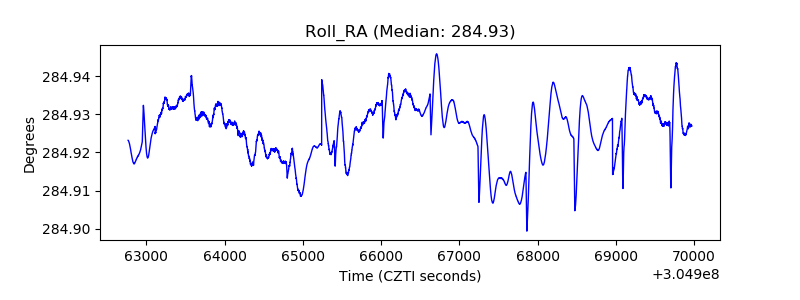 |
| Veto Counter | 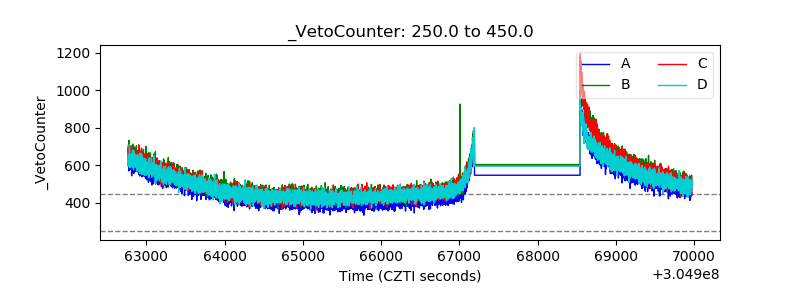 |