| Param | Original file | Final file |
|---|---|---|
| Filename | modeM0/AS1A06_005T05_9000003136_21220cztM0_level2.evt | modeM0/AS1A06_005T05_9000003136_21220cztM0_level2_quad_clean.evt |
| Size (bytes) | 493,326,720 | 98,127,360 |
| Size | 470.5 MB | 93.6 MB |
| Events in quadrant A | 3,500,085 | 648,812 |
| Events in quadrant B | 3,355,875 | 666,683 |
| Events in quadrant C | 3,366,370 | 623,165 |
| Events in quadrant D | 4,293,066 | 595,643 |
| Mode M9 | |||
|---|---|---|---|
| Quadrant | BADHDUFLAG | Total packets | Discarded packets |
| A | 0 | 17 | 0 |
| B | 0 | 18 | 0 |
| C | 0 | 18 | 0 |
| D | 0 | 18 | 0 |
| Mode M0 | |||
|---|---|---|---|
| Quadrant | BADHDUFLAG | Total packets | Discarded packets |
| A | 0 | 14305 | 2 |
| B | 0 | 13947 | 2 |
| C | 0 | 13934 | 2 |
| D | 0 | 16847 | 2 |
| Mode SS | |||
|---|---|---|---|
| Quadrant | BADHDUFLAG | Total packets | Discarded packets |
| A | 0 | 128 | 0 |
| B | 0 | 128 | 0 |
| C | 0 | 128 | 0 |
| D | 0 | 128 | 0 |
| Quadrant | Total seconds | Saturated seconds | Saturation percentage |
|---|---|---|---|
| A | 6263 | 61 | 0.973974% |
| B | 6263 | 66 | 1.053808% |
| C | 6262 | 102 | 1.628873% |
| D | 6262 | 203 | 3.241776% |
Noise dominated data is calculated using 1-second bins in cleaned event files. If a bin has >2000 counts, and if more than 50% of those come from <1% of pixels, then it is considered to be noise-dominated and hence unusable.
| Quadrant | # 1 sec bins | Bins with >0 counts | Bins with >2000 counts | High rate bins dominated by noise | Noise dominated (total time) | Noise dominated (detector-on time) | Marked lightcurve |
|---|---|---|---|---|---|---|---|
| A | 7663 | 6264 | 3 | 3 | 0.04% | 0.05% | 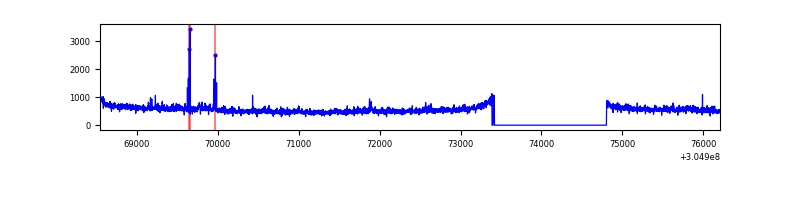 |
| B | 7663 | 6265 | 8 | 8 | 0.10% | 0.13% | 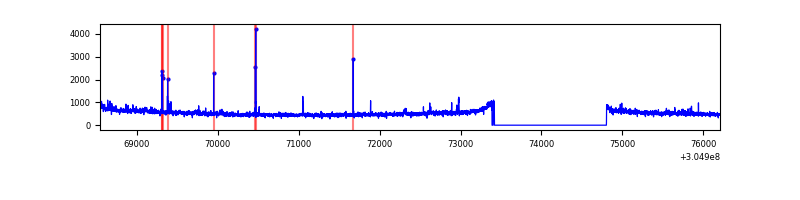 |
| C | 7662 | 6264 | 7 | 7 | 0.09% | 0.11% | 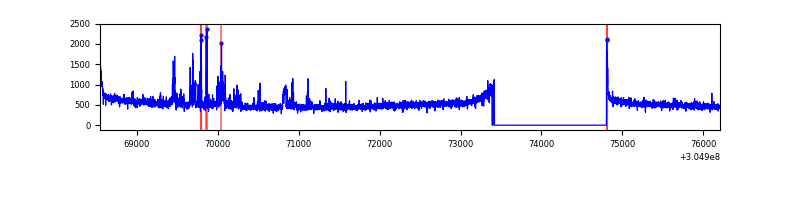 |
| D | 7662 | 6264 | 153 | 153 | 2.00% | 2.44% | 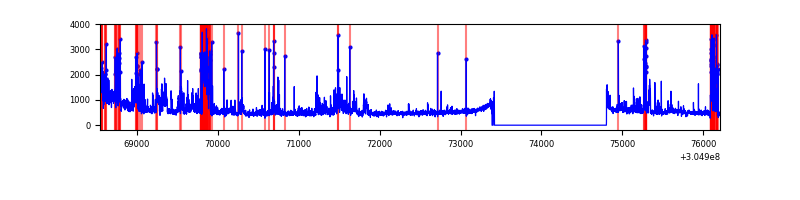 |
Top three noisy pixels from each quadrant. If the there are fewer than three noisy pixels in the level2.evt file, extra rows are filled as -1
| Pixel properties | Quadrant properties | ||||||
|---|---|---|---|---|---|---|---|
| Quadrant | DetID | PixID | Counts | Sigma | Mean | Median | Sigma |
| A | 11 | 47 | 250515 | 1519.62 | 826 | 813 | 164.3 |
| A | 15 | 236 | 53054 | 317.92 | 826 | 813 | 164.3 |
| A | 13 | 254 | 9874 | 55.14 | 826 | 813 | 164.3 |
| B | 3 | 64 | 38835 | 246.32 | 827 | 811 | 154.4 |
| B | 0 | 219 | 20850 | 129.81 | 827 | 811 | 154.4 |
| B | 12 | 111 | 16953 | 104.57 | 827 | 811 | 154.4 |
| C | 3 | 233 | 164120 | 909.79 | 777 | 782 | 179.5 |
| C | 14 | 238 | 124158 | 687.21 | 777 | 782 | 179.5 |
| C | 0 | 10 | 27674 | 149.79 | 777 | 782 | 179.5 |
| D | 7 | 238 | 456099 | 2401.71 | 781 | 760 | 189.6 |
| D | 1 | 239 | 376514 | 1981.93 | 781 | 760 | 189.6 |
| D | 1 | 20 | 159896 | 839.37 | 781 | 760 | 189.6 |
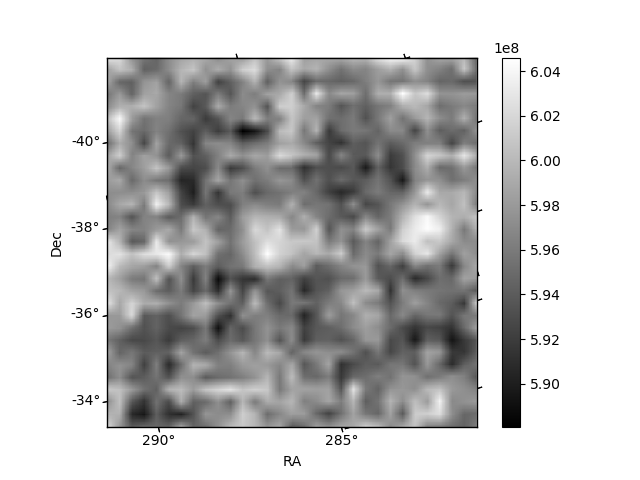
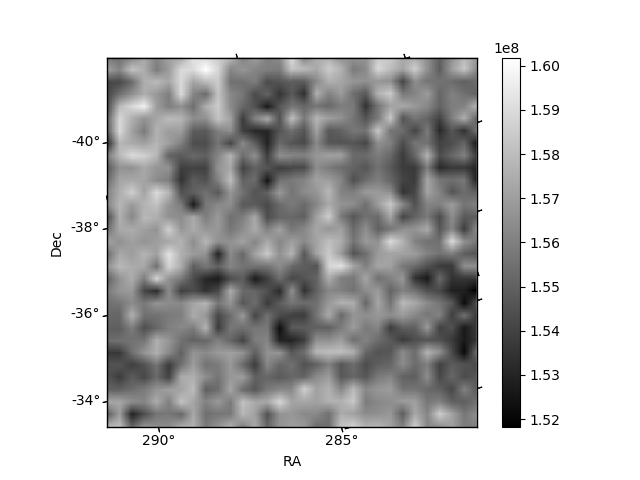
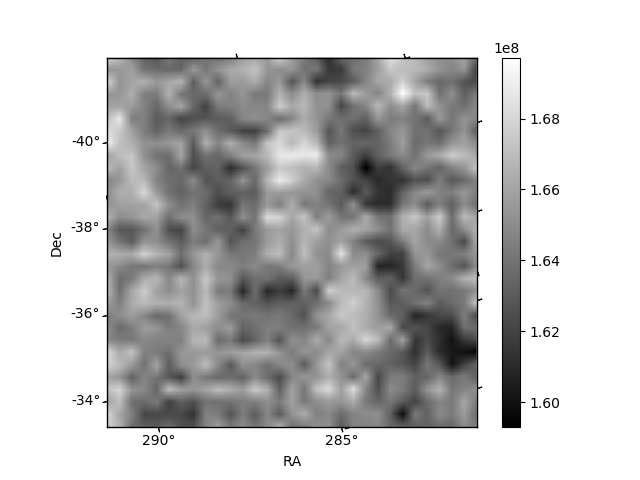
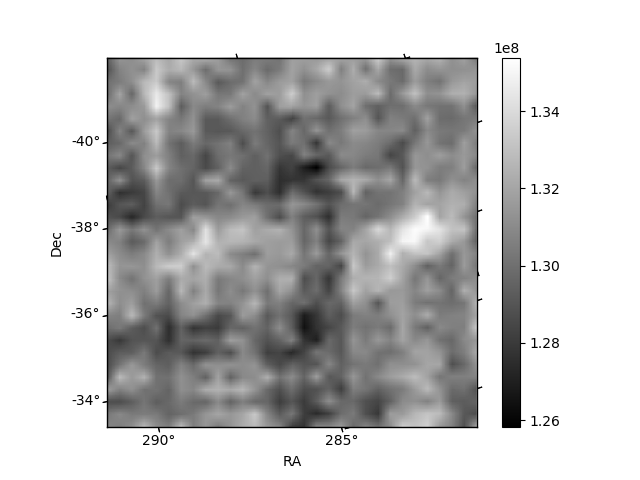
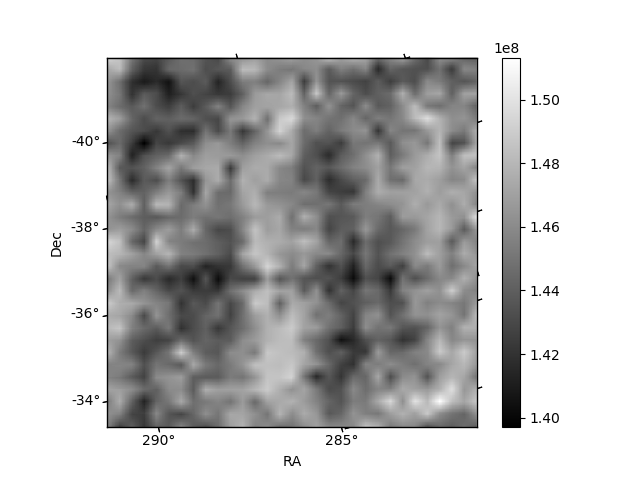
Histogram calculated using DETX and DETY for each event in the final _common_clean file
| Quadrant A | 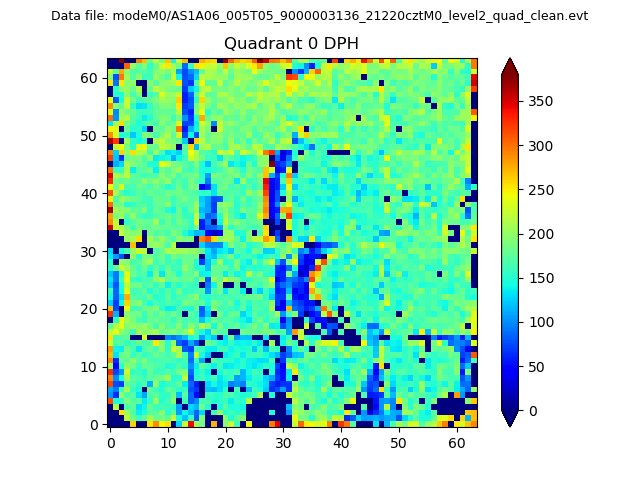 |
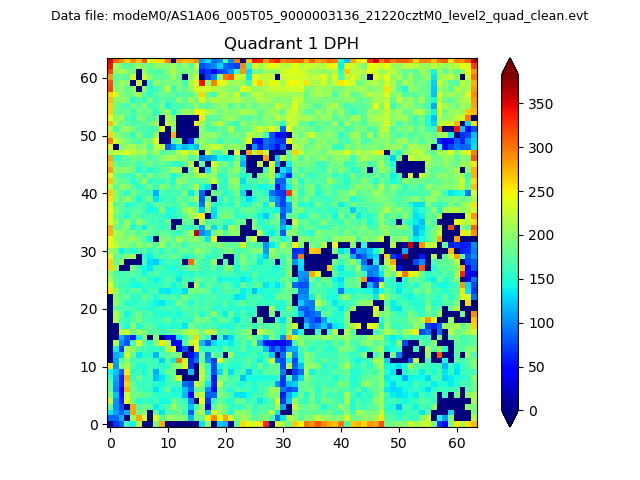 |
Quadrant B |
|---|---|---|---|
| Quadrant D | 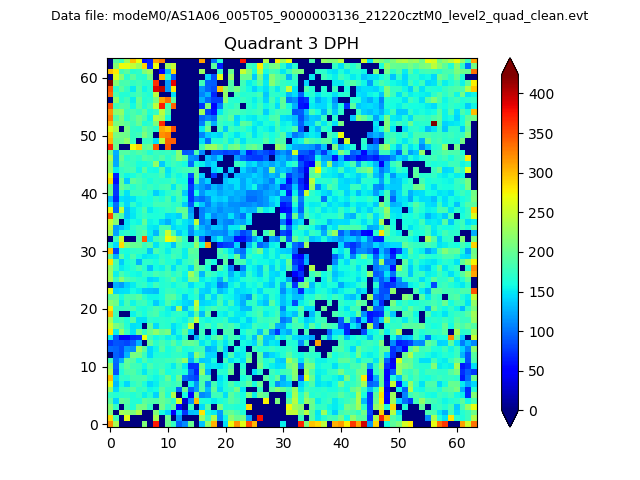 |
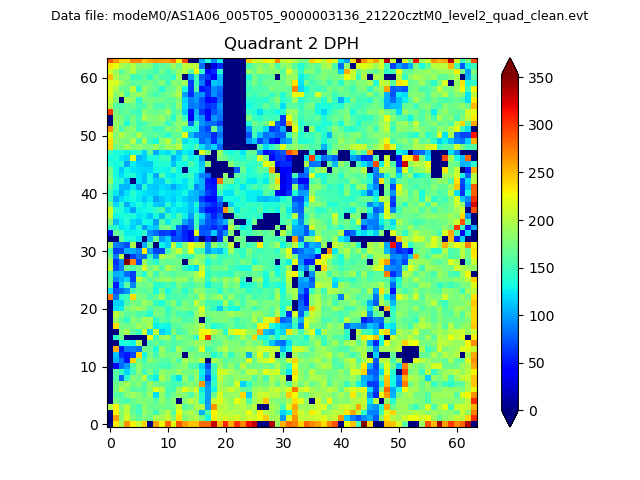 |
Quadrant C |
| Plot type | Count rate plots | Images |
|---|---|---|
| Comparison with Poisson distribution Blue bars denote a histogram of data divided into 1 sec bins. Red curve is a Poisson curve with rate = median count rate of data. |
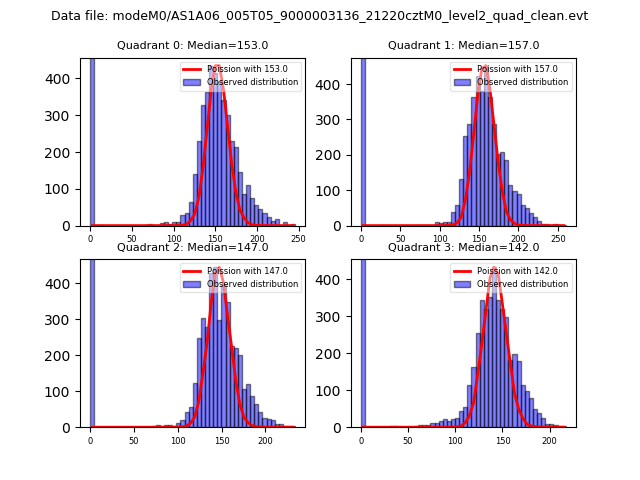 |
 |
| Quadrant-wise count rates Data is divided into 100 sec bins |
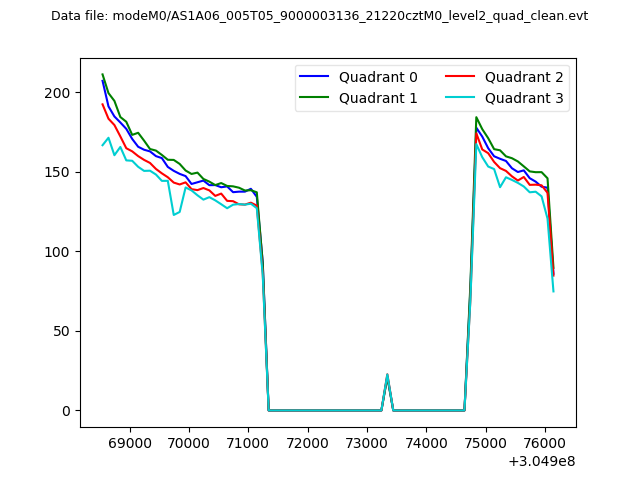 |
|
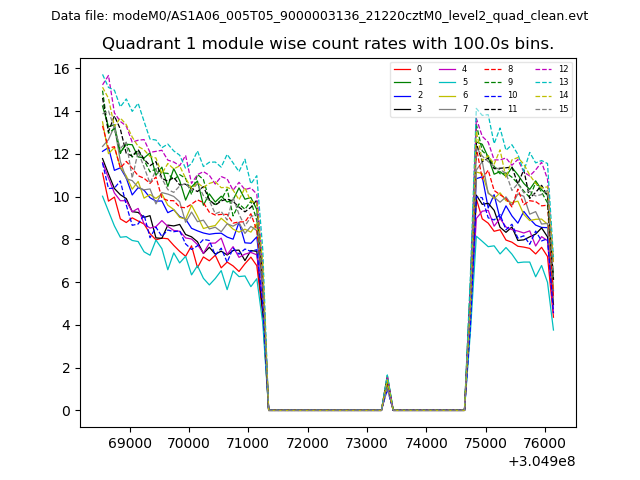
| Module-wise count rates for Quadrant A Data is divided into 100 sec bins |
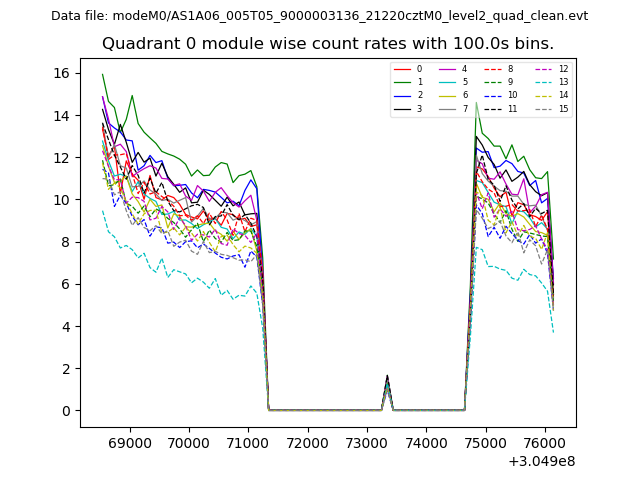 |
 |
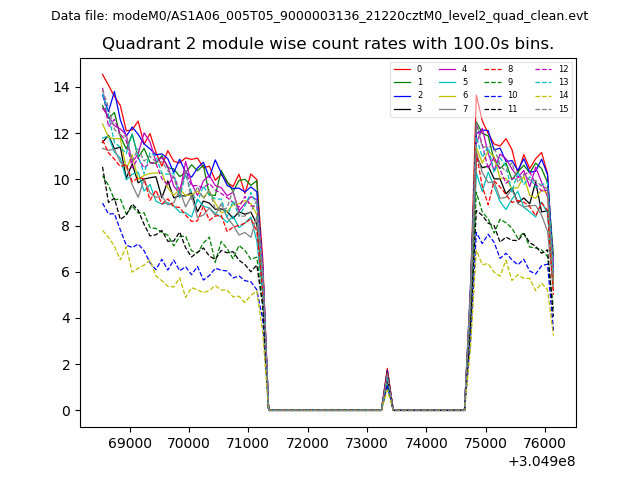
| Module-wise count rates for Quadrant B Data is divided into 100 sec bins |
 |
 |
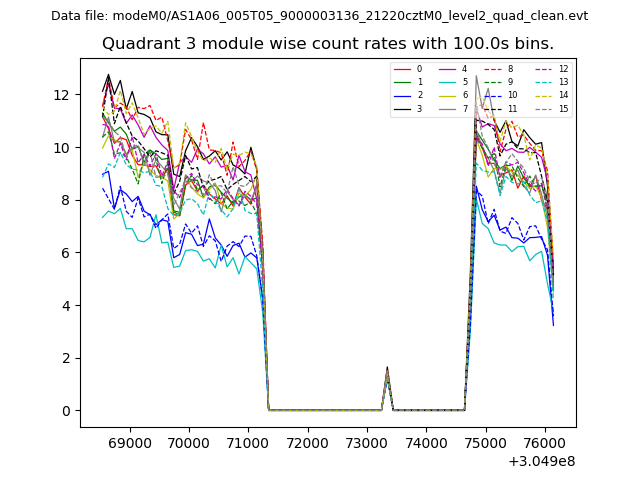
| Module-wise count rates for Quadrant C Data is divided into 100 sec bins |
 |
 |
| Module-wise count rates for Quadrant D Data is divided into 100 sec bins |
 |
 |
| Parameter | Plot |
|---|---|
| CZT HV Monitor | 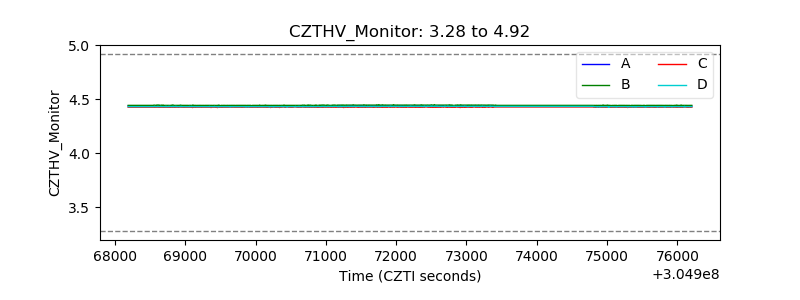 |
| D_VDD | 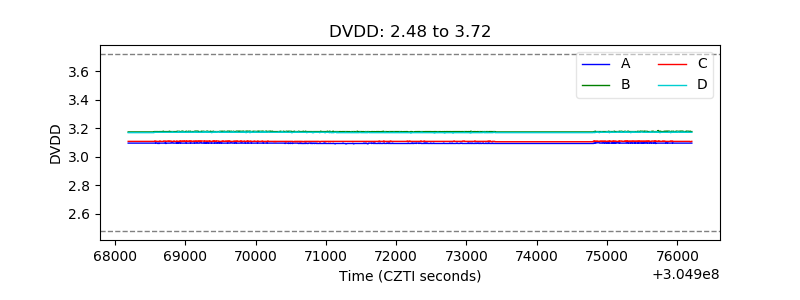 |
| Temperature 1 | 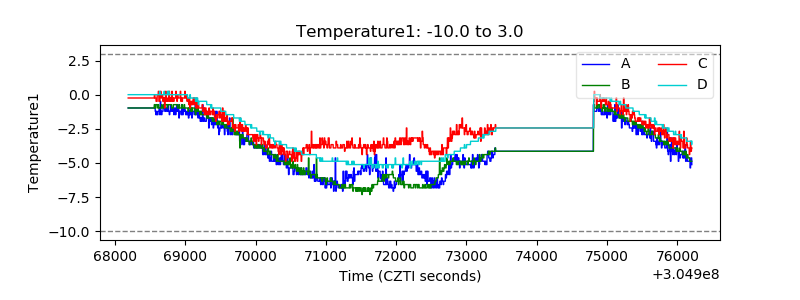 |
| Veto HV Monitor | 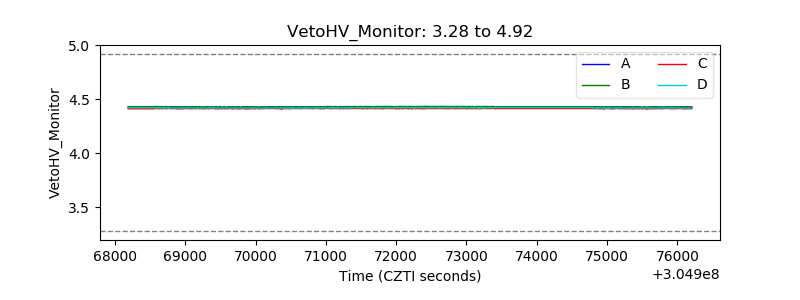 |
| Veto LLD | 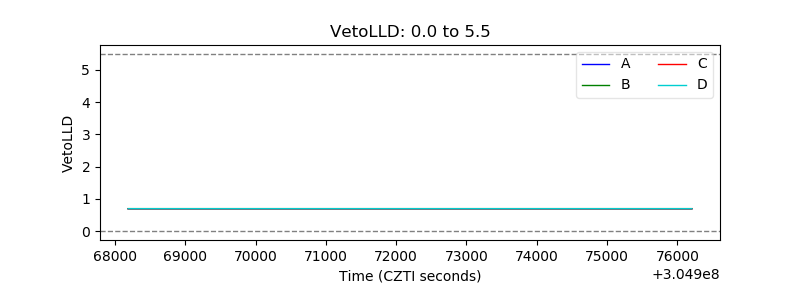 |
| Alpha Counter | 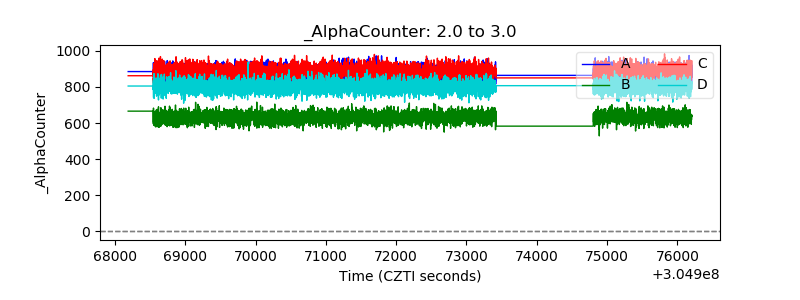 |
| _CPM_Rate | 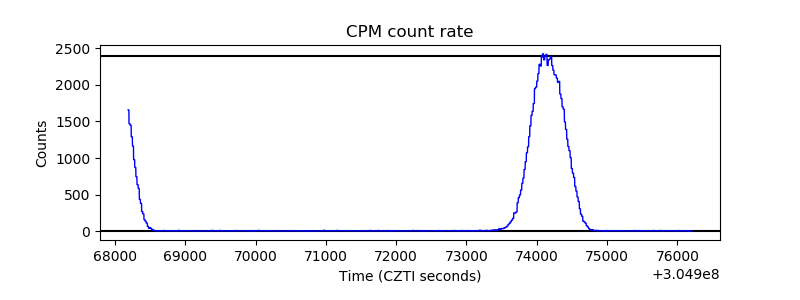 |
| CZT Counter | 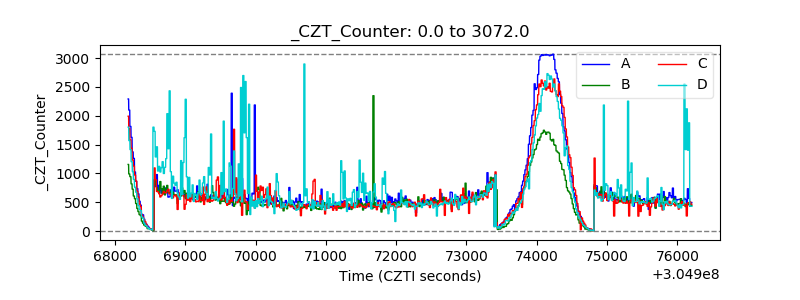 |
| +2.5 Volts monitor | 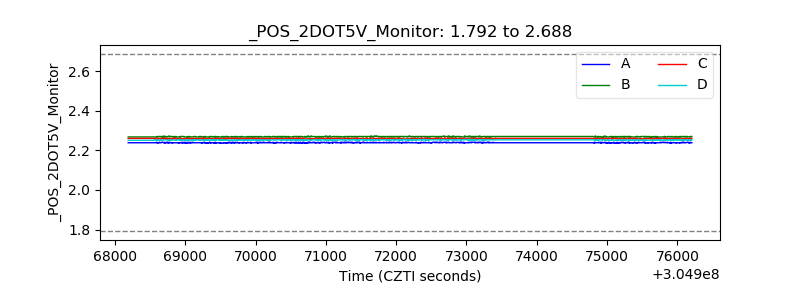 |
| +5 Volts monitor | 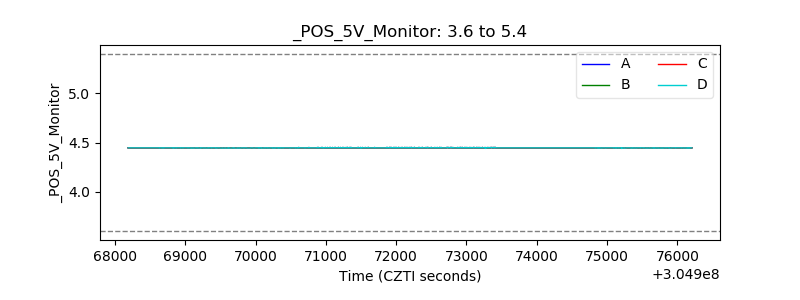 |
| _ROLL_ROT | 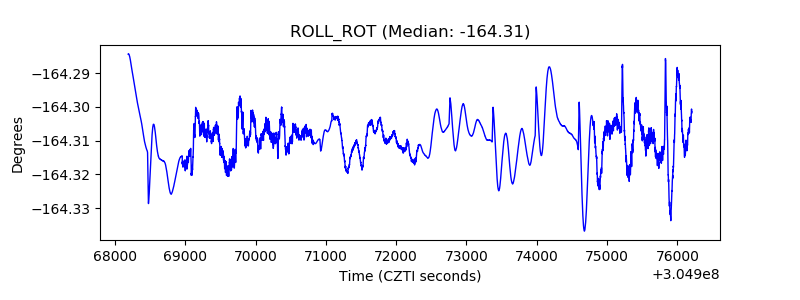 |
| _Roll_DEC | 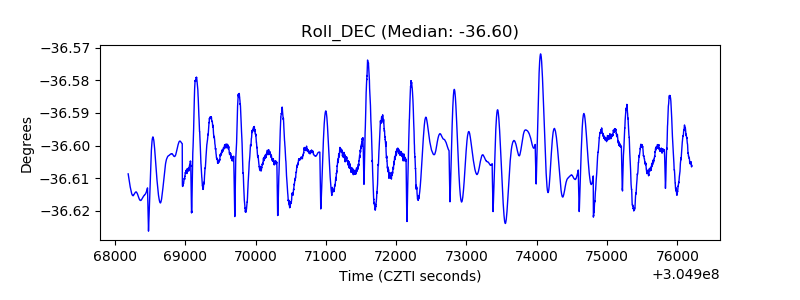 |
| _Roll_RA | 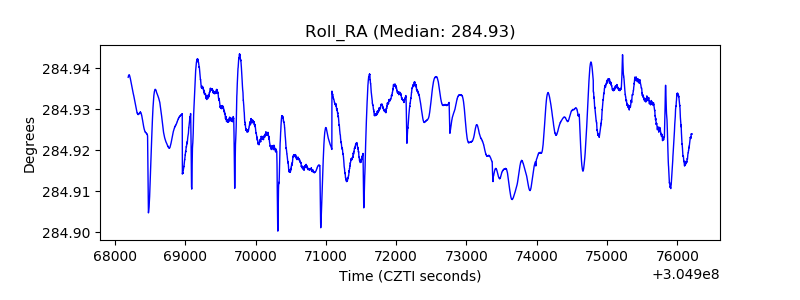 |
| Veto Counter | 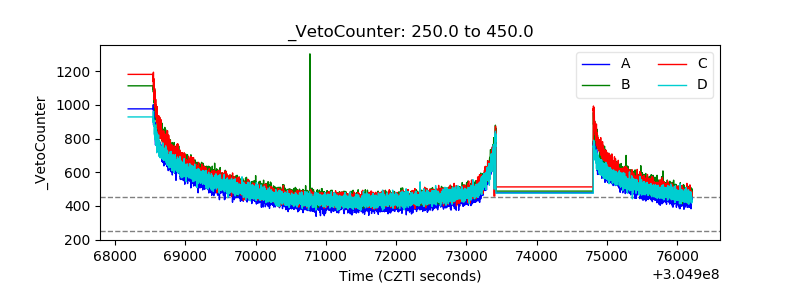 |