| Param | Original file | Final file |
|---|---|---|
| Filename | modeM0/AS1A06_005T05_9000003136_21221cztM0_level2.evt | modeM0/AS1A06_005T05_9000003136_21221cztM0_level2_quad_clean.evt |
| Size (bytes) | 286,686,720 | 41,716,800 |
| Size | 273.4 MB | 39.8 MB |
| Events in quadrant A | 1,786,827 | 258,817 |
| Events in quadrant B | 1,855,180 | 268,900 |
| Events in quadrant C | 1,808,595 | 255,546 |
| Events in quadrant D | 2,994,057 | 232,757 |
| Mode M9 | |||
|---|---|---|---|
| Quadrant | BADHDUFLAG | Total packets | Discarded packets |
| A | 0 | 13 | 0 |
| B | 0 | 13 | 0 |
| C | 0 | 13 | 0 |
| D | 0 | 13 | 0 |
| Mode M0 | |||
|---|---|---|---|
| Quadrant | BADHDUFLAG | Total packets | Discarded packets |
| A | 0 | 7468 | 1 |
| B | 0 | 7673 | 1 |
| C | 0 | 7562 | 1 |
| D | 0 | 11244 | 1 |
| Mode SS | |||
|---|---|---|---|
| Quadrant | BADHDUFLAG | Total packets | Discarded packets |
| A | 0 | 72 | 0 |
| B | 0 | 72 | 0 |
| C | 0 | 72 | 0 |
| D | 0 | 72 | 0 |
| Quadrant | Total seconds | Saturated seconds | Saturation percentage |
|---|---|---|---|
| A | 3478 | 36 | 1.035078% |
| B | 3479 | 58 | 1.667146% |
| C | 3479 | 78 | 2.242024% |
| D | 3479 | 286 | 8.220753% |
Noise dominated data is calculated using 1-second bins in cleaned event files. If a bin has >2000 counts, and if more than 50% of those come from <1% of pixels, then it is considered to be noise-dominated and hence unusable.
| Quadrant | # 1 sec bins | Bins with >0 counts | Bins with >2000 counts | High rate bins dominated by noise | Noise dominated (total time) | Noise dominated (detector-on time) | Marked lightcurve |
|---|---|---|---|---|---|---|---|
| A | 4773 | 3479 | 0 | 0 | 0.00% | 0.00% | 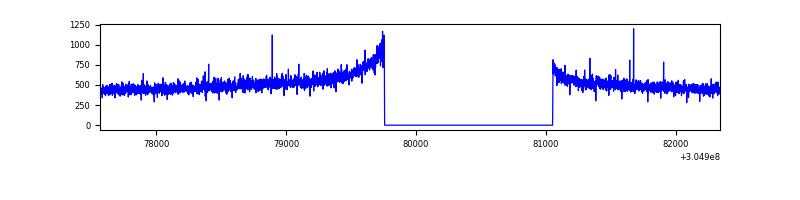 |
| B | 4774 | 3479 | 1 | 1 | 0.02% | 0.03% | 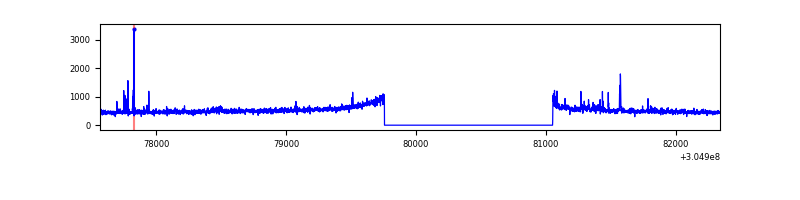 |
| C | 4774 | 3480 | 6 | 6 | 0.13% | 0.17% | 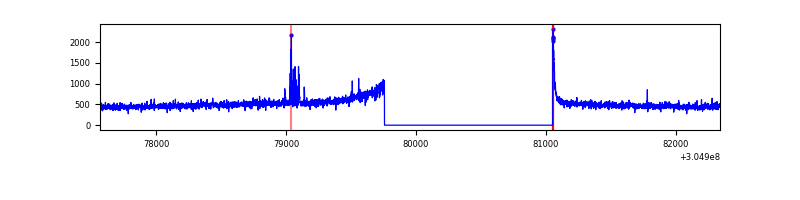 |
| D | 4774 | 3480 | 298 | 298 | 6.24% | 8.56% | 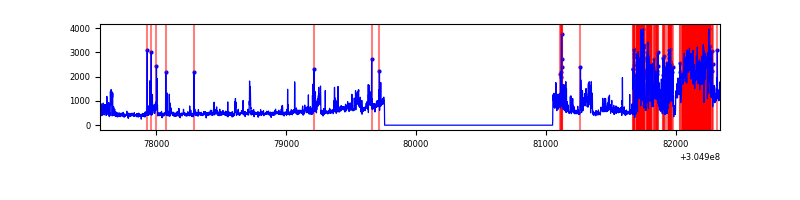 |
Top three noisy pixels from each quadrant. If the there are fewer than three noisy pixels in the level2.evt file, extra rows are filled as -1
| Pixel properties | Quadrant properties | ||||||
|---|---|---|---|---|---|---|---|
| Quadrant | DetID | PixID | Counts | Sigma | Mean | Median | Sigma |
| A | 15 | 236 | 21546 | 227.31 | 453 | 444 | 92.8 |
| A | 11 | 47 | 20441 | 215.4 | 453 | 444 | 92.8 |
| A | 13 | 254 | 4839 | 47.34 | 453 | 444 | 92.8 |
| B | 3 | 64 | 17619 | 195.32 | 456 | 444 | 87.9 |
| B | 0 | 228 | 16608 | 183.83 | 456 | 444 | 87.9 |
| B | 0 | 229 | 10983 | 119.86 | 456 | 444 | 87.9 |
| C | 14 | 238 | 67360 | 657.21 | 432 | 435 | 101.8 |
| C | 3 | 233 | 27751 | 268.25 | 432 | 435 | 101.8 |
| C | 0 | 10 | 22538 | 217.05 | 432 | 435 | 101.8 |
| D | 13 | 174 | 725131 | 6824.99 | 427 | 414 | 106.2 |
| D | 7 | 238 | 394795 | 3714.07 | 427 | 414 | 106.2 |
| D | 15 | 0 | 79042 | 740.48 | 427 | 414 | 106.2 |
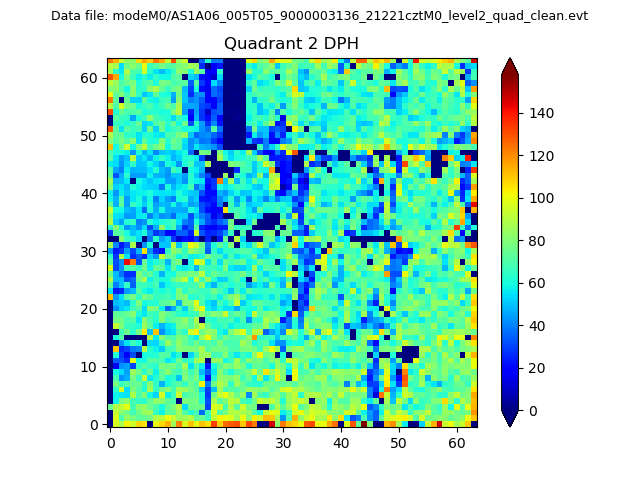
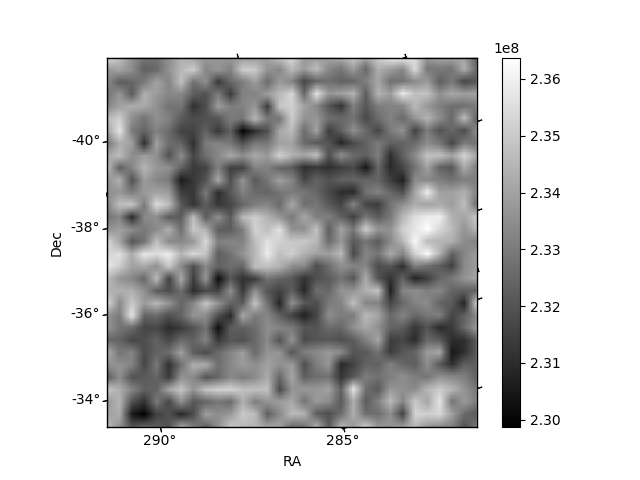
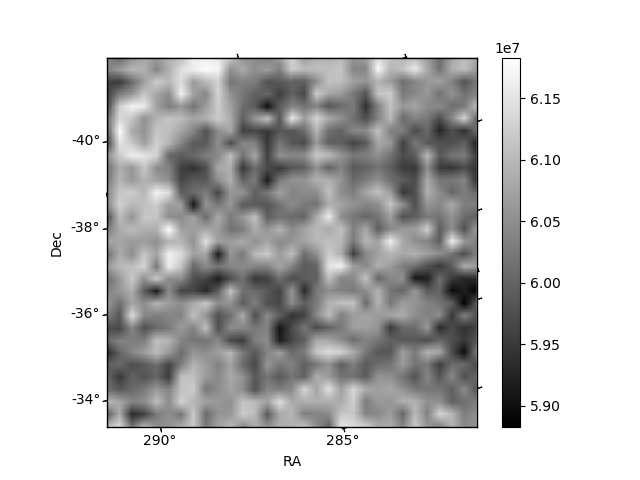
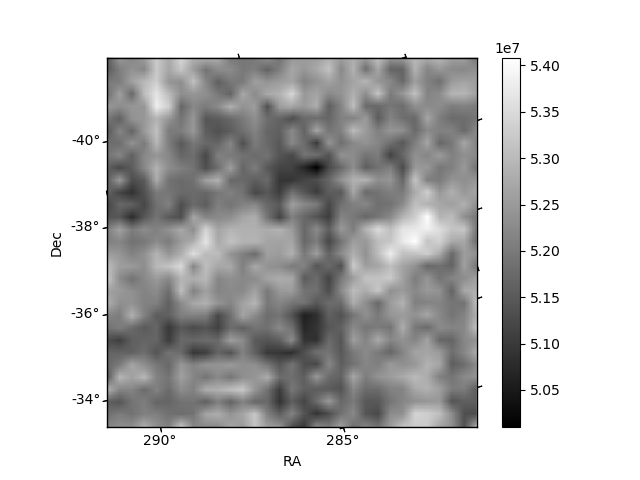
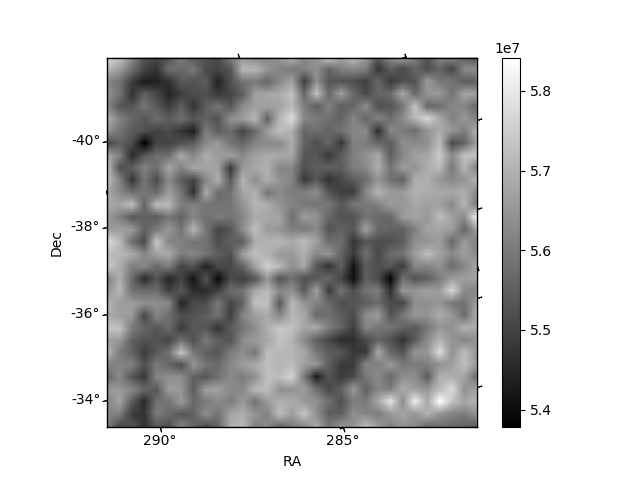
Histogram calculated using DETX and DETY for each event in the final _common_clean file
| Quadrant A | 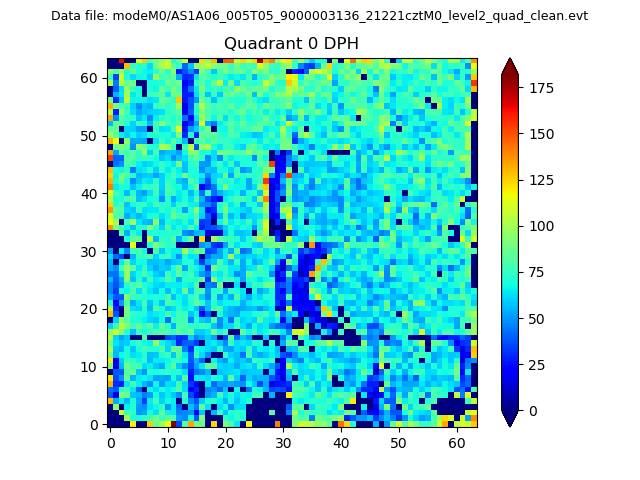 |
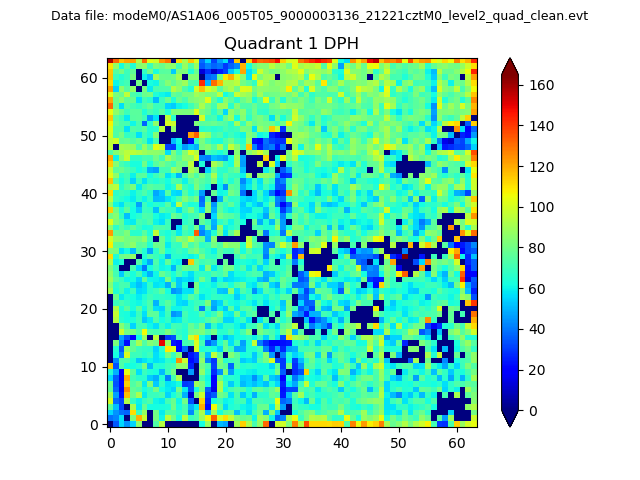 |
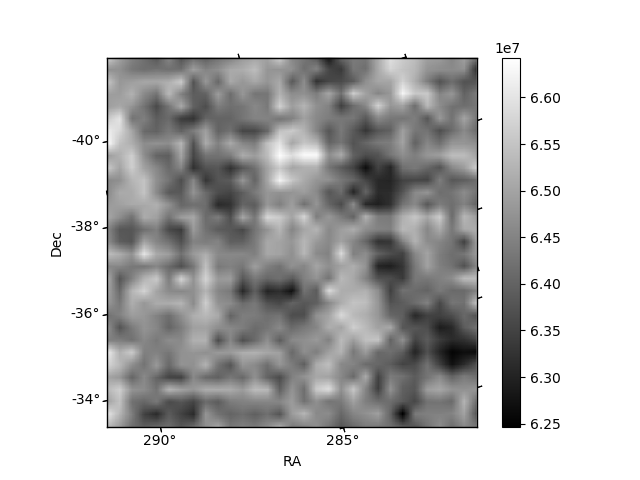
Quadrant B |
|---|---|---|---|
| Quadrant D | 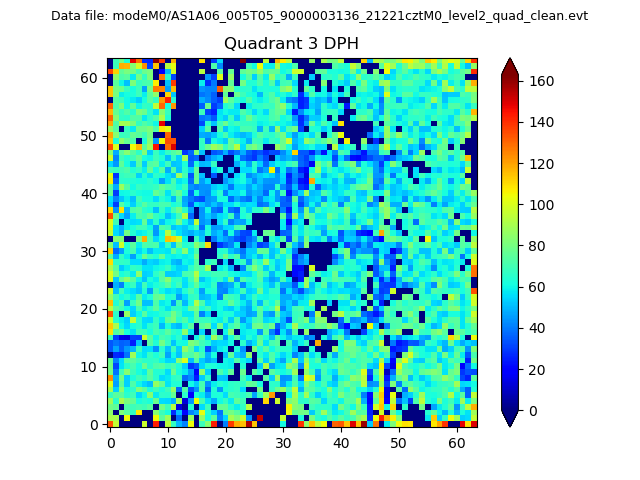 |
 |
Quadrant C |
| Plot type | Count rate plots | Images |
|---|---|---|
| Comparison with Poisson distribution Blue bars denote a histogram of data divided into 1 sec bins. Red curve is a Poisson curve with rate = median count rate of data. |
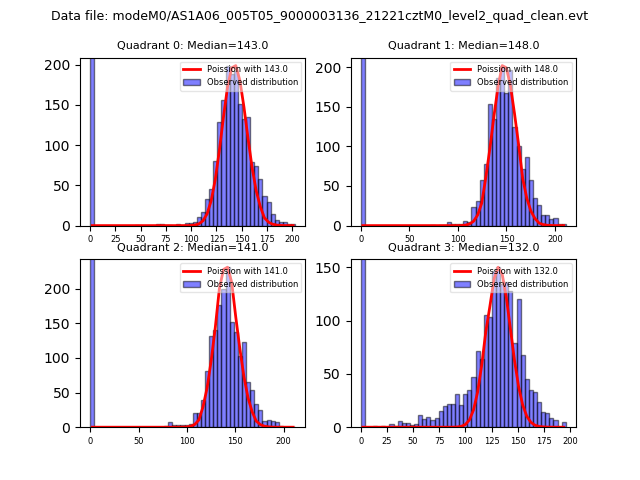 |
 |
| Quadrant-wise count rates Data is divided into 100 sec bins |
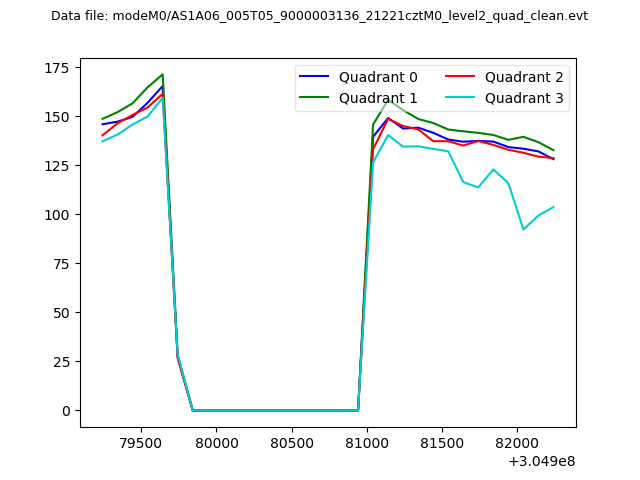 |
|
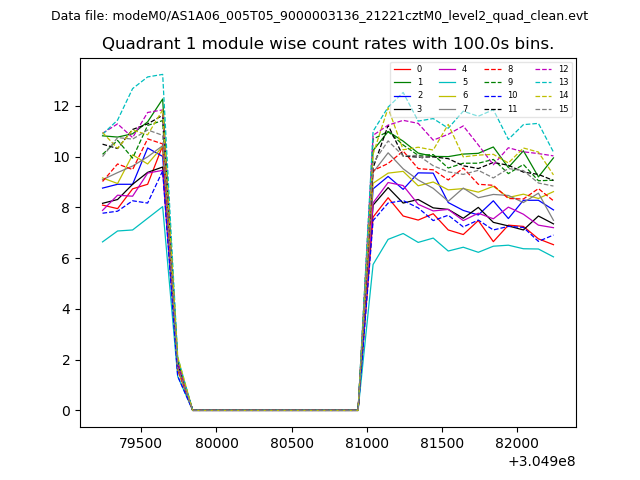
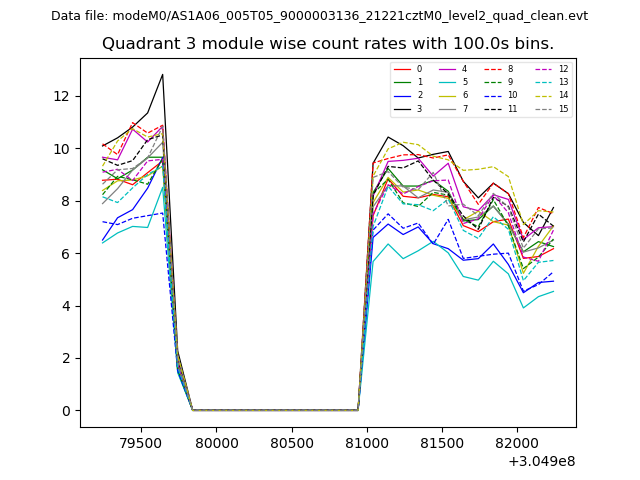
| Module-wise count rates for Quadrant A Data is divided into 100 sec bins |
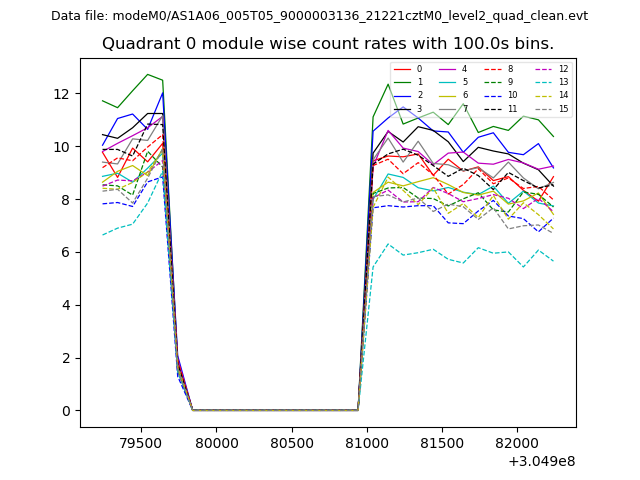 |
 |
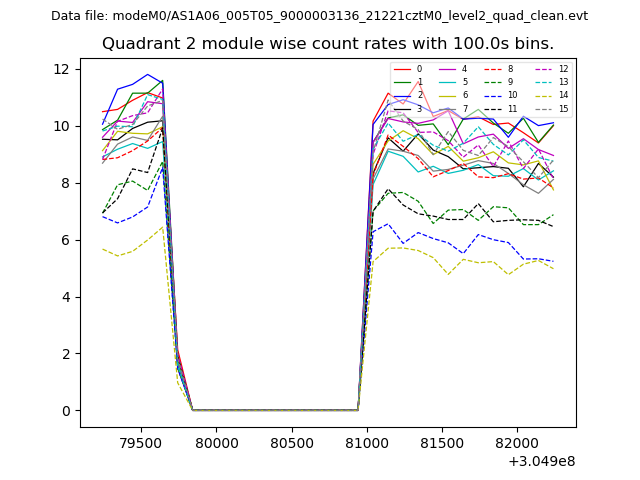
| Module-wise count rates for Quadrant B Data is divided into 100 sec bins |
 |
 |
| Module-wise count rates for Quadrant C Data is divided into 100 sec bins |
 |
 |
| Module-wise count rates for Quadrant D Data is divided into 100 sec bins |
 |
 |
| Parameter | Plot |
|---|---|
| CZT HV Monitor | 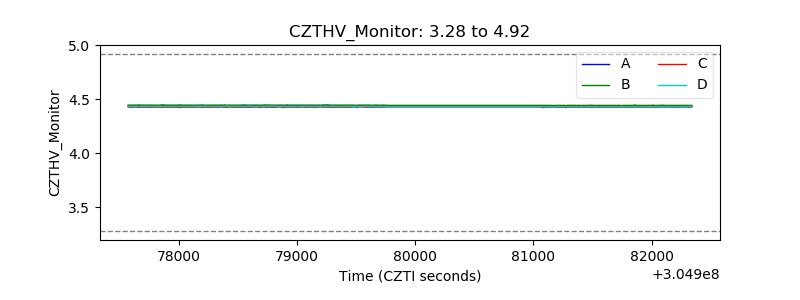 |
| D_VDD | 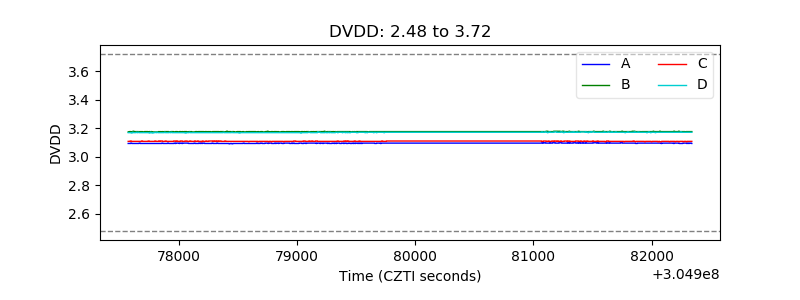 |
| Temperature 1 | 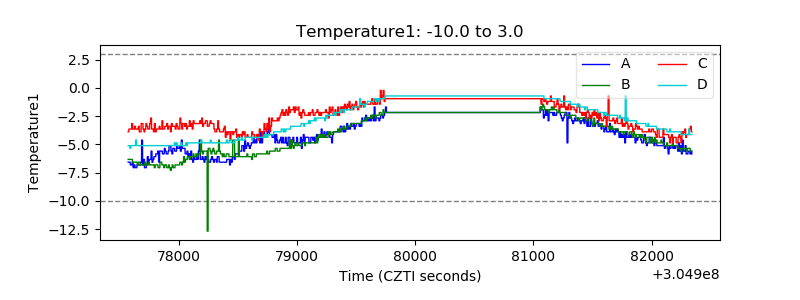 |
| Veto HV Monitor | 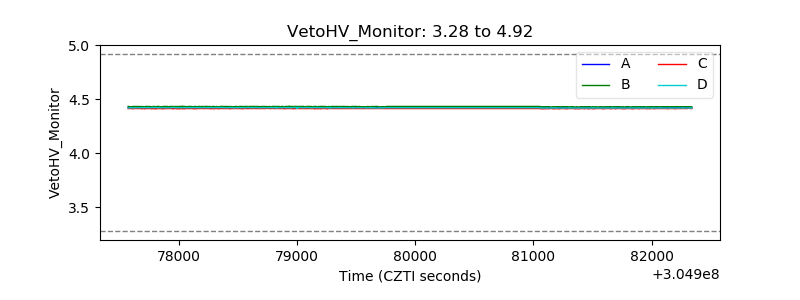 |
| Veto LLD | 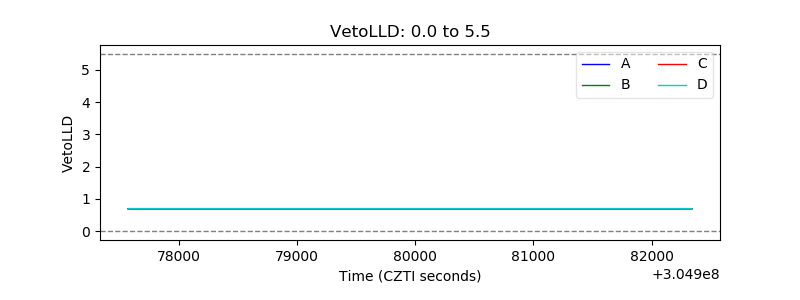 |
| Alpha Counter | 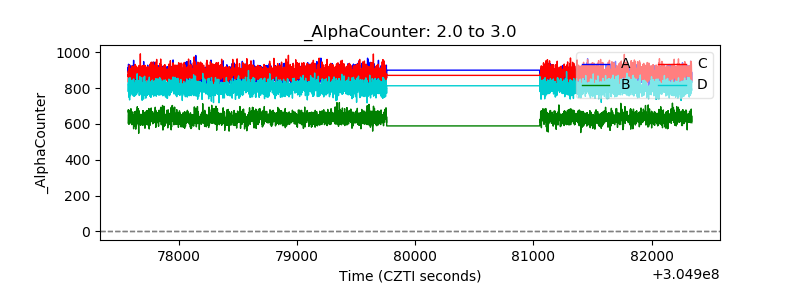 |
| _CPM_Rate | 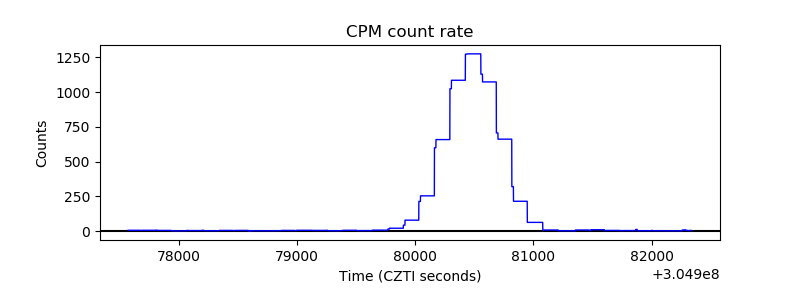 |
| CZT Counter | 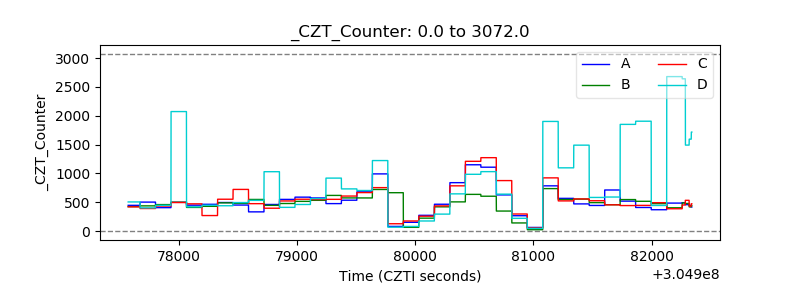 |
| +2.5 Volts monitor | 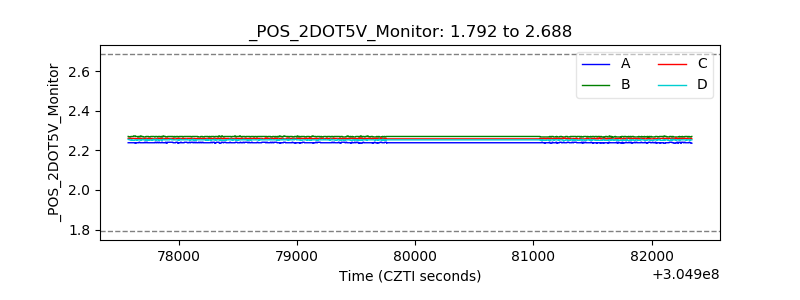 |
| +5 Volts monitor | 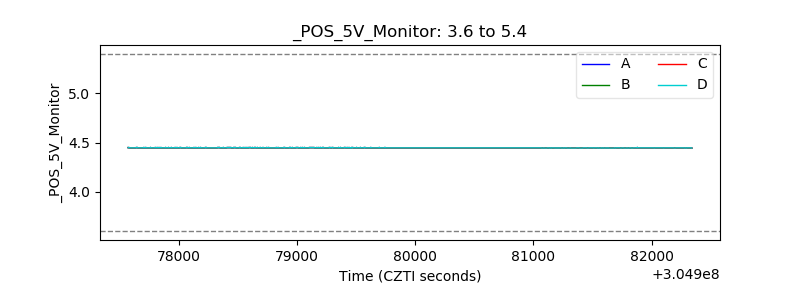 |
| _ROLL_ROT | 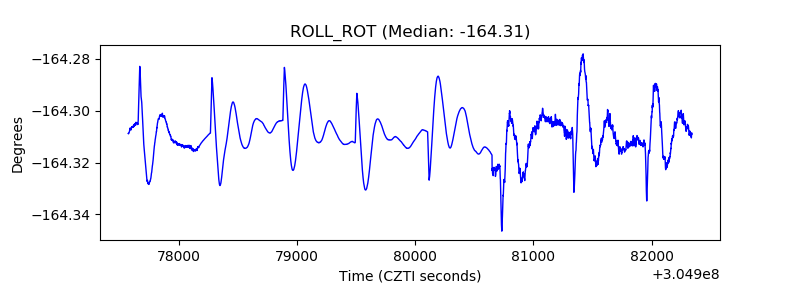 |
| _Roll_DEC | 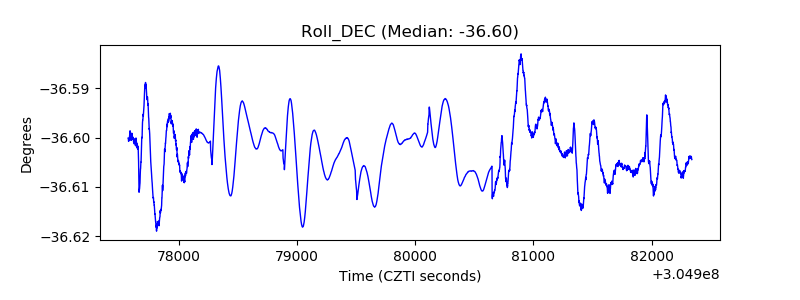 |
| _Roll_RA | 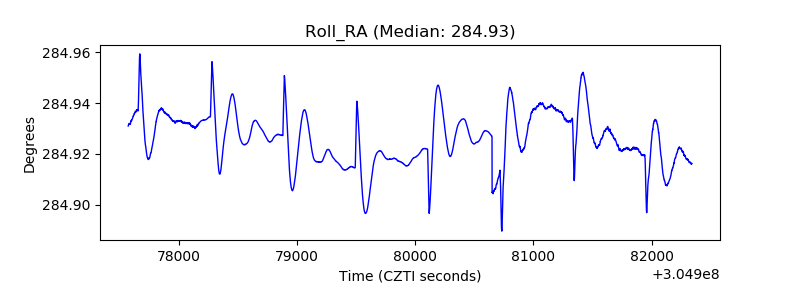 |
| Veto Counter | 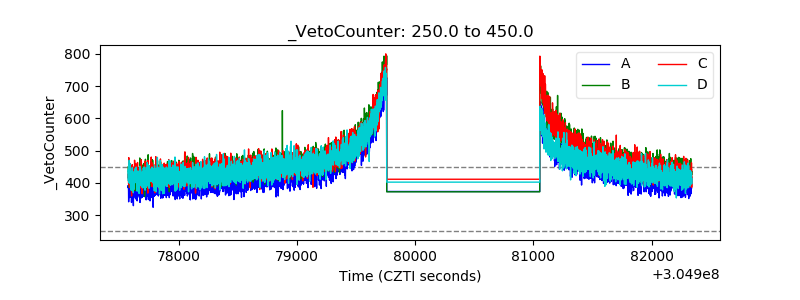 |