| Param | Original file | Final file |
|---|---|---|
| Filename | modeM0/AS1A06_005T05_9000003136_21223cztM0_level2.evt | modeM0/AS1A06_005T05_9000003136_21223cztM0_level2_quad_clean.evt |
| Size (bytes) | 562,708,800 | 101,399,040 |
| Size | 536.6 MB | 96.7 MB |
| Events in quadrant A | 3,502,944 | 653,897 |
| Events in quadrant B | 3,619,548 | 665,138 |
| Events in quadrant C | 3,466,008 | 639,832 |
| Events in quadrant D | 5,956,621 | 601,984 |
| Mode M9 | |||
|---|---|---|---|
| Quadrant | BADHDUFLAG | Total packets | Discarded packets |
| A | 0 | 16 | 0 |
| B | 0 | 16 | 0 |
| C | 0 | 16 | 0 |
| D | 0 | 16 | 0 |
| Mode M0 | |||
|---|---|---|---|
| Quadrant | BADHDUFLAG | Total packets | Discarded packets |
| A | 0 | 15160 | 2 |
| B | 0 | 15525 | 2 |
| C | 0 | 15130 | 2 |
| D | 0 | 22813 | 2 |
| Mode SS | |||
|---|---|---|---|
| Quadrant | BADHDUFLAG | Total packets | Discarded packets |
| A | 0 | 152 | 0 |
| B | 0 | 152 | 0 |
| C | 0 | 152 | 0 |
| D | 0 | 152 | 0 |
| Quadrant | Total seconds | Saturated seconds | Saturation percentage |
|---|---|---|---|
| A | 7319 | 26 | 0.355240% |
| B | 7320 | 52 | 0.710383% |
| C | 7320 | 75 | 1.024590% |
| D | 7320 | 511 | 6.980874% |
Noise dominated data is calculated using 1-second bins in cleaned event files. If a bin has >2000 counts, and if more than 50% of those come from <1% of pixels, then it is considered to be noise-dominated and hence unusable.
| Quadrant | # 1 sec bins | Bins with >0 counts | Bins with >2000 counts | High rate bins dominated by noise | Noise dominated (total time) | Noise dominated (detector-on time) | Marked lightcurve |
|---|---|---|---|---|---|---|---|
| A | 8910 | 7321 | 4 | 4 | 0.04% | 0.05% | 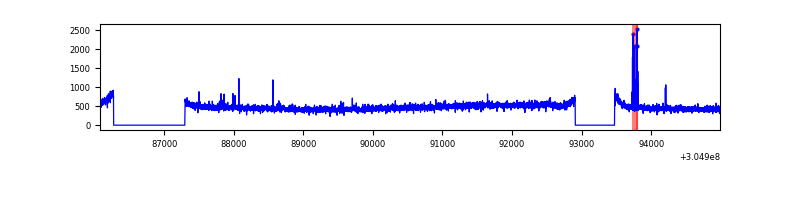 |
| B | 8911 | 7322 | 8 | 8 | 0.09% | 0.11% | 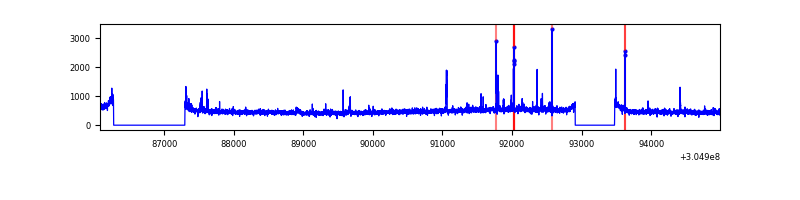 |
| C | 8911 | 7322 | 1 | 1 | 0.01% | 0.01% | 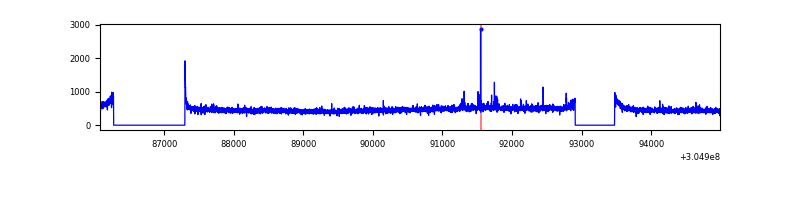 |
| D | 8911 | 7322 | 365 | 365 | 4.10% | 4.98% | 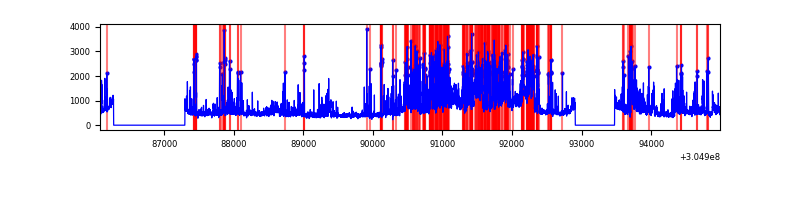 |
Top three noisy pixels from each quadrant. If the there are fewer than three noisy pixels in the level2.evt file, extra rows are filled as -1
| Pixel properties | Quadrant properties | ||||||
|---|---|---|---|---|---|---|---|
| Quadrant | DetID | PixID | Counts | Sigma | Mean | Median | Sigma |
| A | 15 | 236 | 73231 | 408.77 | 880 | 861 | 177.0 |
| A | 11 | 47 | 34524 | 190.14 | 880 | 861 | 177.0 |
| A | 13 | 254 | 11464 | 59.89 | 880 | 861 | 177.0 |
| B | 0 | 190 | 38804 | 223.06 | 887 | 865 | 170.1 |
| B | 3 | 64 | 30924 | 176.73 | 887 | 865 | 170.1 |
| B | 0 | 197 | 30501 | 174.24 | 887 | 865 | 170.1 |
| C | 14 | 238 | 131711 | 660.91 | 843 | 849 | 198.0 |
| C | 0 | 239 | 17442 | 83.8 | 843 | 849 | 198.0 |
| C | 0 | 10 | 12585 | 59.27 | 843 | 849 | 198.0 |
| D | 13 | 174 | 1935683 | 9560.0 | 833 | 808 | 202.4 |
| D | 7 | 238 | 315240 | 1553.57 | 833 | 808 | 202.4 |
| D | 13 | 153 | 161060 | 791.79 | 833 | 808 | 202.4 |
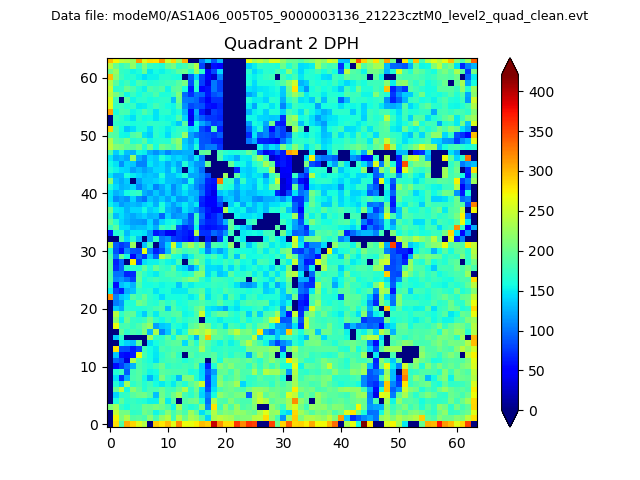
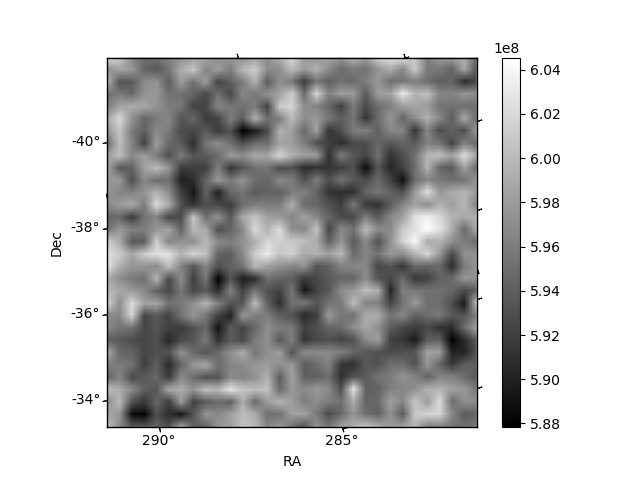
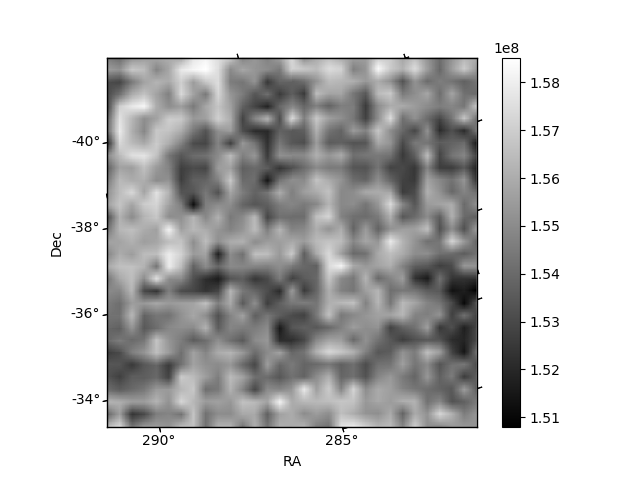
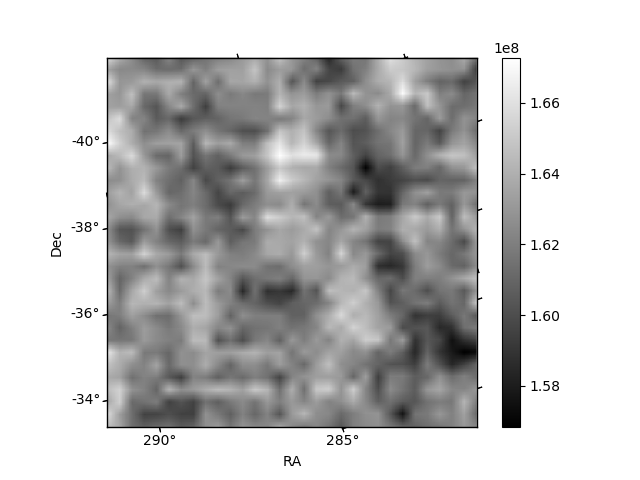
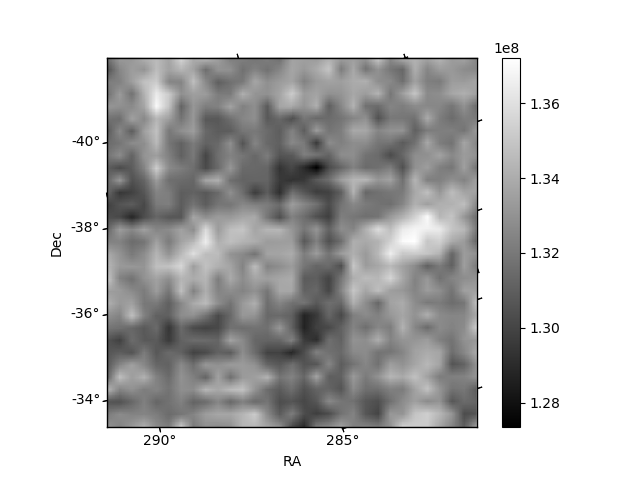
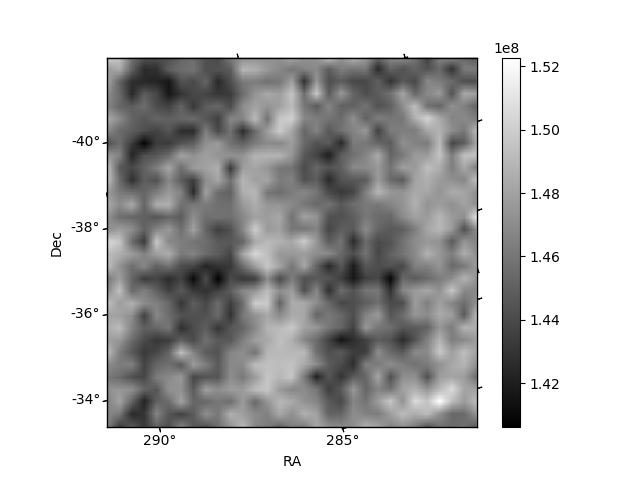
Histogram calculated using DETX and DETY for each event in the final _common_clean file
| Quadrant A | 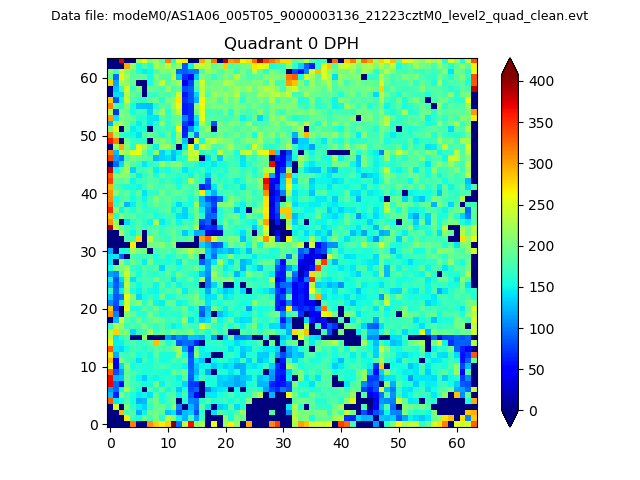 |
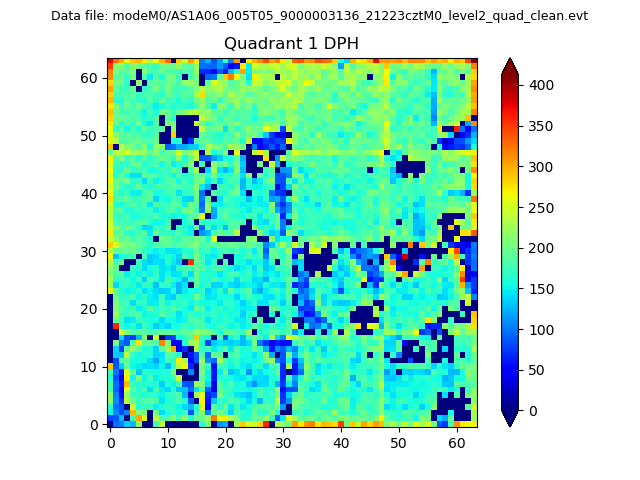 |
Quadrant B |
|---|---|---|---|
| Quadrant D | 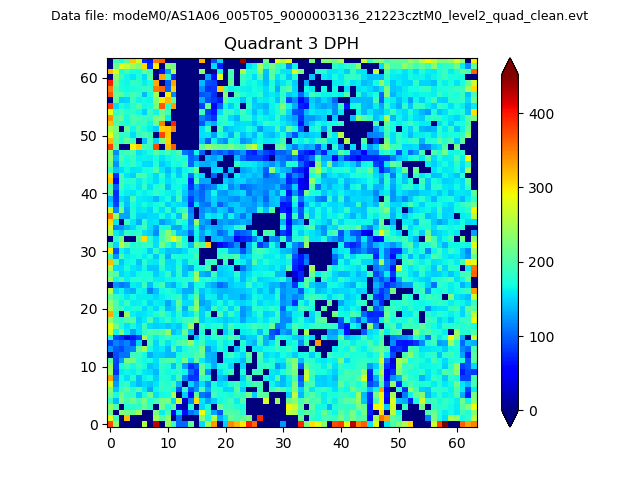 |
 |
Quadrant C |
| Plot type | Count rate plots | Images |
|---|---|---|
| Comparison with Poisson distribution Blue bars denote a histogram of data divided into 1 sec bins. Red curve is a Poisson curve with rate = median count rate of data. |
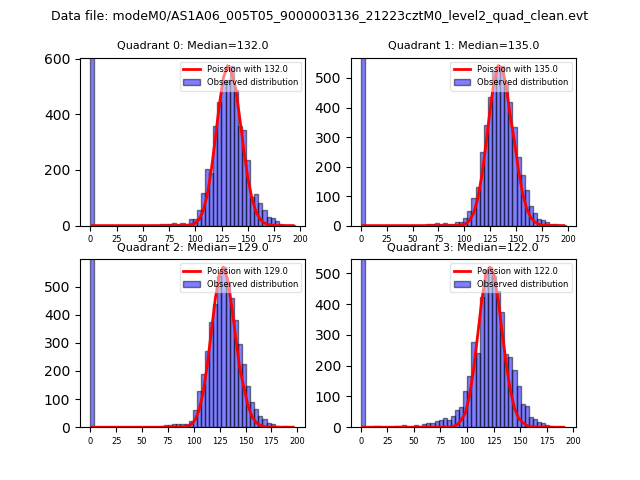 |
 |
| Quadrant-wise count rates Data is divided into 100 sec bins |
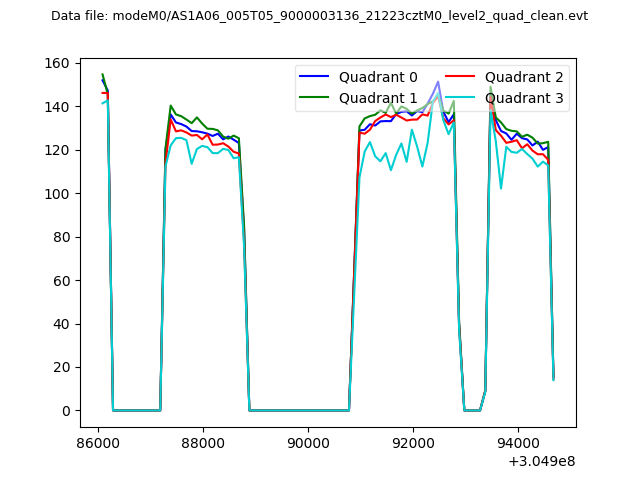 |
|
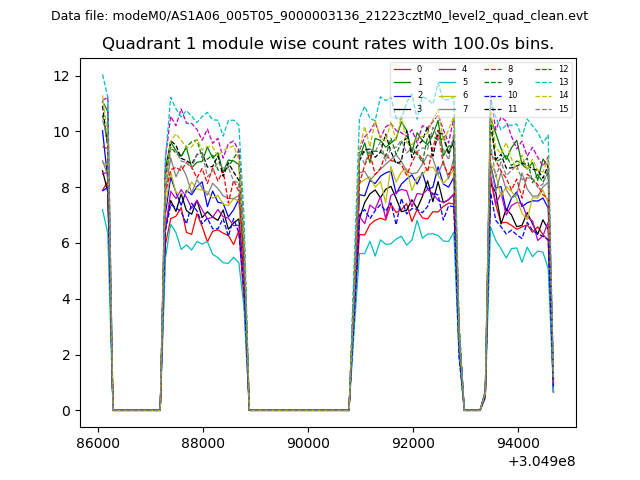
| Module-wise count rates for Quadrant A Data is divided into 100 sec bins |
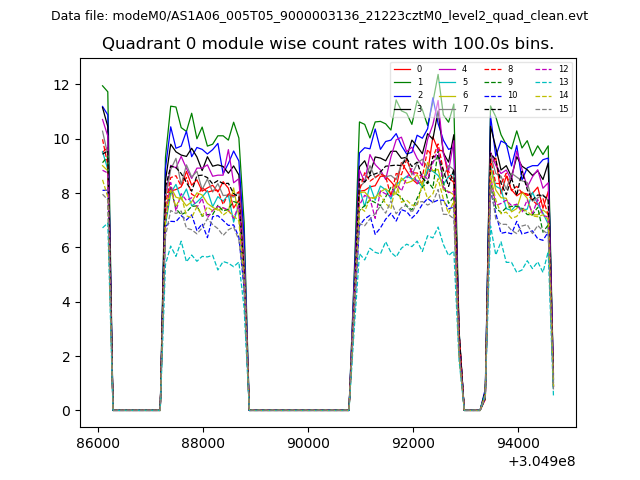 |
 |
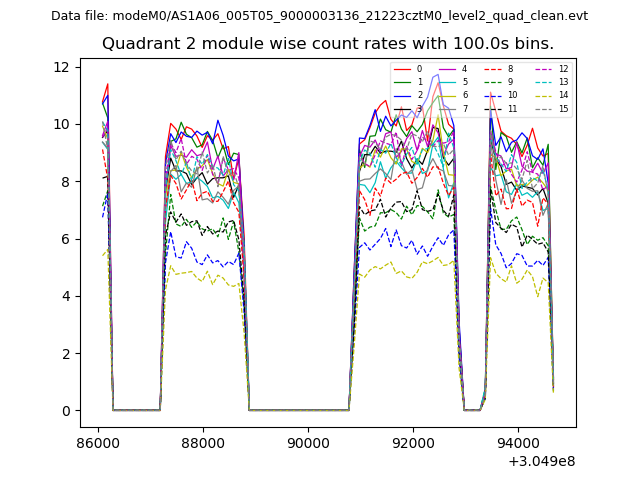
| Module-wise count rates for Quadrant B Data is divided into 100 sec bins |
 |
 |
| Module-wise count rates for Quadrant C Data is divided into 100 sec bins |
 |
 |
| Module-wise count rates for Quadrant D Data is divided into 100 sec bins |
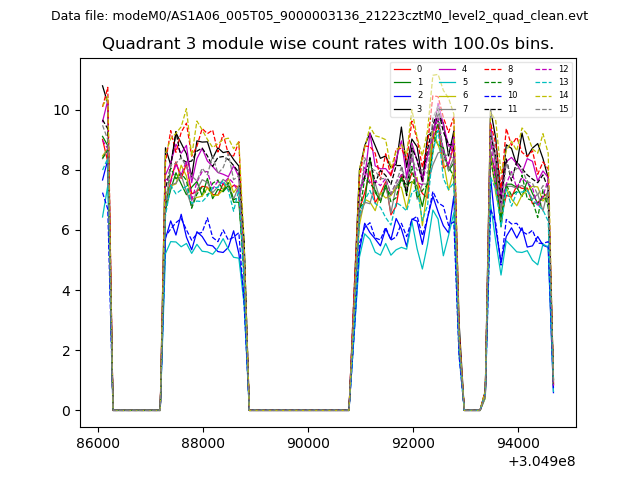 |
 |
| Parameter | Plot |
|---|---|
| CZT HV Monitor | 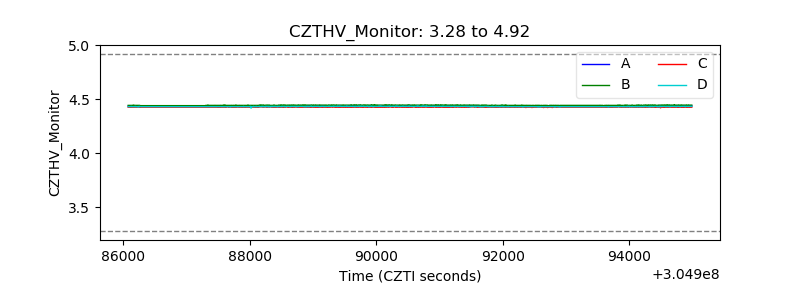 |
| D_VDD | 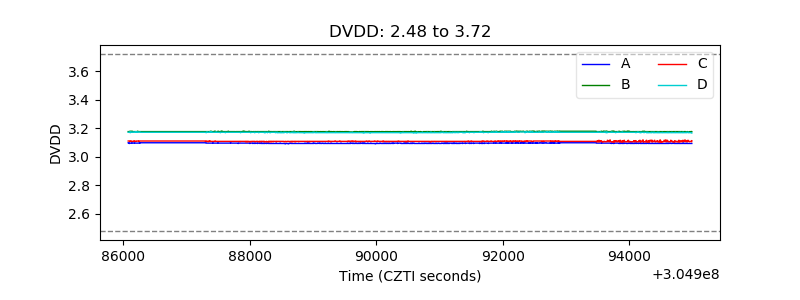 |
| Temperature 1 | 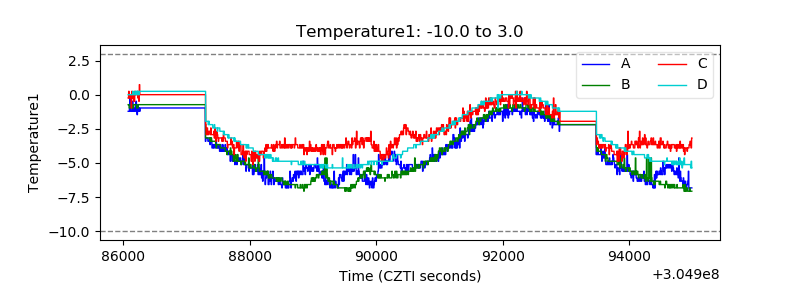 |
| Veto HV Monitor | 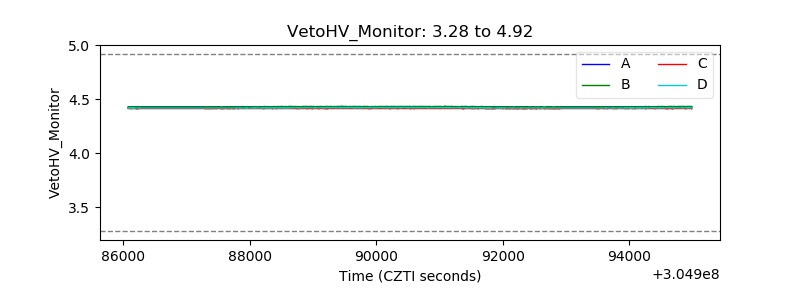 |
| Veto LLD | 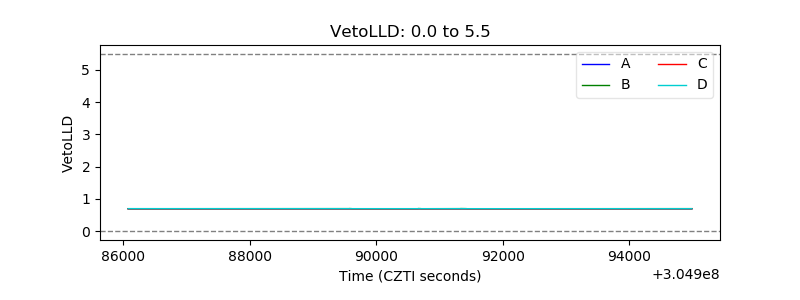 |
| Alpha Counter | 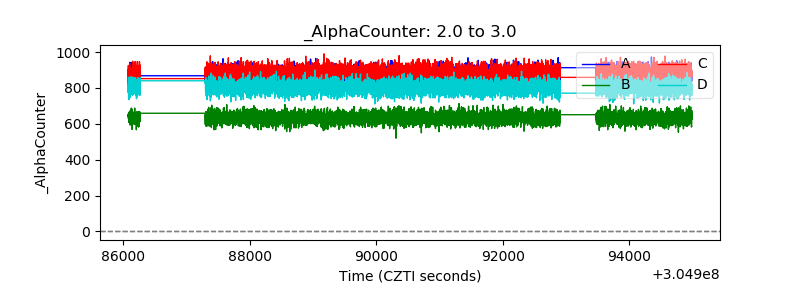 |
| _CPM_Rate | 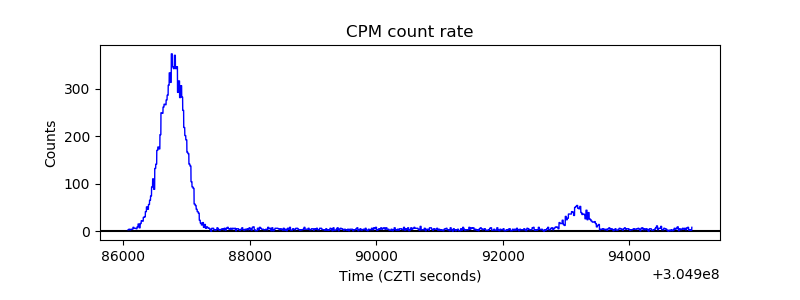 |
| CZT Counter | 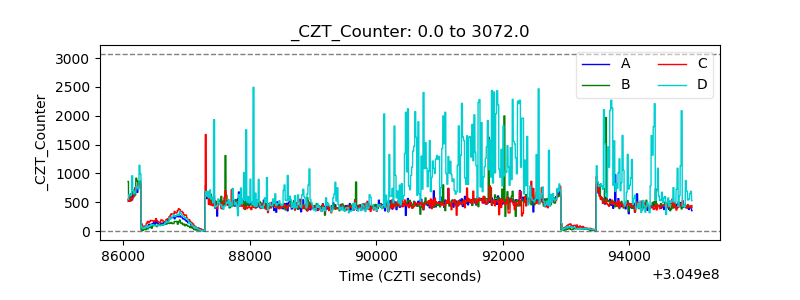 |
| +2.5 Volts monitor |  |
| +5 Volts monitor |  |
| _ROLL_ROT | 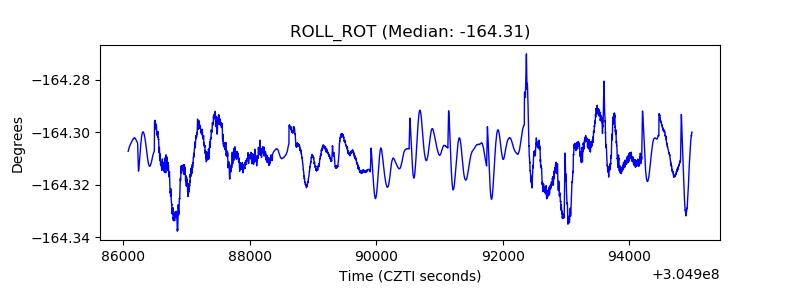 |
| _Roll_DEC | 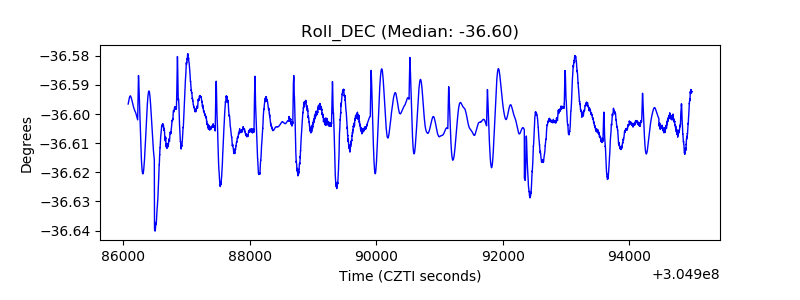 |
| _Roll_RA | 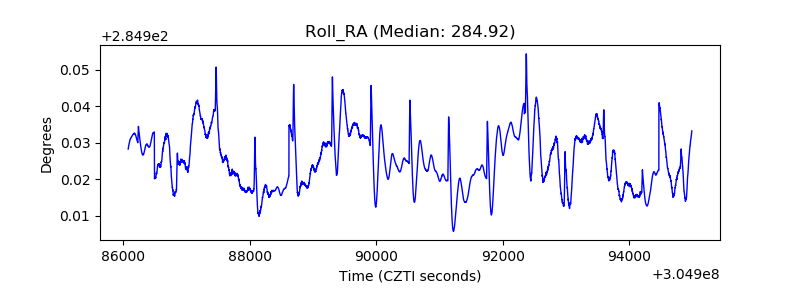 |
| Veto Counter | 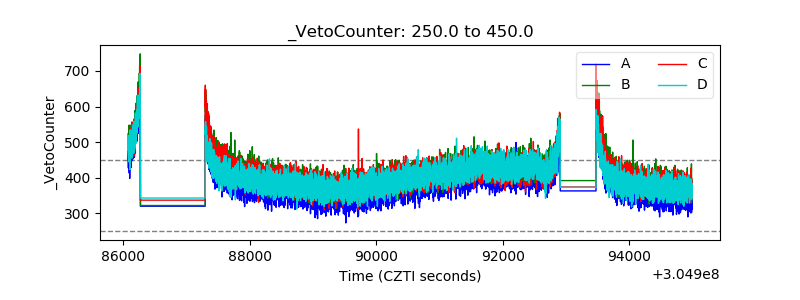 |