| Param | Original file | Final file |
|---|---|---|
| Filename | modeM0/AS1A06_005T05_9000003136_21224cztM0_level2.evt | modeM0/AS1A06_005T05_9000003136_21224cztM0_level2_quad_clean.evt |
| Size (bytes) | 1,912,466,880 | 272,381,760 |
| Size | 1.8 GB | 259.8 MB |
| Events in quadrant A | 16,276,539 | 1,597,507 |
| Events in quadrant B | 11,137,158 | 1,789,425 |
| Events in quadrant C | 10,615,688 | 1,720,255 |
| Events in quadrant D | 18,389,620 | 1,609,339 |
| Mode M9 | |||
|---|---|---|---|
| Quadrant | BADHDUFLAG | Total packets | Discarded packets |
| A | 0 | 31 | 0 |
| B | 0 | 31 | 0 |
| C | 0 | 31 | 0 |
| D | 0 | 31 | 0 |
| Mode M0 | |||
|---|---|---|---|
| Quadrant | BADHDUFLAG | Total packets | Discarded packets |
| A | 0 | 62957 | 4 |
| B | 0 | 47460 | 5 |
| C | 0 | 46128 | 4 |
| D | 0 | 69893 | 4 |
| Mode SS | |||
|---|---|---|---|
| Quadrant | BADHDUFLAG | Total packets | Discarded packets |
| A | 0 | 452 | 0 |
| B | 0 | 452 | 0 |
| C | 0 | 452 | 0 |
| D | 0 | 452 | 0 |
| Quadrant | Total seconds | Saturated seconds | Saturation percentage |
|---|---|---|---|
| A | 22256 | 2647 | 11.893422% |
| B | 22256 | 258 | 1.159238% |
| C | 22256 | 292 | 1.312006% |
| D | 22256 | 1497 | 6.726276% |
Noise dominated data is calculated using 1-second bins in cleaned event files. If a bin has >2000 counts, and if more than 50% of those come from <1% of pixels, then it is considered to be noise-dominated and hence unusable.
| Quadrant | # 1 sec bins | Bins with >0 counts | Bins with >2000 counts | High rate bins dominated by noise | Noise dominated (total time) | Noise dominated (detector-on time) | Marked lightcurve |
|---|---|---|---|---|---|---|---|
| A | 25342 | 22259 | 2339 | 2339 | 9.23% | 10.51% | 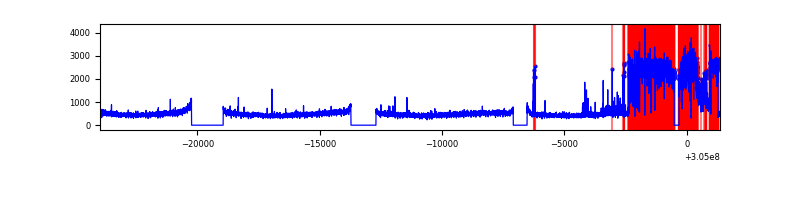 |
| B | 25342 | 22259 | 56 | 56 | 0.22% | 0.25% | 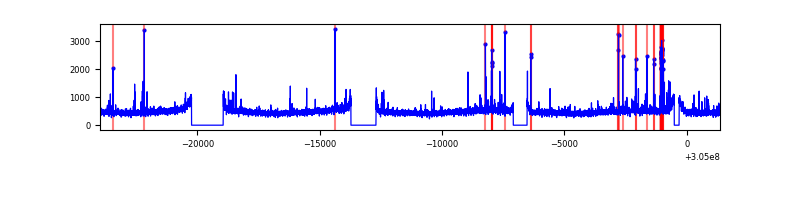 |
| C | 25342 | 22259 | 7 | 7 | 0.03% | 0.03% | 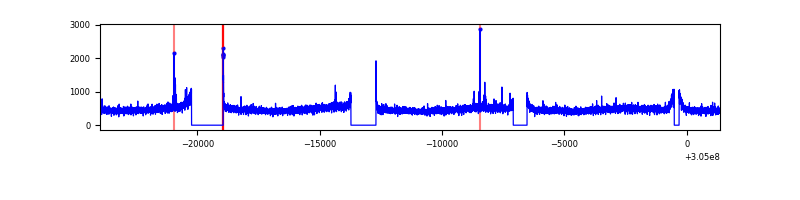 |
| D | 25342 | 22260 | 1245 | 1245 | 4.91% | 5.59% | 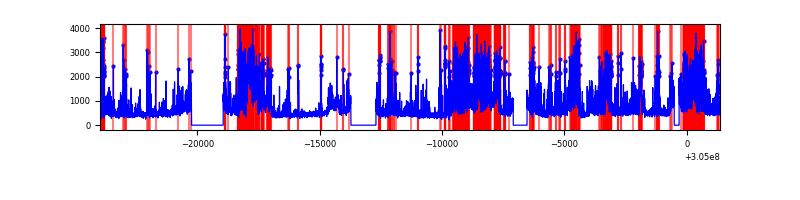 |
Top three noisy pixels from each quadrant. If the there are fewer than three noisy pixels in the level2.evt file, extra rows are filled as -1
| Pixel properties | Quadrant properties | ||||||
|---|---|---|---|---|---|---|---|
| Quadrant | DetID | PixID | Counts | Sigma | Mean | Median | Sigma |
| A | 15 | 236 | 6085219 | 12006.12 | 2549 | 2499 | 506.6 |
| A | 11 | 47 | 167496 | 325.67 | 2549 | 2499 | 506.6 |
| A | 5 | 16 | 103067 | 198.5 | 2549 | 2499 | 506.6 |
| B | 0 | 189 | 130549 | 249.25 | 2714 | 2646 | 513.1 |
| B | 3 | 64 | 105785 | 200.99 | 2714 | 2646 | 513.1 |
| B | 0 | 190 | 92015 | 174.16 | 2714 | 2646 | 513.1 |
| C | 14 | 238 | 404568 | 667.96 | 2586 | 2602 | 601.8 |
| C | 3 | 233 | 45846 | 71.86 | 2586 | 2602 | 601.8 |
| C | 0 | 10 | 36650 | 56.58 | 2586 | 2602 | 601.8 |
| D | 13 | 174 | 6341800 | 10212.39 | 2561 | 2490 | 620.7 |
| D | 7 | 238 | 959054 | 1540.99 | 2561 | 2490 | 620.7 |
| D | 1 | 20 | 351265 | 561.86 | 2561 | 2490 | 620.7 |
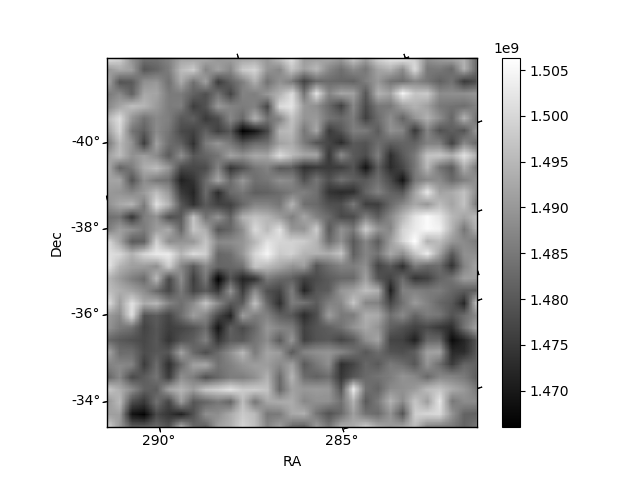
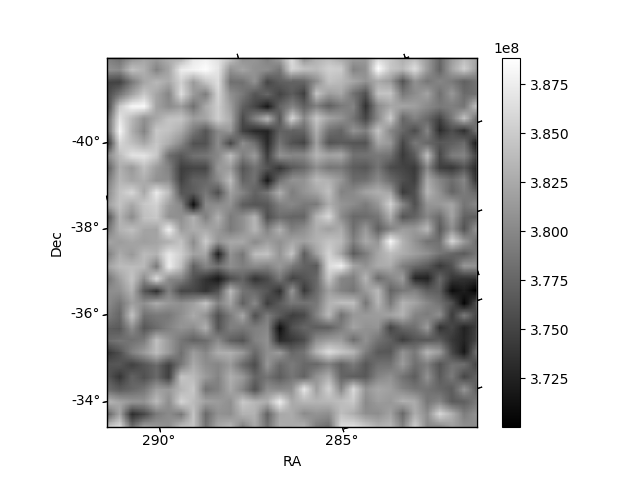
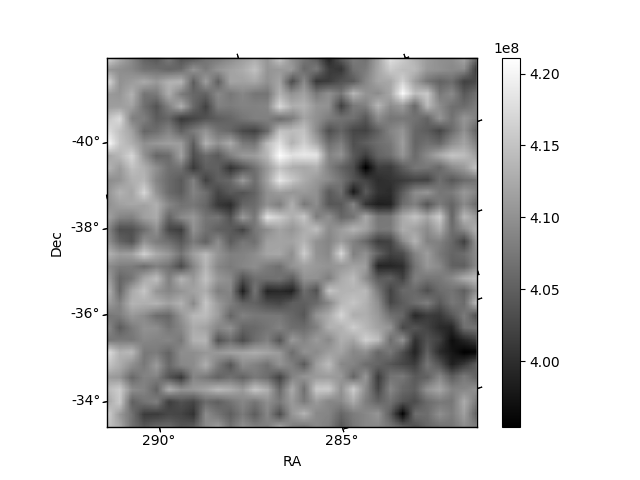
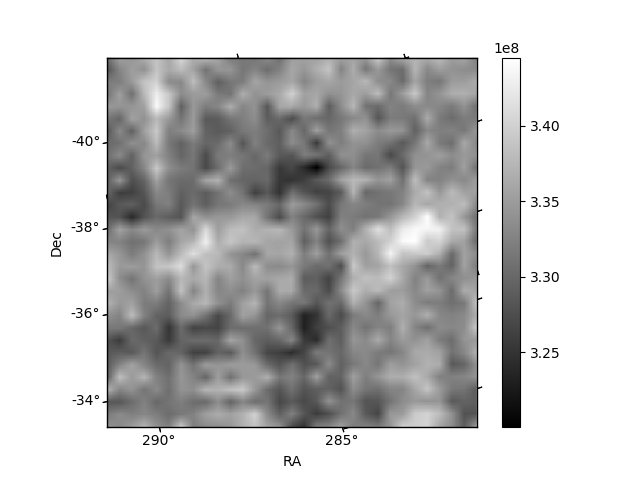
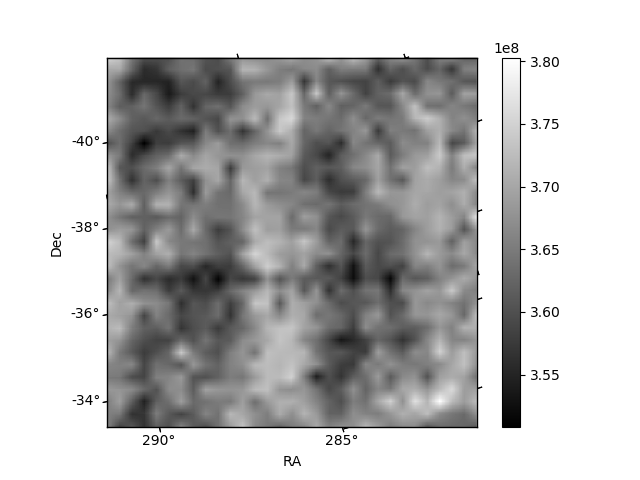
Histogram calculated using DETX and DETY for each event in the final _common_clean file
| Quadrant A | 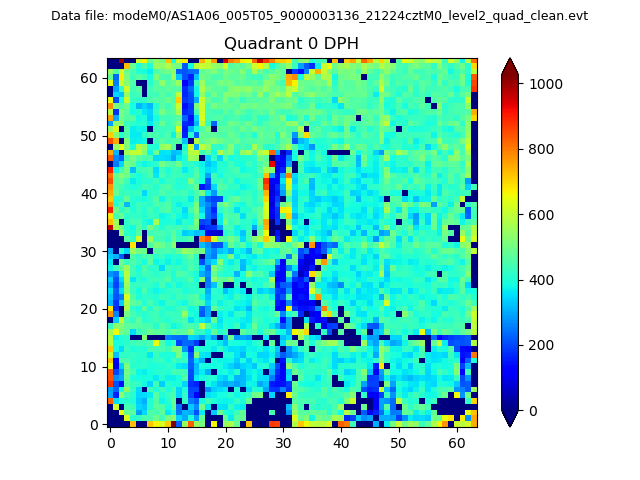 |
 |
Quadrant B |
|---|---|---|---|
| Quadrant D | 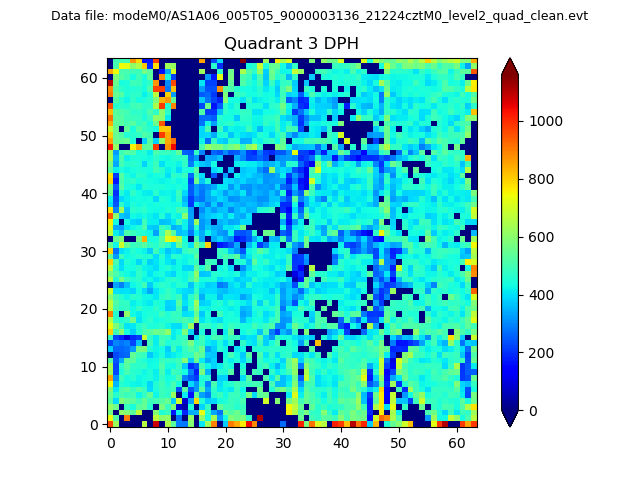 |
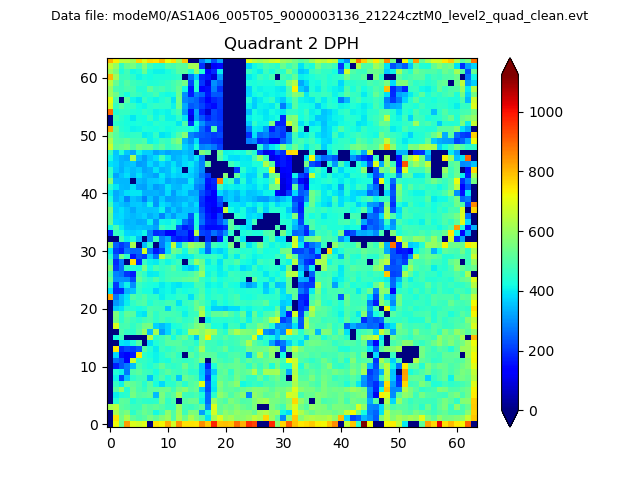 |
Quadrant C |
| Plot type | Count rate plots | Images |
|---|---|---|
| Comparison with Poisson distribution Blue bars denote a histogram of data divided into 1 sec bins. Red curve is a Poisson curve with rate = median count rate of data. |
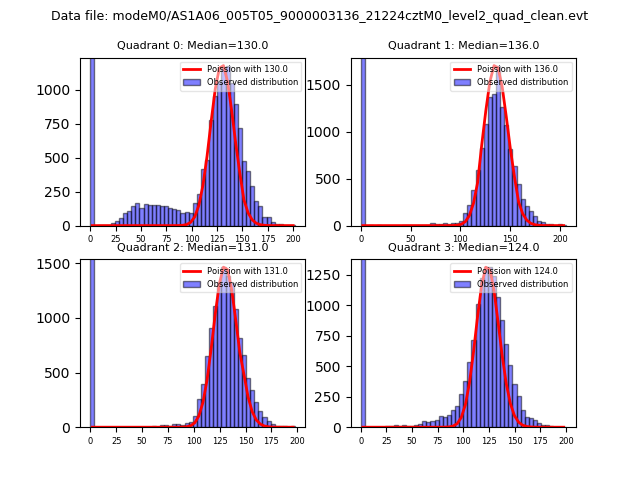 |
 |
| Quadrant-wise count rates Data is divided into 100 sec bins |
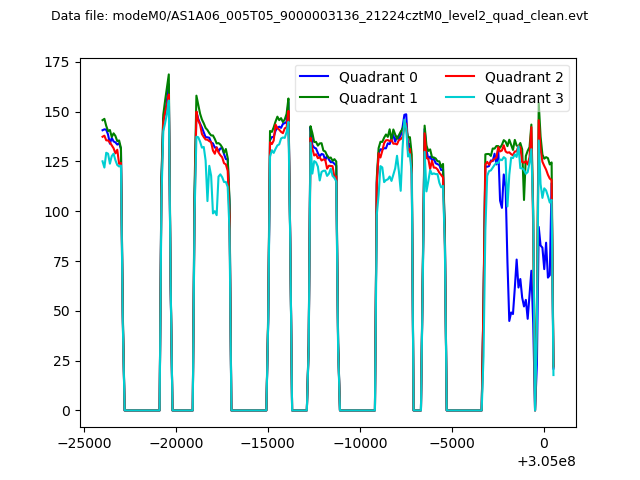 |
|
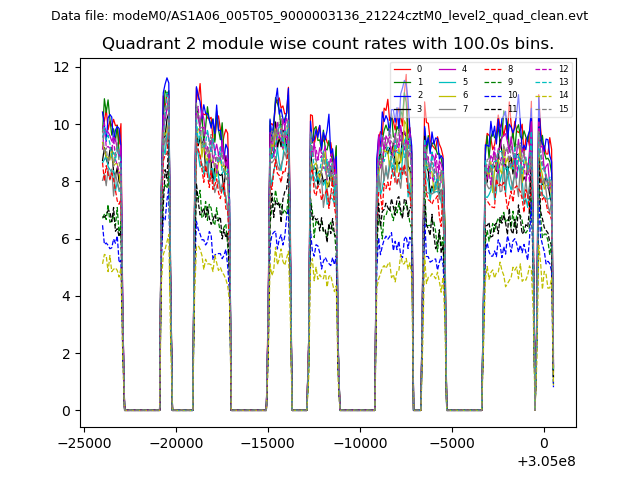
| Module-wise count rates for Quadrant A Data is divided into 100 sec bins |
 |
 |
| Module-wise count rates for Quadrant B Data is divided into 100 sec bins |
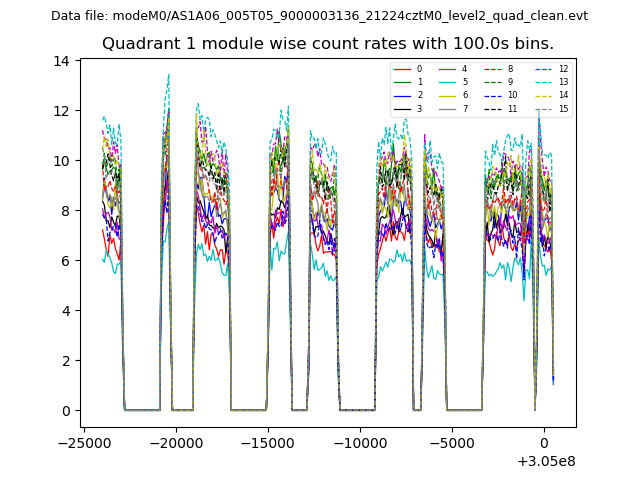 |
 |
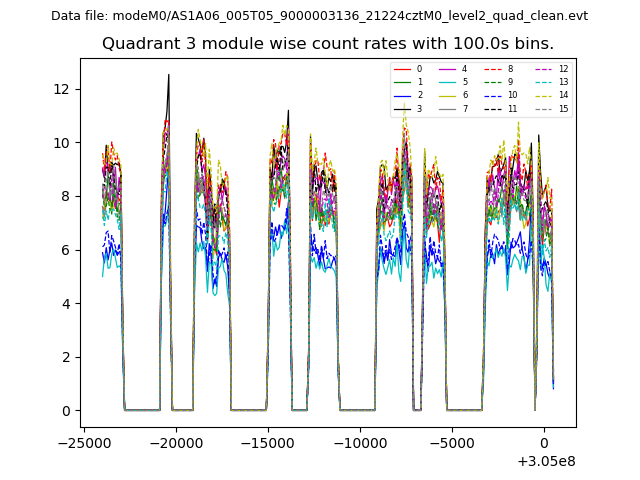
| Module-wise count rates for Quadrant C Data is divided into 100 sec bins |
 |
 |
| Module-wise count rates for Quadrant D Data is divided into 100 sec bins |
 |
 |
| Parameter | Plot |
|---|---|
| CZT HV Monitor | 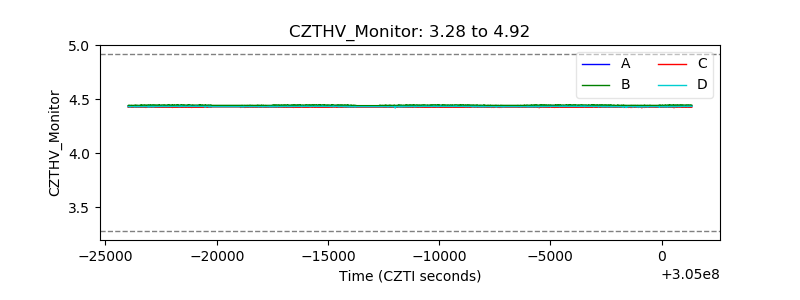 |
| D_VDD | 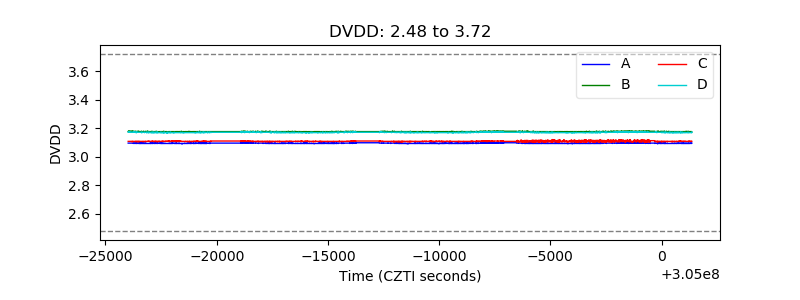 |
| Temperature 1 | 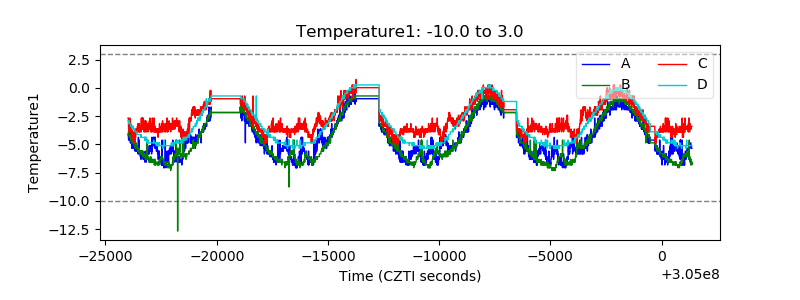 |
| Veto HV Monitor |  |
| Veto LLD | 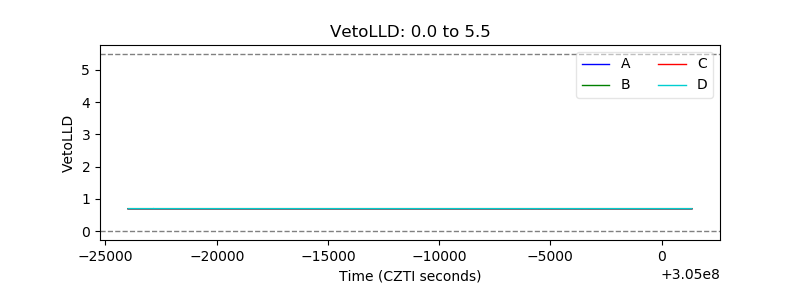 |
| Alpha Counter | 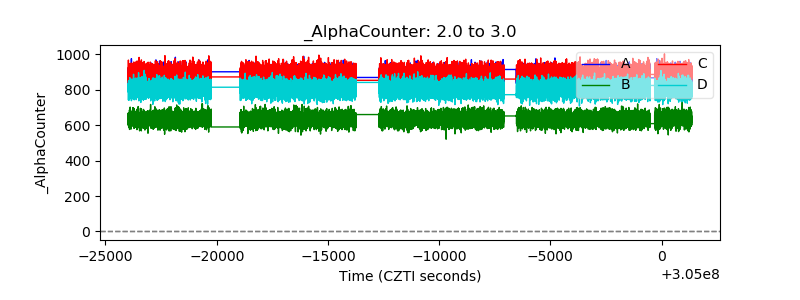 |
| _CPM_Rate | 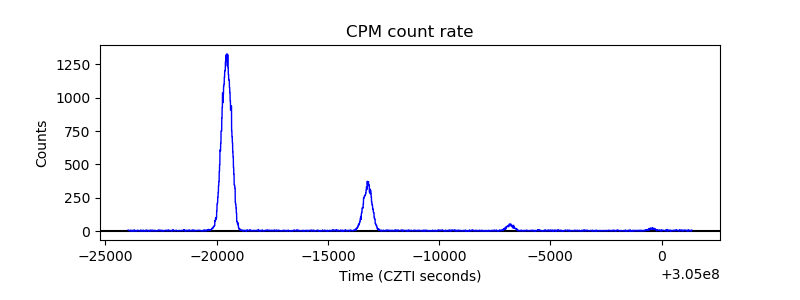 |
| CZT Counter | 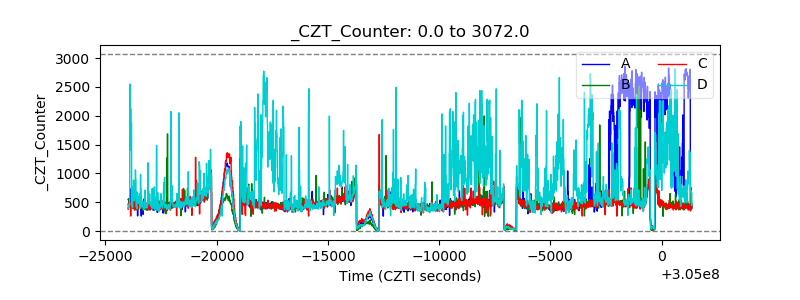 |
| +2.5 Volts monitor |  |
| +5 Volts monitor |  |
| _ROLL_ROT | 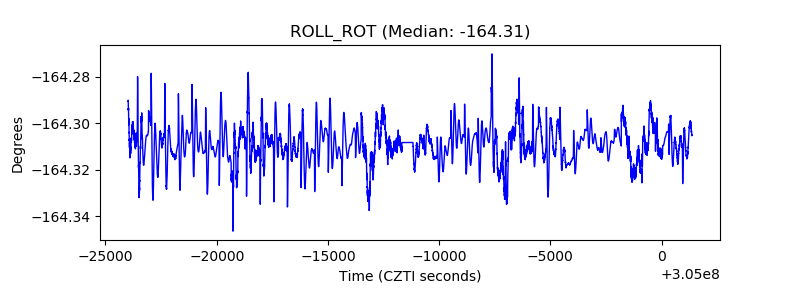 |
| _Roll_DEC | 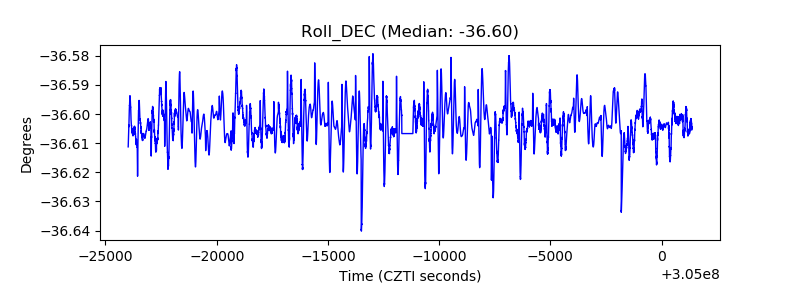 |
| _Roll_RA | 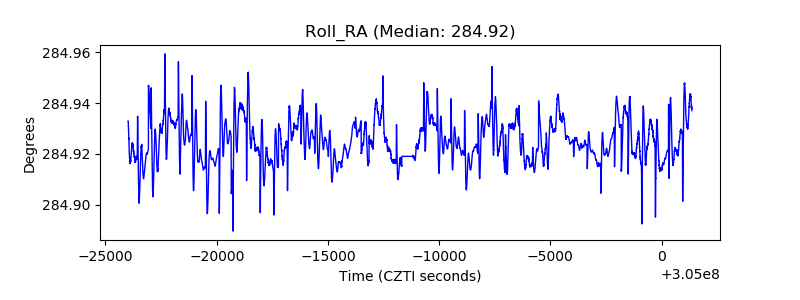 |
| Veto Counter | 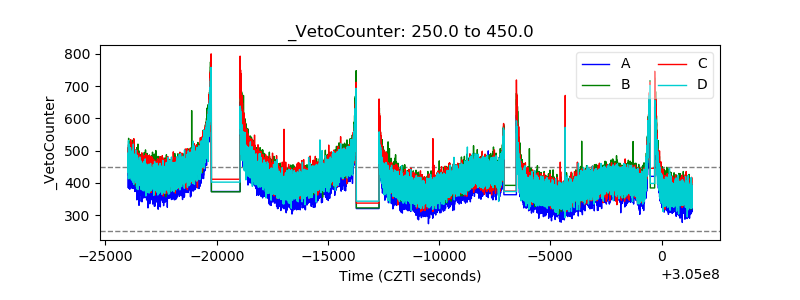 |