| Param | Original file | Final file |
|---|---|---|
| Filename | modeM0/AS1A06_005T05_9000003136_21225cztM0_level2.evt | modeM0/AS1A06_005T05_9000003136_21225cztM0_level2_quad_clean.evt |
| Size (bytes) | 891,817,920 | 73,226,880 |
| Size | 850.5 MB | 69.8 MB |
| Events in quadrant A | 14,175,580 | 145,483 |
| Events in quadrant B | 3,587,020 | 537,299 |
| Events in quadrant C | 3,390,157 | 520,746 |
| Events in quadrant D | 5,357,695 | 498,438 |
| Mode M9 | |||
|---|---|---|---|
| Quadrant | BADHDUFLAG | Total packets | Discarded packets |
| A | 0 | 3 | 0 |
| B | 0 | 3 | 0 |
| C | 0 | 3 | 0 |
| D | 0 | 3 | 0 |
| Mode M0 | |||
|---|---|---|---|
| Quadrant | BADHDUFLAG | Total packets | Discarded packets |
| A | 0 | 47355 | 1 |
| B | 0 | 15416 | 1 |
| C | 0 | 15010 | 1 |
| D | 0 | 20994 | 2 |
| Mode SS | |||
|---|---|---|---|
| Quadrant | BADHDUFLAG | Total packets | Discarded packets |
| A | 0 | 150 | 0 |
| B | 0 | 150 | 0 |
| C | 0 | 150 | 0 |
| D | 0 | 150 | 0 |
| Quadrant | Total seconds | Saturated seconds | Saturation percentage |
|---|---|---|---|
| A | 7374 | 4489 | 60.876051% |
| B | 7374 | 75 | 1.017087% |
| C | 7375 | 73 | 0.989831% |
| D | 7374 | 227 | 3.078384% |
Noise dominated data is calculated using 1-second bins in cleaned event files. If a bin has >2000 counts, and if more than 50% of those come from <1% of pixels, then it is considered to be noise-dominated and hence unusable.
| Quadrant | # 1 sec bins | Bins with >0 counts | Bins with >2000 counts | High rate bins dominated by noise | Noise dominated (total time) | Noise dominated (detector-on time) | Marked lightcurve |
|---|---|---|---|---|---|---|---|
| A | 7654 | 7374 | 4419 | 4419 | 57.73% | 59.93% | 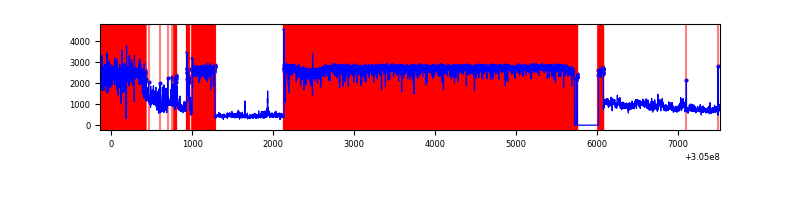 |
| B | 7654 | 7376 | 13 | 13 | 0.17% | 0.18% | 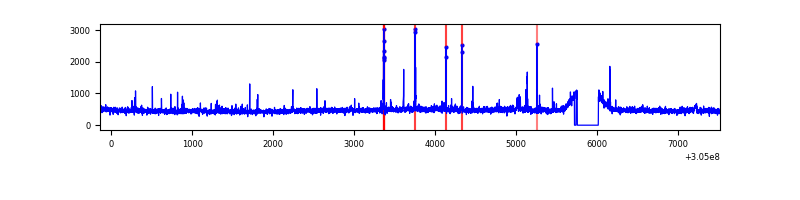 |
| C | 7655 | 7377 | 0 | 0 | 0.00% | 0.00% | 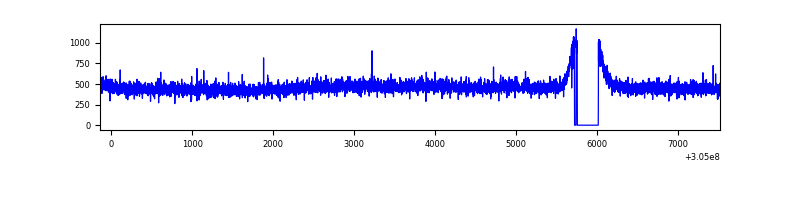 |
| D | 7654 | 7376 | 232 | 232 | 3.03% | 3.15% | 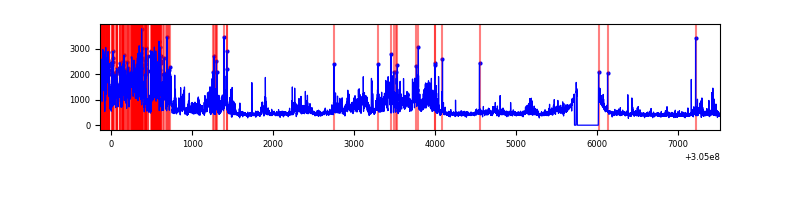 |
Top three noisy pixels from each quadrant. If the there are fewer than three noisy pixels in the level2.evt file, extra rows are filled as -1
| Pixel properties | Quadrant properties | ||||||
|---|---|---|---|---|---|---|---|
| Quadrant | DetID | PixID | Counts | Sigma | Mean | Median | Sigma |
| A | 15 | 236 | 12208879 | 125342.19 | 484 | 474 | 97.4 |
| A | 13 | 252 | 53565 | 545.08 | 484 | 474 | 97.4 |
| A | 11 | 47 | 37729 | 382.49 | 484 | 474 | 97.4 |
| B | 0 | 197 | 48059 | 283.91 | 871 | 849 | 166.3 |
| B | 3 | 64 | 44097 | 260.08 | 871 | 849 | 166.3 |
| B | 0 | 190 | 24719 | 143.55 | 871 | 849 | 166.3 |
| C | 14 | 238 | 128835 | 650.61 | 835 | 840 | 196.7 |
| C | 13 | 61 | 5765 | 25.03 | 835 | 840 | 196.7 |
| C | 7 | 247 | 3302 | 12.51 | 835 | 840 | 196.7 |
| D | 13 | 174 | 1713776 | 8420.35 | 834 | 809 | 203.4 |
| D | 1 | 20 | 135940 | 664.26 | 834 | 809 | 203.4 |
| D | 7 | 238 | 125243 | 611.67 | 834 | 809 | 203.4 |
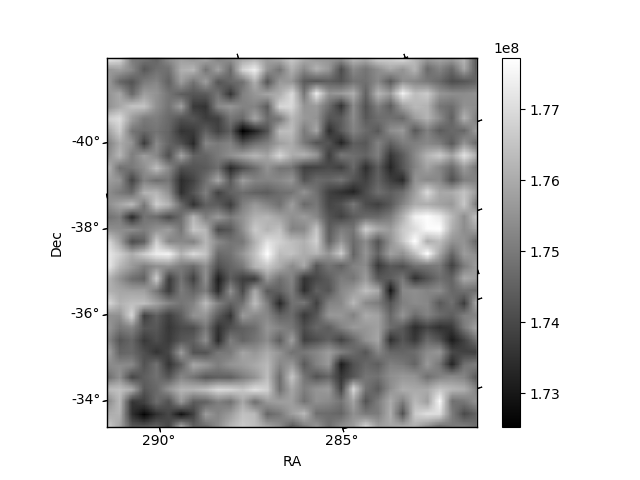
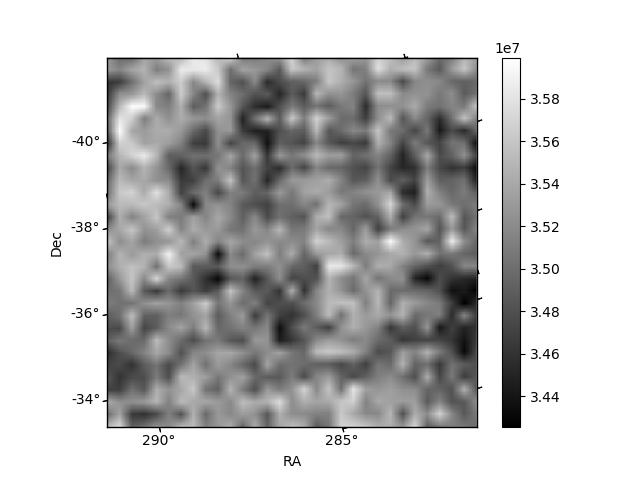
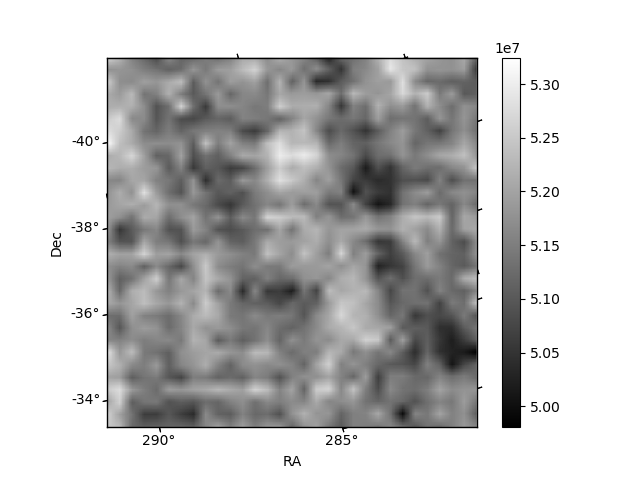
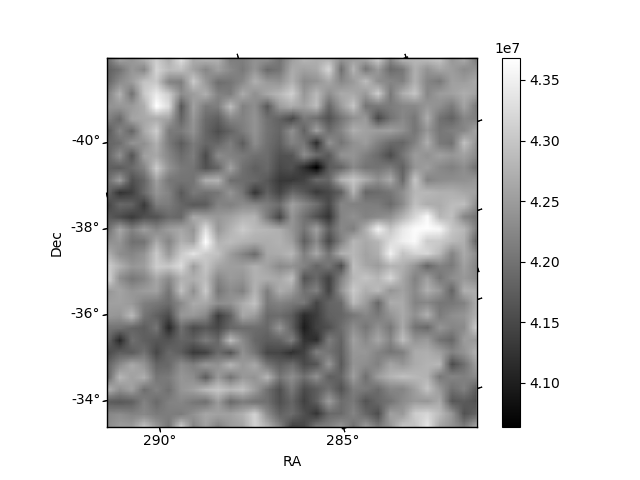
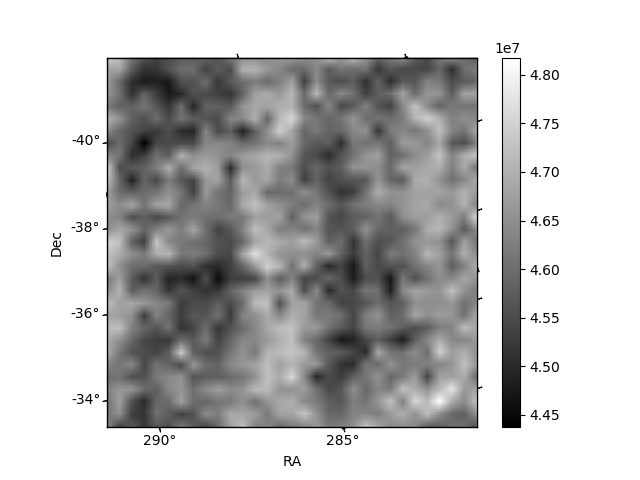
Histogram calculated using DETX and DETY for each event in the final _common_clean file
| Quadrant A | 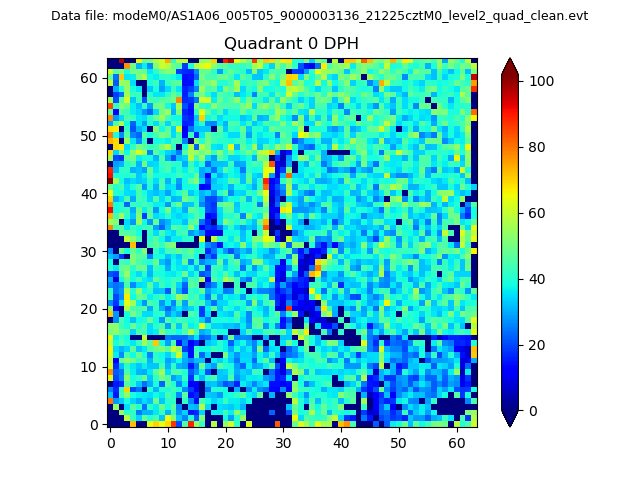 |
 |
Quadrant B |
|---|---|---|---|
| Quadrant D | 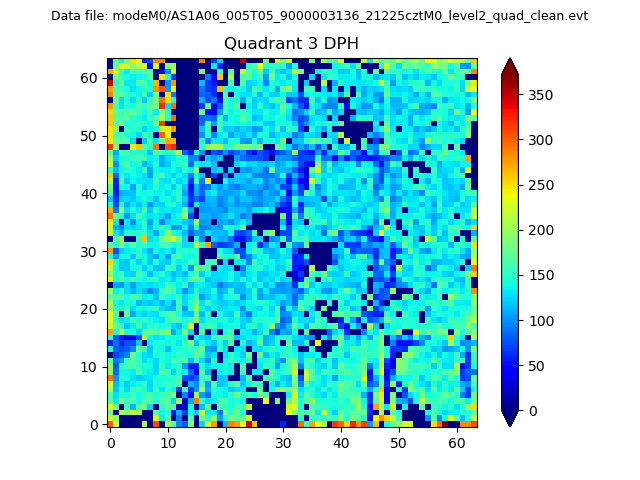 |
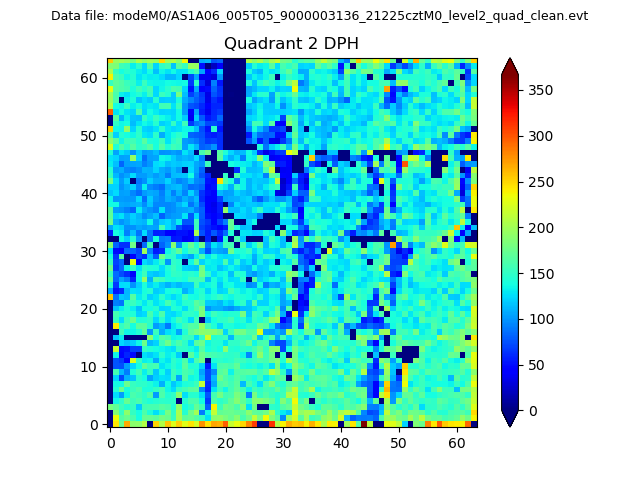 |
Quadrant C |
| Plot type | Count rate plots | Images |
|---|---|---|
| Comparison with Poisson distribution Blue bars denote a histogram of data divided into 1 sec bins. Red curve is a Poisson curve with rate = median count rate of data. |
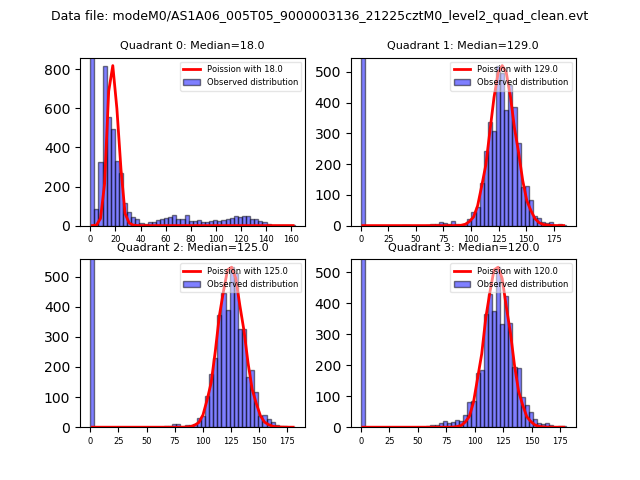 |
 |
| Quadrant-wise count rates Data is divided into 100 sec bins |
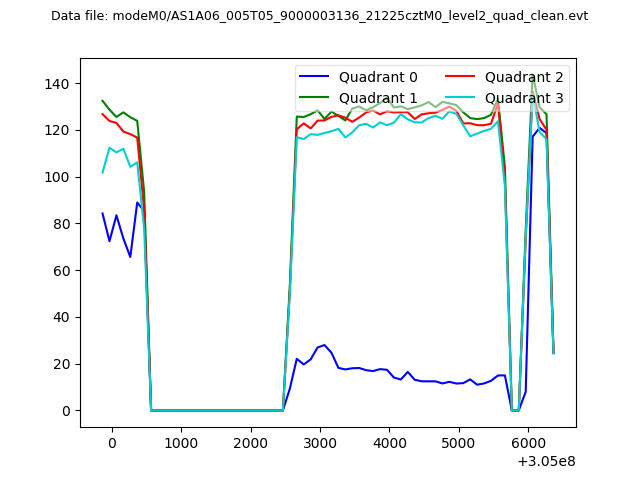 |
|
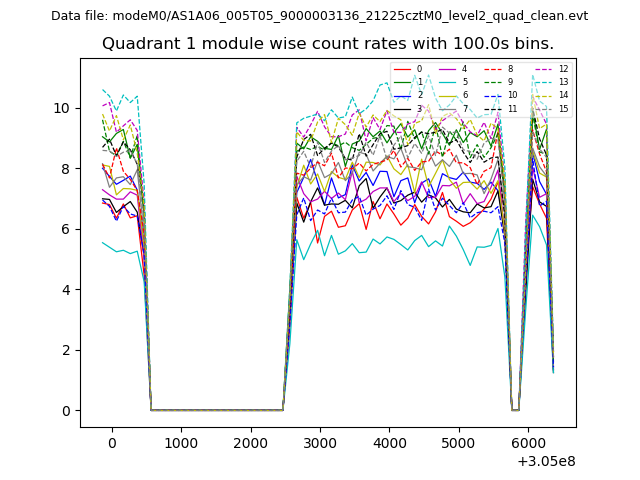
| Module-wise count rates for Quadrant A Data is divided into 100 sec bins |
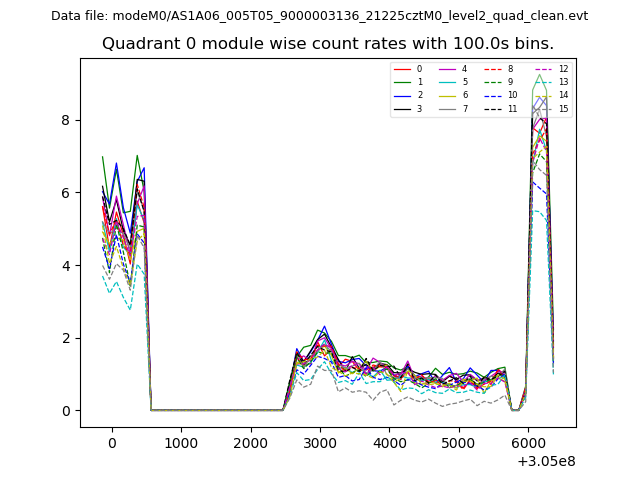 |
 |
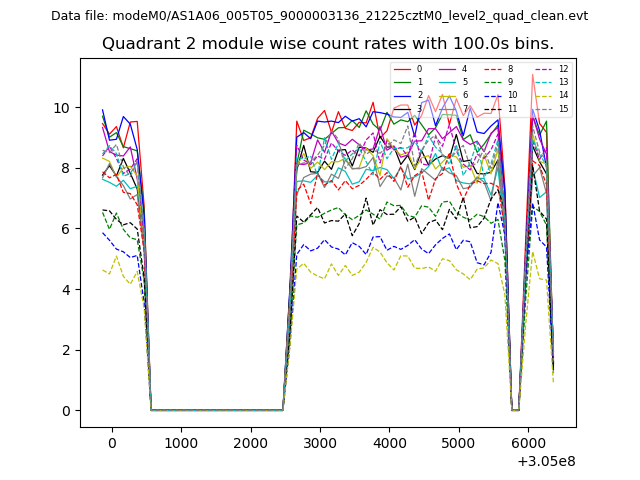
| Module-wise count rates for Quadrant B Data is divided into 100 sec bins |
 |
 |
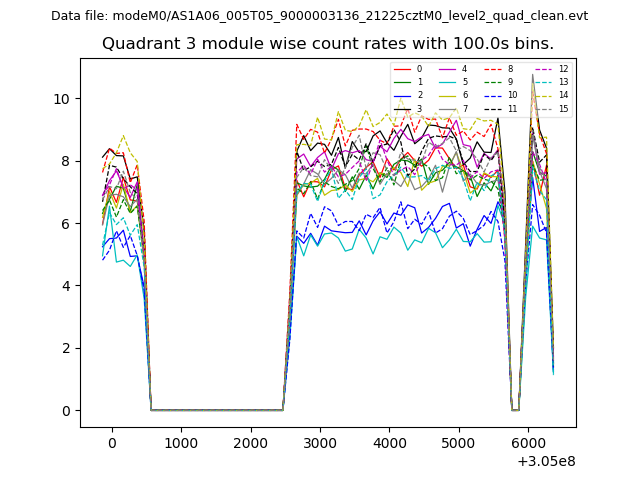
| Module-wise count rates for Quadrant C Data is divided into 100 sec bins |
 |
 |
| Module-wise count rates for Quadrant D Data is divided into 100 sec bins |
 |
 |
| Parameter | Plot |
|---|---|
| CZT HV Monitor | 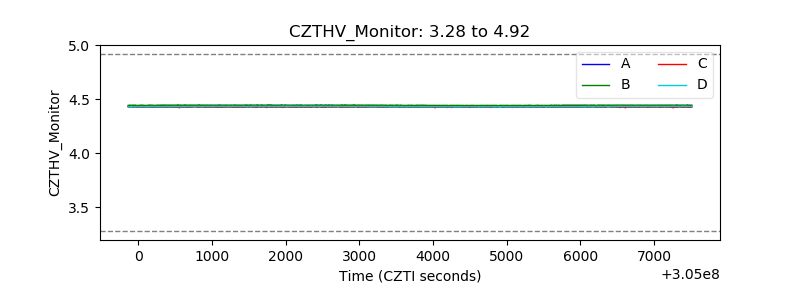 |
| D_VDD | 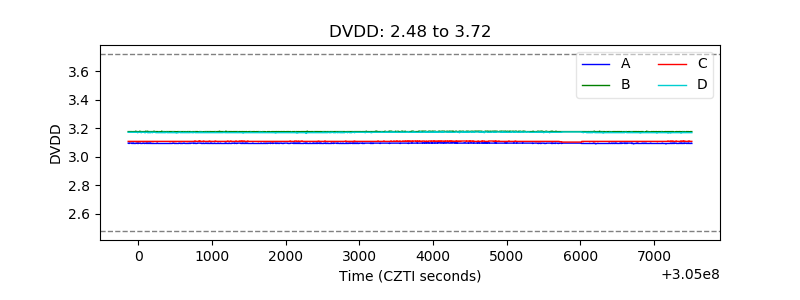 |
| Temperature 1 | 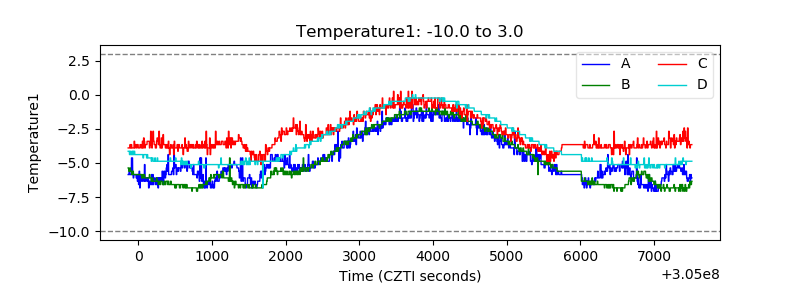 |
| Veto HV Monitor | 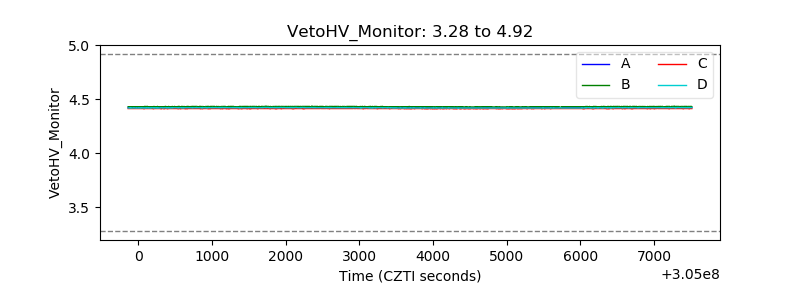 |
| Veto LLD | 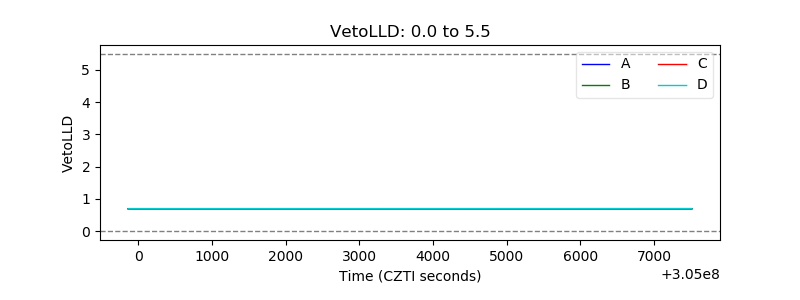 |
| Alpha Counter | 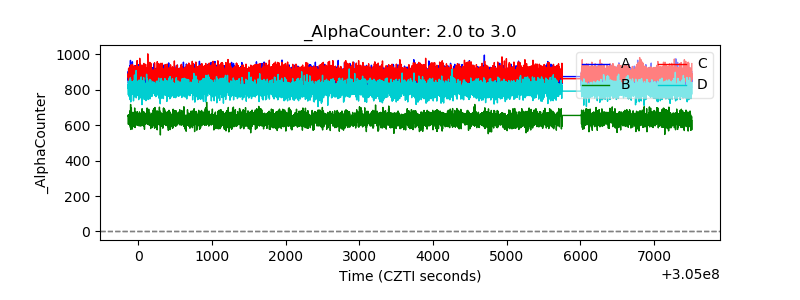 |
| _CPM_Rate | 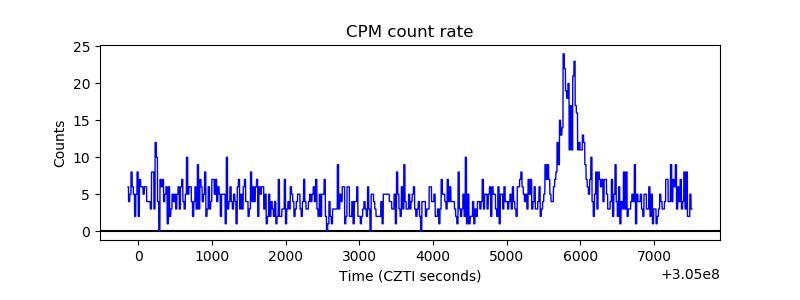 |
| CZT Counter | 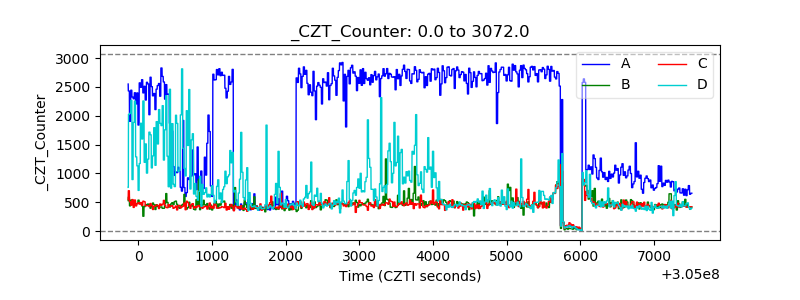 |
| +2.5 Volts monitor |  |
| +5 Volts monitor |  |
| _ROLL_ROT | 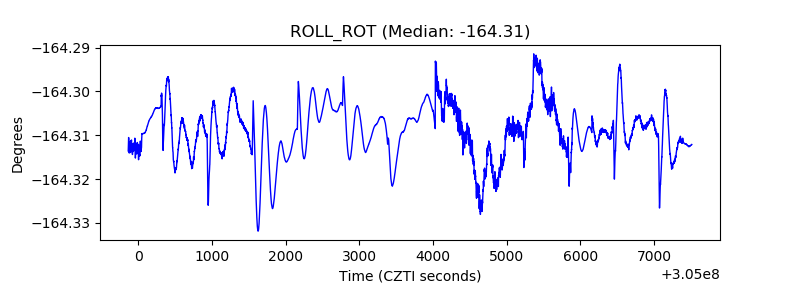 |
| _Roll_DEC | 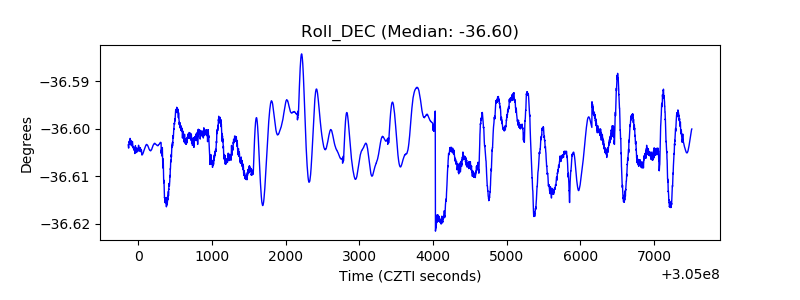 |
| _Roll_RA | 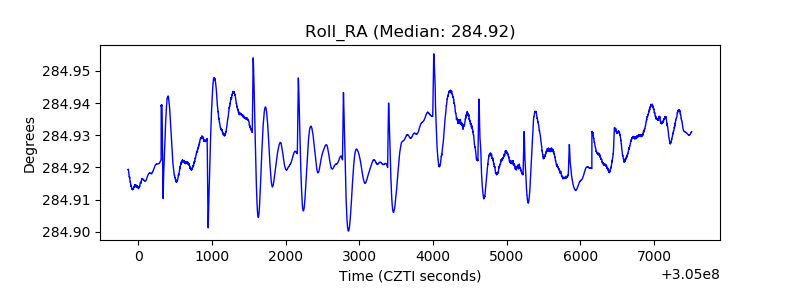 |
| Veto Counter | 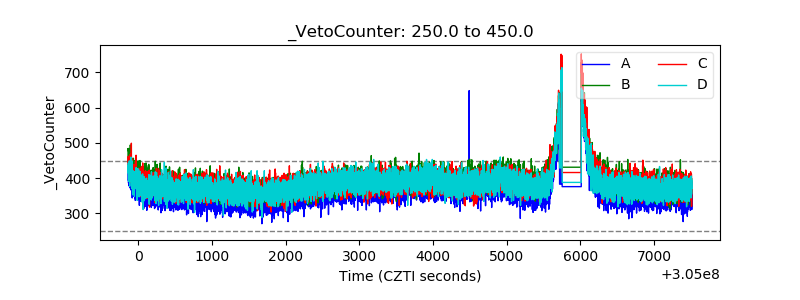 |