| Param | Original file | Final file |
|---|---|---|
| Filename | modeM0/AS1A06_005T05_9000003136_21228cztM0_level2.evt | modeM0/AS1A06_005T05_9000003136_21228cztM0_level2_quad_clean.evt |
| Size (bytes) | 1,128,268,800 | 127,434,240 |
| Size | 1.1 GB | 121.5 MB |
| Events in quadrant A | 16,948,325 | 689,607 |
| Events in quadrant B | 5,185,546 | 834,355 |
| Events in quadrant C | 4,871,670 | 814,935 |
| Events in quadrant D | 6,445,107 | 780,878 |
| Mode M9 | |||
|---|---|---|---|
| Quadrant | BADHDUFLAG | Total packets | Discarded packets |
| A | 0 | 4 | 0 |
| B | 0 | 4 | 0 |
| C | 0 | 4 | 0 |
| D | 0 | 4 | 0 |
| Mode M0 | |||
|---|---|---|---|
| Quadrant | BADHDUFLAG | Total packets | Discarded packets |
| A | 0 | 57743 | 1 |
| B | 0 | 22177 | 1 |
| C | 0 | 21615 | 1 |
| D | 0 | 26636 | 1 |
| Mode SS | |||
|---|---|---|---|
| Quadrant | BADHDUFLAG | Total packets | Discarded packets |
| A | 0 | 216 | 0 |
| B | 0 | 216 | 0 |
| C | 0 | 216 | 0 |
| D | 0 | 216 | 0 |
| Quadrant | Total seconds | Saturated seconds | Saturation percentage |
|---|---|---|---|
| A | 10662 | 3617 | 33.924217% |
| B | 10663 | 118 | 1.106630% |
| C | 10663 | 119 | 1.116009% |
| D | 10663 | 199 | 1.866267% |
Noise dominated data is calculated using 1-second bins in cleaned event files. If a bin has >2000 counts, and if more than 50% of those come from <1% of pixels, then it is considered to be noise-dominated and hence unusable.
| Quadrant | # 1 sec bins | Bins with >0 counts | Bins with >2000 counts | High rate bins dominated by noise | Noise dominated (total time) | Noise dominated (detector-on time) | Marked lightcurve |
|---|---|---|---|---|---|---|---|
| A | 11062 | 10662 | 3111 | 3111 | 28.12% | 29.18% |  |
| B | 11063 | 10663 | 21 | 21 | 0.19% | 0.20% | 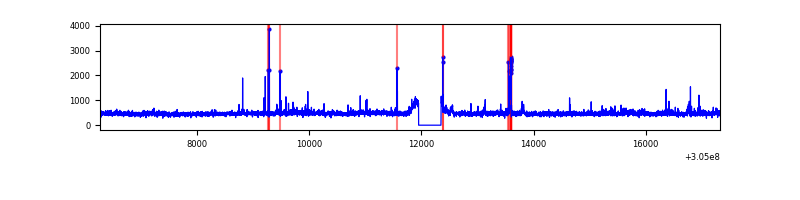 |
| C | 11063 | 10663 | 0 | 0 | 0.00% | 0.00% | 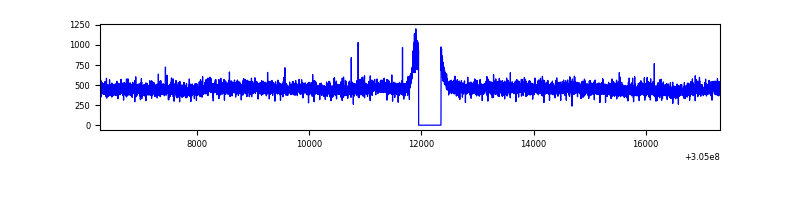 |
| D | 11063 | 10663 | 114 | 114 | 1.03% | 1.07% | 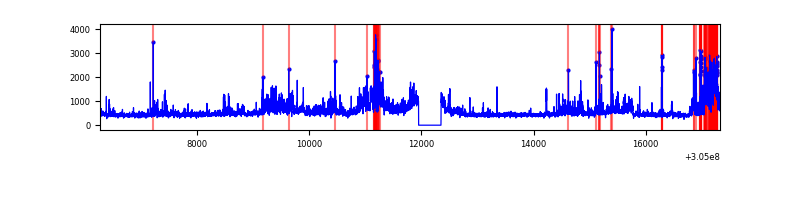 |
Top three noisy pixels from each quadrant. If the there are fewer than three noisy pixels in the level2.evt file, extra rows are filled as -1
| Pixel properties | Quadrant properties | ||||||
|---|---|---|---|---|---|---|---|
| Quadrant | DetID | PixID | Counts | Sigma | Mean | Median | Sigma |
| A | 15 | 236 | 12693109 | 60019.02 | 1055 | 1032 | 211.5 |
| A | 11 | 47 | 136716 | 641.63 | 1055 | 1032 | 211.5 |
| A | 5 | 16 | 45088 | 208.33 | 1055 | 1032 | 211.5 |
| B | 0 | 197 | 90168 | 374.36 | 1253 | 1221 | 237.6 |
| B | 0 | 230 | 57575 | 237.18 | 1253 | 1221 | 237.6 |
| B | 0 | 190 | 39359 | 160.51 | 1253 | 1221 | 237.6 |
| C | 14 | 238 | 185603 | 653.34 | 1201 | 1206 | 282.2 |
| C | 13 | 61 | 8590 | 26.16 | 1201 | 1206 | 282.2 |
| C | 7 | 220 | 6941 | 20.32 | 1201 | 1206 | 282.2 |
| D | 13 | 174 | 991555 | 3360.5 | 1208 | 1174 | 294.7 |
| D | 13 | 153 | 275461 | 930.7 | 1208 | 1174 | 294.7 |
| D | 1 | 20 | 267561 | 903.89 | 1208 | 1174 | 294.7 |
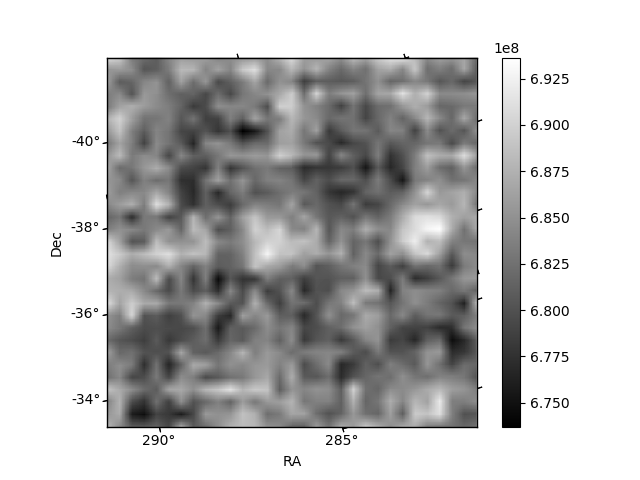
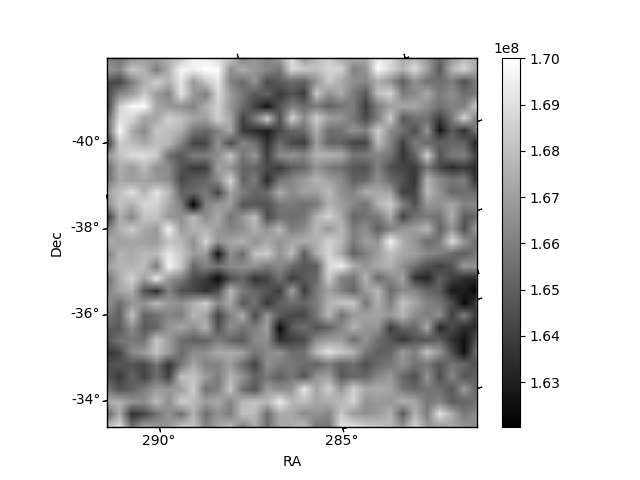
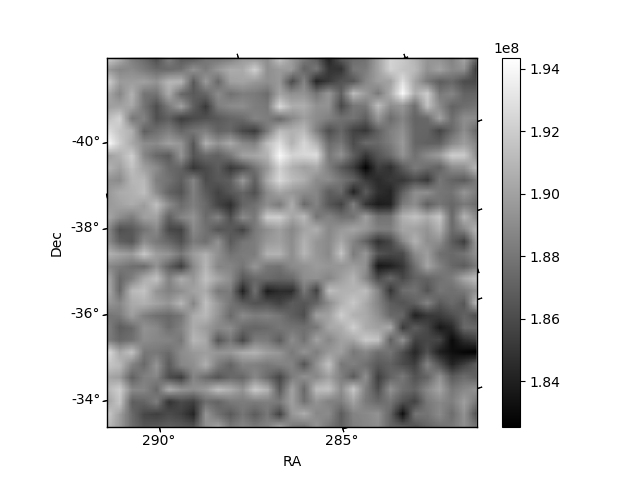
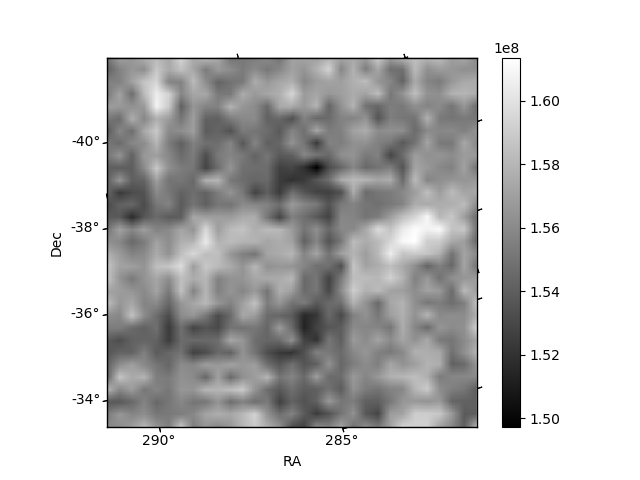
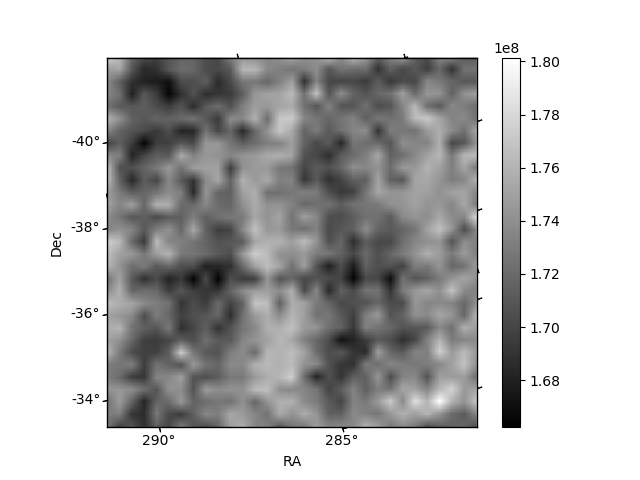
Histogram calculated using DETX and DETY for each event in the final _common_clean file
| Quadrant A | 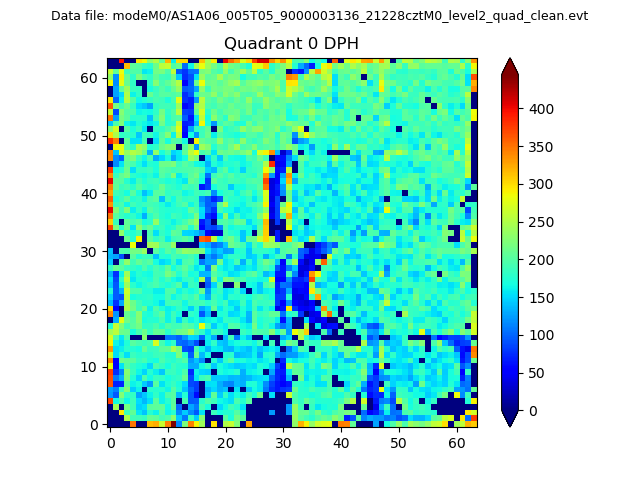 |
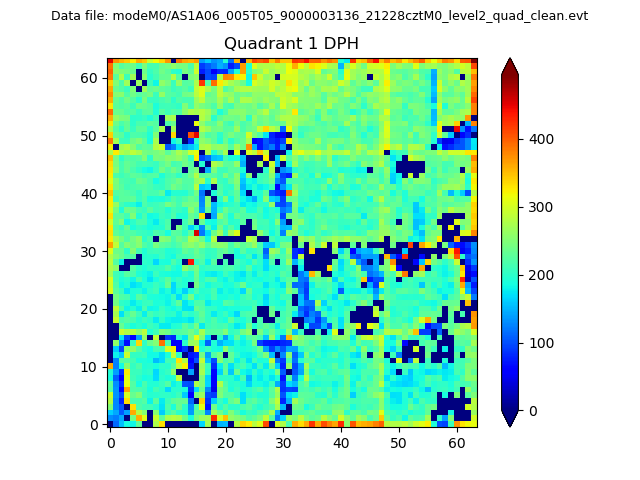 |
Quadrant B |
|---|---|---|---|
| Quadrant D | 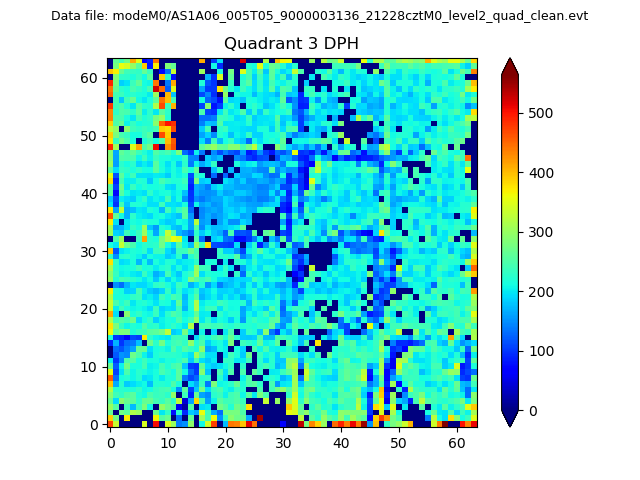 |
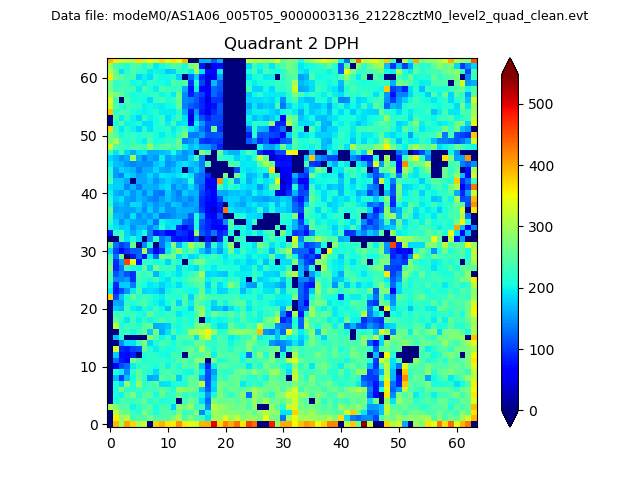 |
Quadrant C |
| Plot type | Count rate plots | Images |
|---|---|---|
| Comparison with Poisson distribution Blue bars denote a histogram of data divided into 1 sec bins. Red curve is a Poisson curve with rate = median count rate of data. |
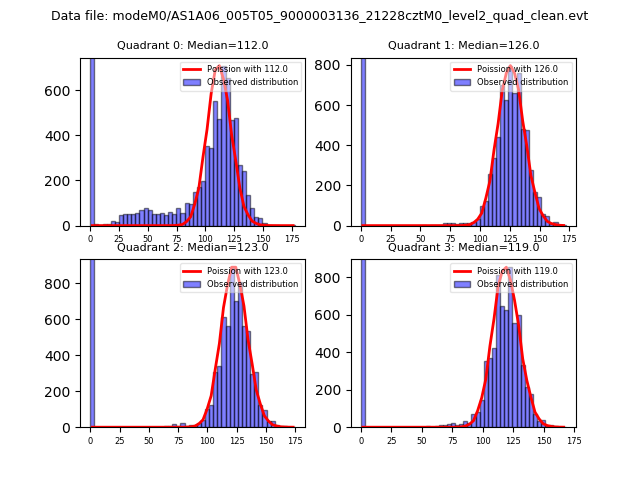 |
 |
| Quadrant-wise count rates Data is divided into 100 sec bins |
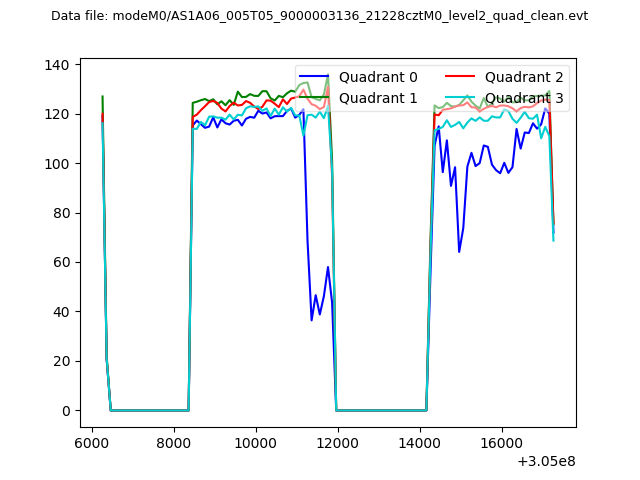 |
|
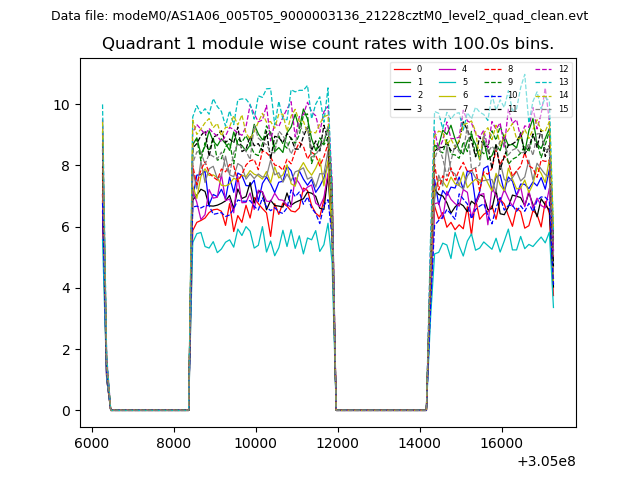
| Module-wise count rates for Quadrant A Data is divided into 100 sec bins |
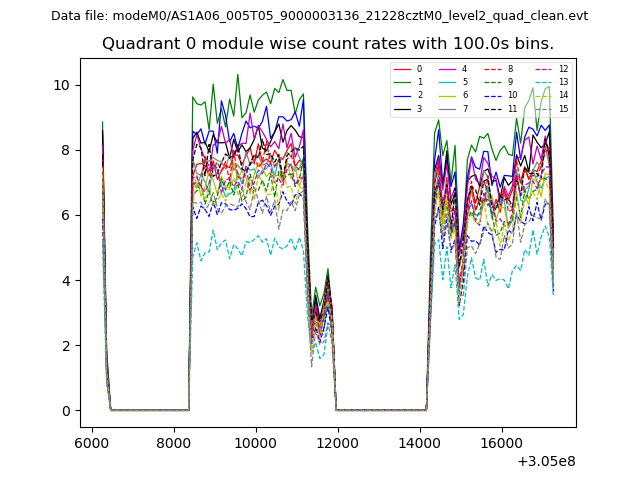 |
 |
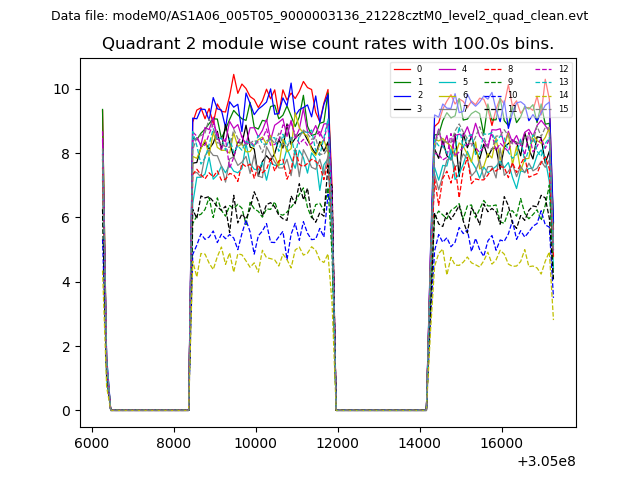
| Module-wise count rates for Quadrant B Data is divided into 100 sec bins |
 |
 |
| Module-wise count rates for Quadrant C Data is divided into 100 sec bins |
 |
 |
| Module-wise count rates for Quadrant D Data is divided into 100 sec bins |
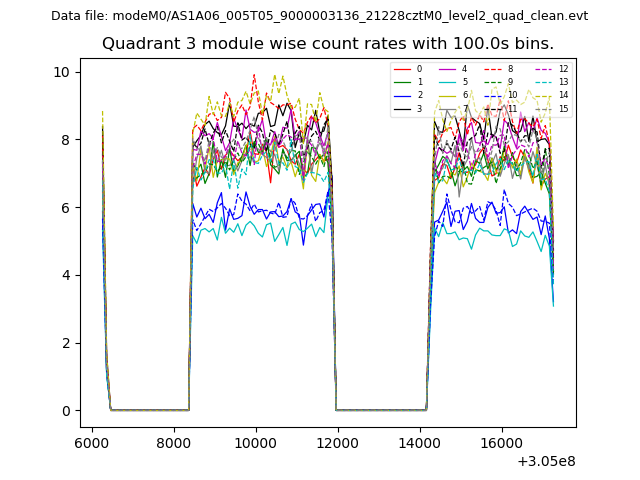 |
 |
| Parameter | Plot |
|---|---|
| CZT HV Monitor | 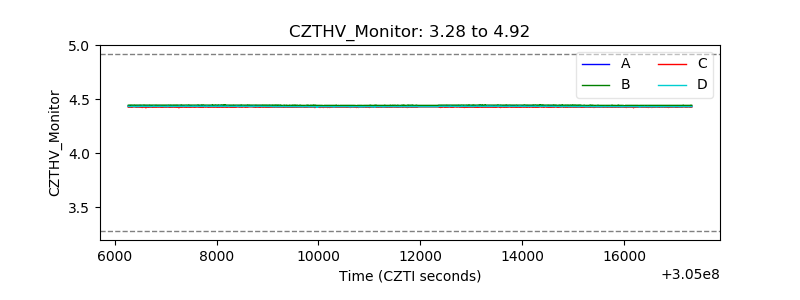 |
| D_VDD | 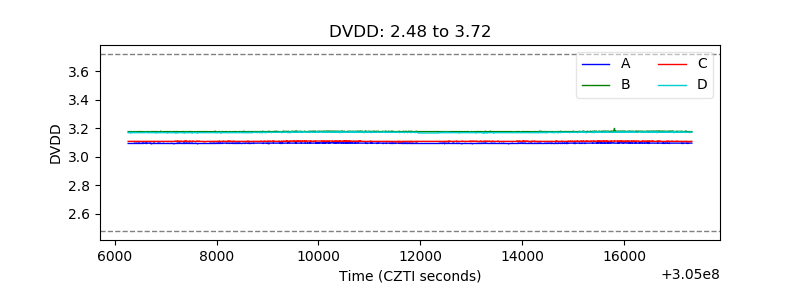 |
| Temperature 1 | 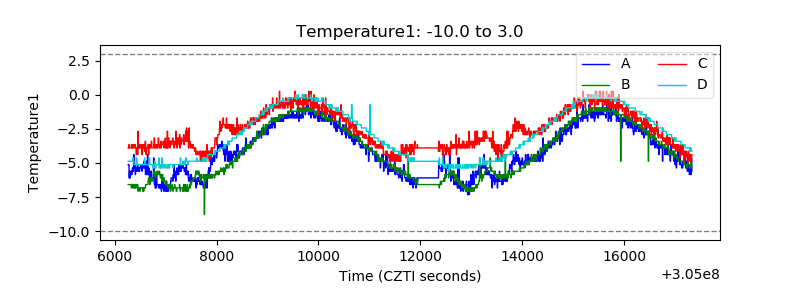 |
| Veto HV Monitor | 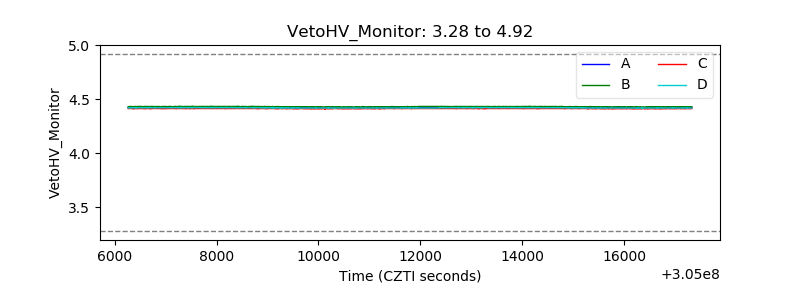 |
| Veto LLD | 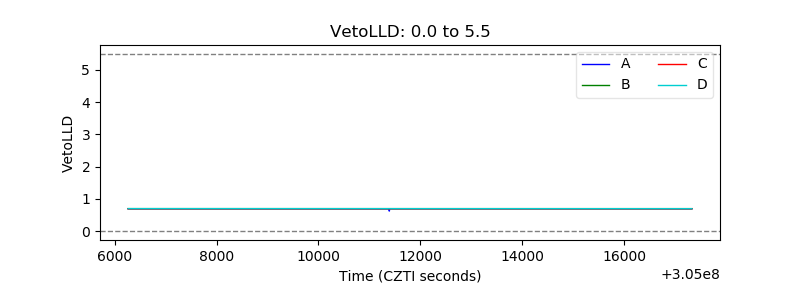 |
| Alpha Counter | 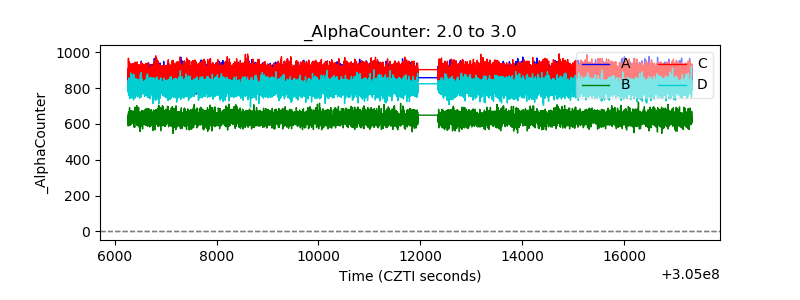 |
| _CPM_Rate | 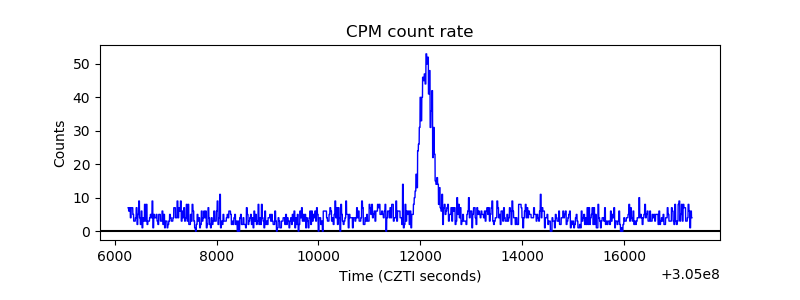 |
| CZT Counter | 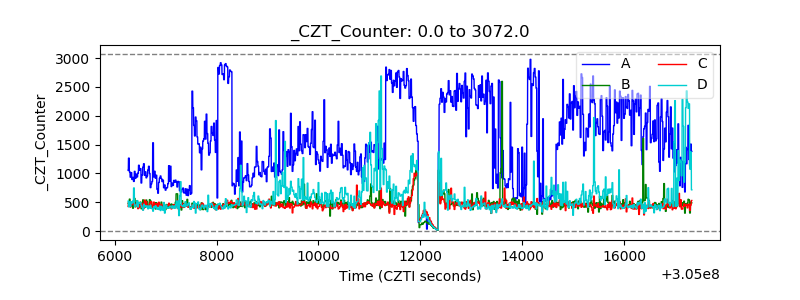 |
| +2.5 Volts monitor | 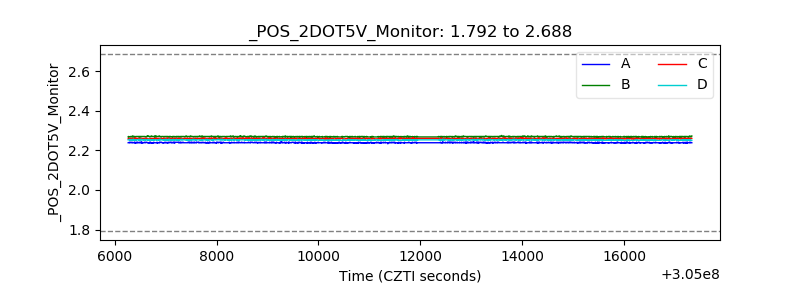 |
| +5 Volts monitor | 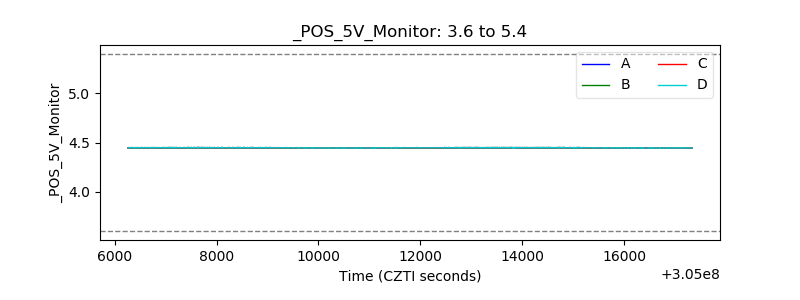 |
| _ROLL_ROT | 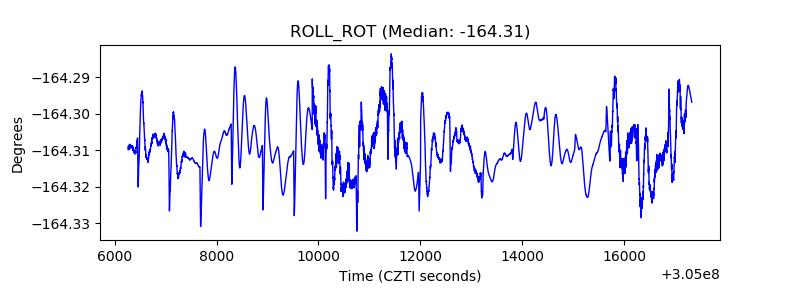 |
| _Roll_DEC | 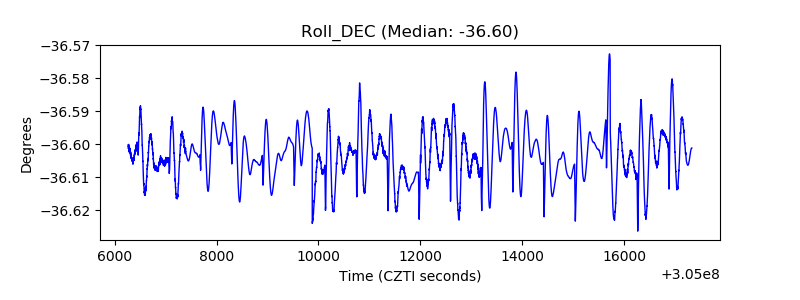 |
| _Roll_RA | 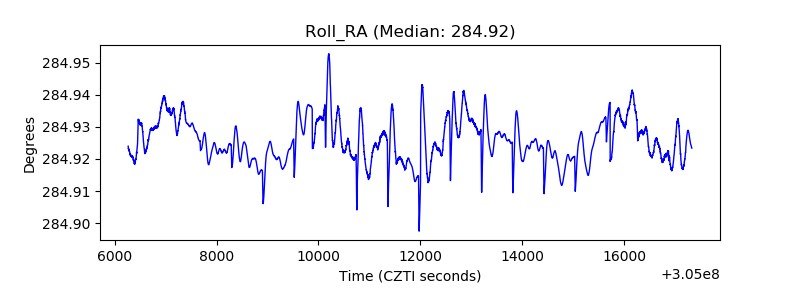 |
| Veto Counter | 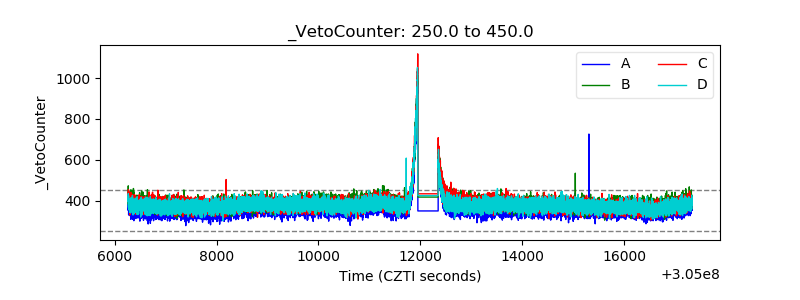 |