| Param | Original file | Final file |
|---|---|---|
| Filename | modeM0/AS1A05_037T01_9000003140cztM0_level2.fits | modeM0/AS1A05_037T01_9000003140cztM0_level2_quad_clean.evt |
| Size (bytes) | 2,305,497,600 | 1,974,545,280 |
| Size | 2.1 GB | 1.8 GB |
| Events in quadrant A | 14,460,052 | 11,631,480 |
| Events in quadrant B | 13,845,512 | 11,672,783 |
| Events in quadrant C | 14,092,914 | 11,329,602 |
| Events in quadrant D | 11,243,166 | 8,997,575 |
| Mode M9 | |||
|---|---|---|---|
| Quadrant | BADHDUFLAG | Total packets | Discarded packets |
| A | 0 | 384 | 0 |
| B | 0 | 384 | 0 |
| C | 0 | 384 | 0 |
| D | 0 | 384 | 0 |
| Mode M0 | |||
|---|---|---|---|
| Quadrant | BADHDUFLAG | Total packets | Discarded packets |
| A | 0 | 508346 | 0 |
| B | 0 | 519624 | 0 |
| C | 0 | 496645 | 0 |
| D | 0 | 840782 | 0 |
| Mode SS | |||
|---|---|---|---|
| Quadrant | BADHDUFLAG | Total packets | Discarded packets |
| A | 0 | 4818 | 0 |
| B | 0 | 4818 | 0 |
| C | 0 | 4818 | 0 |
| D | 0 | 4818 | 0 |
| Quadrant | Total seconds | Saturated seconds | Saturation percentage |
|---|---|---|---|
| A | 235985 | 3268 | 1.384834% |
| B | 235987 | 4580 | 1.940785% |
| C | 235987 | 3886 | 1.646701% |
| D | 235986 | 34766 | 14.732230% |
Noise dominated data is calculated using 1-second bins in cleaned event files. If a bin has >2000 counts, and if more than 50% of those come from <1% of pixels, then it is considered to be noise-dominated and hence unusable.
| Quadrant | # 1 sec bins | Bins with >0 counts | Bins with >2000 counts | High rate bins dominated by noise | Noise dominated (total time) | Noise dominated (detector-on time) | Marked lightcurve |
|---|---|---|---|---|---|---|---|
| A | 282498 | 235955 | 0 | 0 | 0.00% | 0.00% | 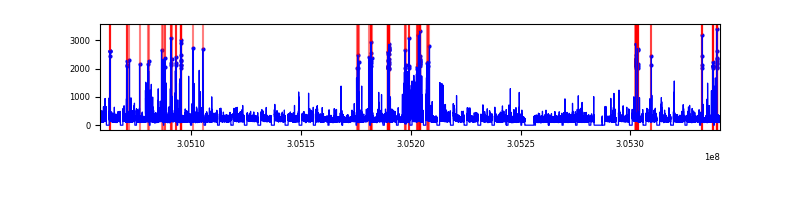 |
| B | 282498 | 235924 | 0 | 0 | 0.00% | 0.00% |  |
| C | 282498 | 235964 | 0 | 0 | 0.00% | 0.00% | 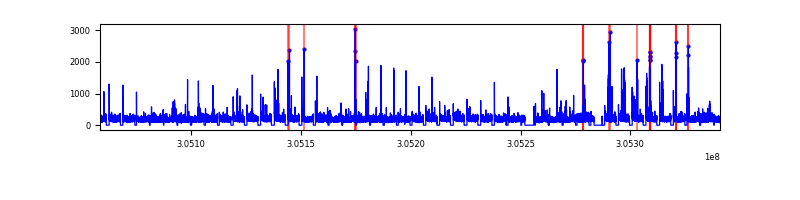 |
| D | 282498 | 233542 | 0 | 0 | 0.00% | 0.00% | 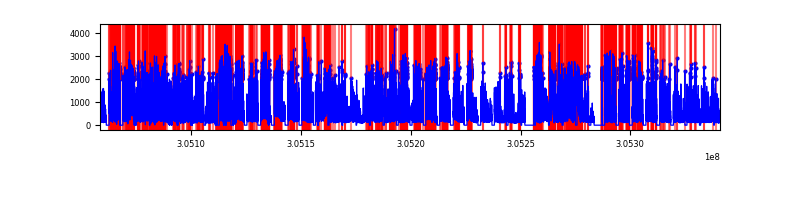 |
Top three noisy pixels from each quadrant. If the there are fewer than three noisy pixels in the level2.evt file, extra rows are filled as -1
| Pixel properties | Quadrant properties | ||||||
|---|---|---|---|---|---|---|---|
| Quadrant | DetID | PixID | Counts | Sigma | Mean | Median | Sigma |
| A | 0 | 29 | 14089 | 11.6 | 3772 | 3548 | 908.6 |
| A | 7 | 110 | 11642 | 8.91 | 3772 | 3548 | 908.6 |
| A | 0 | 30 | 11066 | 8.27 | 3772 | 3548 | 908.6 |
| B | 2 | 9 | 11055 | 10.65 | 3658 | 3489 | 710.1 |
| B | 2 | 8 | 9298 | 8.18 | 3658 | 3489 | 710.1 |
| B | 14 | 254 | 9017 | 7.78 | 3658 | 3489 | 710.1 |
| C | 1 | 80 | 10835 | 7.72 | 3716 | 3464 | 954.4 |
| C | 1 | 81 | 10801 | 7.69 | 3716 | 3464 | 954.4 |
| C | 12 | 241 | 9796 | 6.63 | 3716 | 3464 | 954.4 |
| D | 3 | 14 | 8134 | 6.08 | 3219 | 2929 | 855.9 |
| D | 7 | 3 | 7953 | 5.87 | 3219 | 2929 | 855.9 |
| D | 10 | 189 | 7932 | 5.85 | 3219 | 2929 | 855.9 |
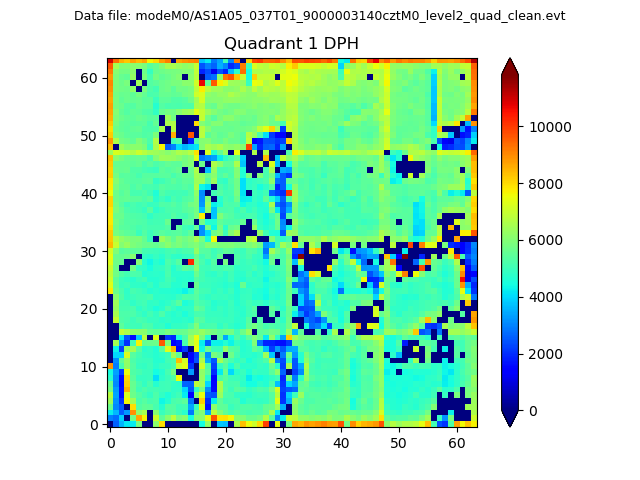
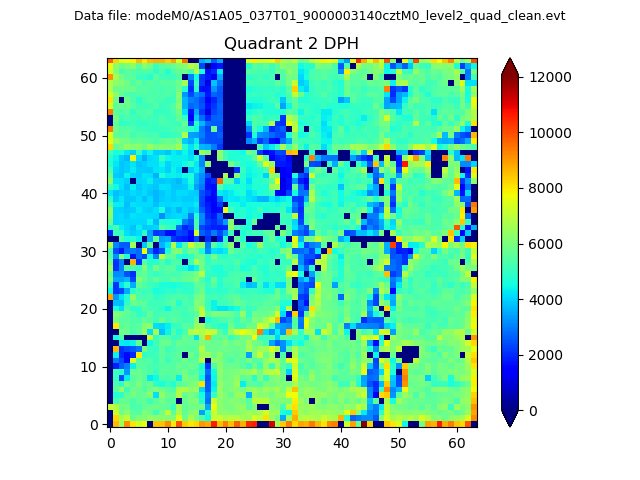
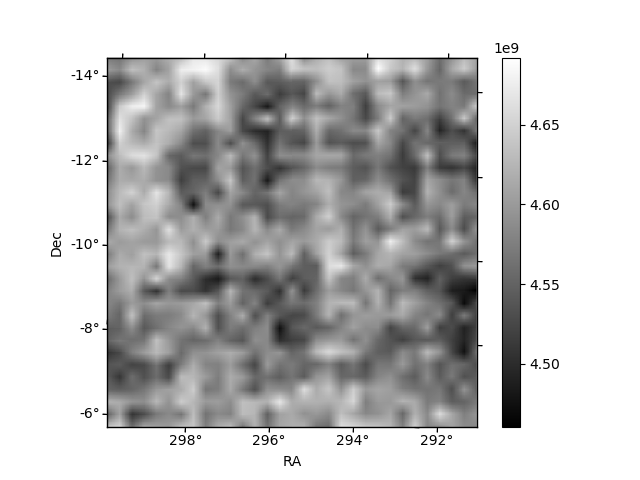
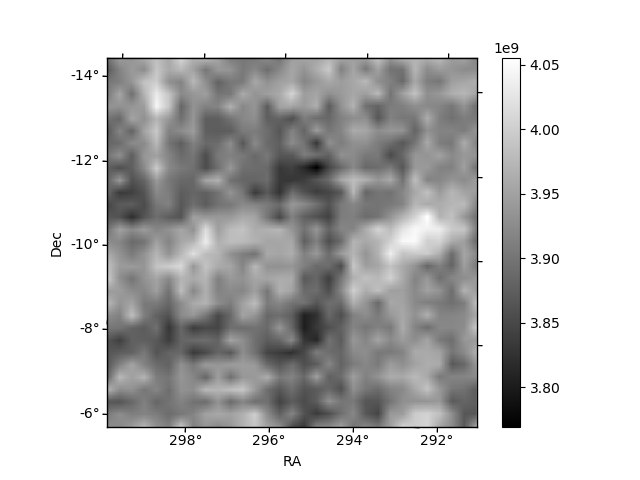
Histogram calculated using DETX and DETY for each event in the final _common_clean file
| Quadrant A | 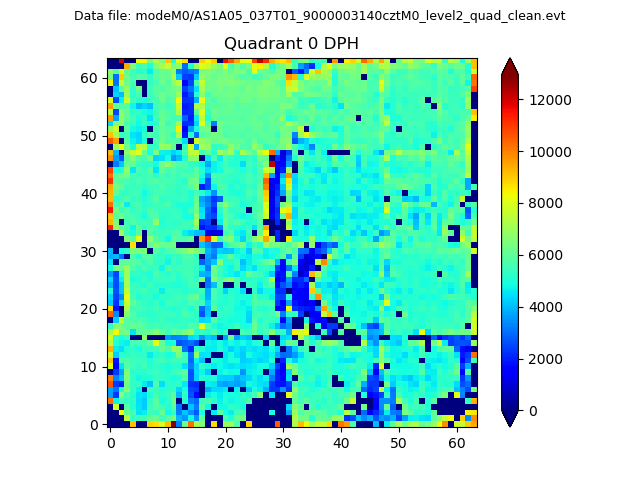 |
 |
Quadrant B |
|---|---|---|---|
| Quadrant D | 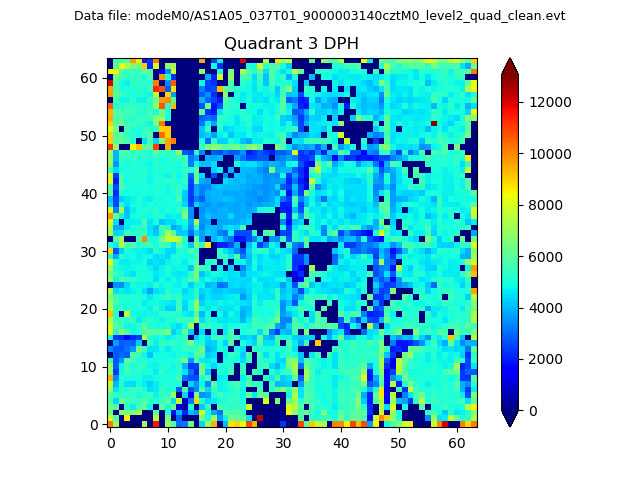 |
 |
Quadrant C |
| Plot type | Count rate plots | Images |
|---|---|---|
| Comparison with Poisson distribution Blue bars denote a histogram of data divided into 1 sec bins. Red curve is a Poisson curve with rate = median count rate of data. |
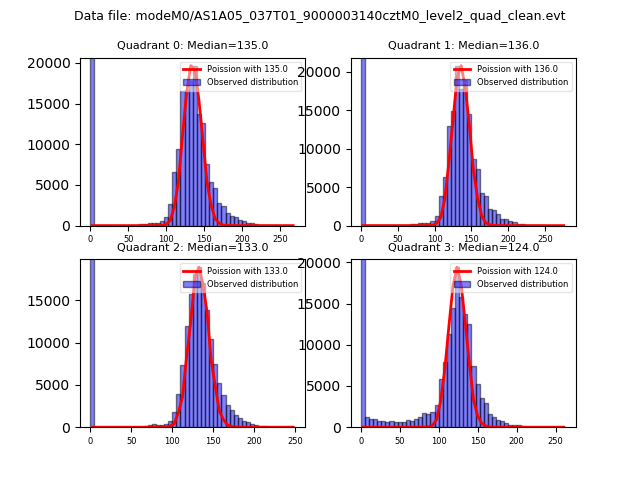 |
 |
| Quadrant-wise count rates Data is divided into 100 sec bins |
 |
|
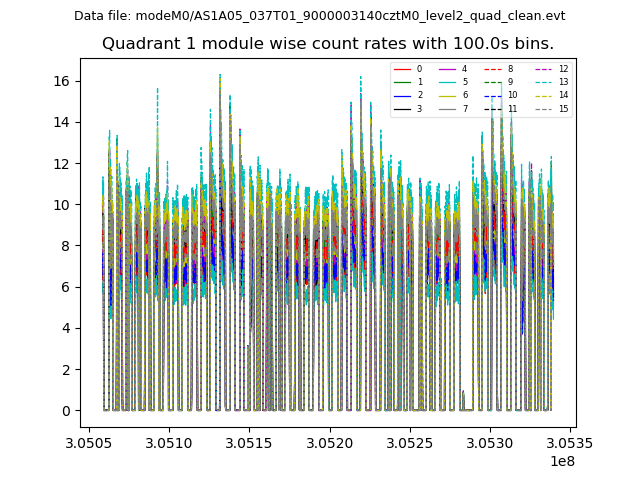
| Module-wise count rates for Quadrant A Data is divided into 100 sec bins |
 |
 |
| Module-wise count rates for Quadrant B Data is divided into 100 sec bins |
 |
 |
| Module-wise count rates for Quadrant C Data is divided into 100 sec bins |
 |
 |
| Module-wise count rates for Quadrant D Data is divided into 100 sec bins |
 |
 |
| Parameter | Plot |
|---|---|
| CZT HV Monitor |  |
| D_VDD |  |
| Temperature 1 | 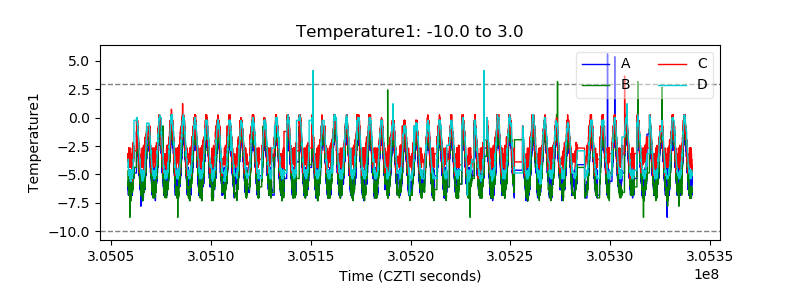 |
| Veto HV Monitor |  |
| Veto LLD |  |
| Alpha Counter |  |
| _CPM_Rate | 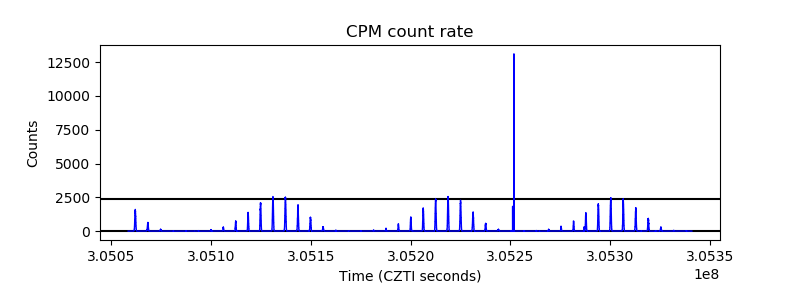 |
| CZT Counter | 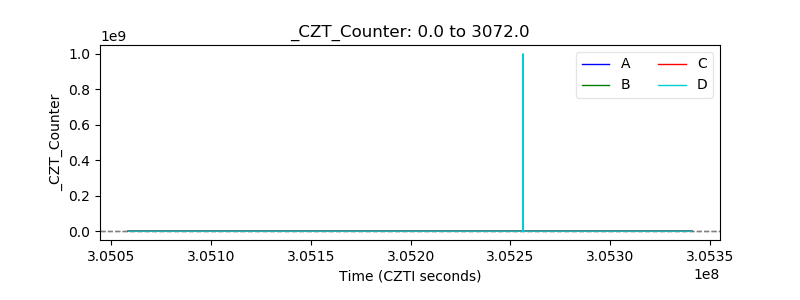 |
| +2.5 Volts monitor |  |
| +5 Volts monitor |  |
| _ROLL_ROT |  |
| _Roll_DEC | 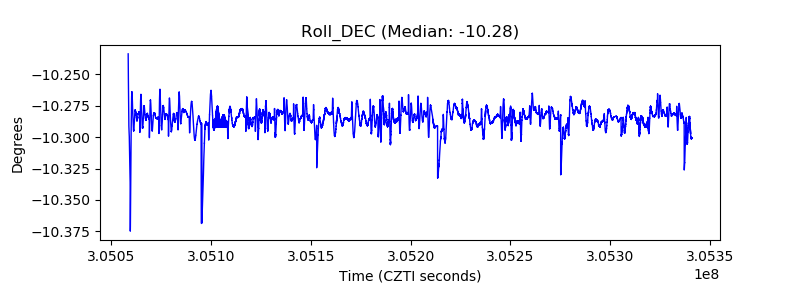 |
| _Roll_RA | 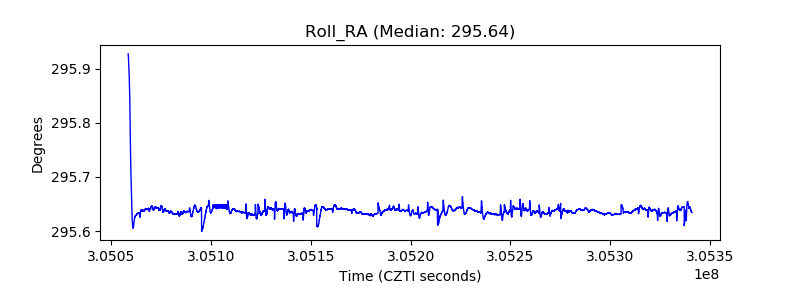 |
| Veto Counter |  |