| Param | Original file | Final file |
|---|---|---|
| Filename | modeM0/AS1A05_037T01_9000003140_21235cztM0_level2.evt | modeM0/AS1A05_037T01_9000003140_21235cztM0_level2_quad_clean.evt |
| Size (bytes) | 339,523,200 | 50,060,160 |
| Size | 323.8 MB | 47.7 MB |
| Events in quadrant A | 2,299,309 | 311,511 |
| Events in quadrant B | 2,367,451 | 313,713 |
| Events in quadrant C | 2,201,442 | 304,626 |
| Events in quadrant D | 3,122,247 | 284,122 |
| Mode M9 | |||
|---|---|---|---|
| Quadrant | BADHDUFLAG | Total packets | Discarded packets |
| A | 0 | 13 | 0 |
| B | 0 | 13 | 0 |
| C | 0 | 13 | 0 |
| D | 0 | 13 | 0 |
| Mode M0 | |||
|---|---|---|---|
| Quadrant | BADHDUFLAG | Total packets | Discarded packets |
| A | 0 | 9537 | 1 |
| B | 0 | 9691 | 2 |
| C | 0 | 9228 | 1 |
| D | 0 | 12124 | 1 |
| Mode SS | |||
|---|---|---|---|
| Quadrant | BADHDUFLAG | Total packets | Discarded packets |
| A | 0 | 86 | 0 |
| B | 0 | 86 | 0 |
| C | 0 | 86 | 0 |
| D | 0 | 86 | 0 |
| Quadrant | Total seconds | Saturated seconds | Saturation percentage |
|---|---|---|---|
| A | 4289 | 146 | 3.404057% |
| B | 4288 | 175 | 4.081157% |
| C | 4288 | 169 | 3.941231% |
| D | 4288 | 261 | 6.086754% |
Noise dominated data is calculated using 1-second bins in cleaned event files. If a bin has >2000 counts, and if more than 50% of those come from <1% of pixels, then it is considered to be noise-dominated and hence unusable.
| Quadrant | # 1 sec bins | Bins with >0 counts | Bins with >2000 counts | High rate bins dominated by noise | Noise dominated (total time) | Noise dominated (detector-on time) | Marked lightcurve |
|---|---|---|---|---|---|---|---|
| A | 5584 | 4289 | 4 | 4 | 0.07% | 0.09% | 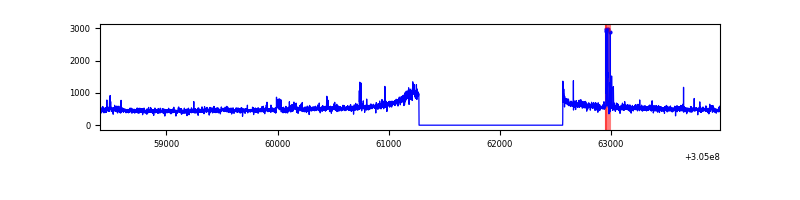 |
| B | 5583 | 4288 | 45 | 45 | 0.81% | 1.05% | 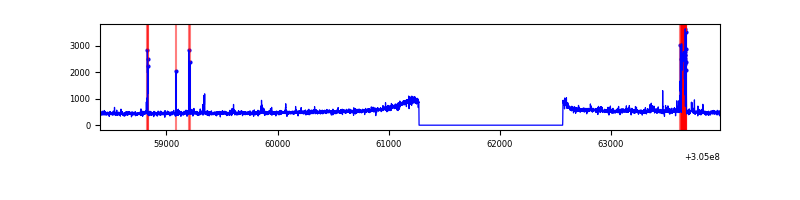 |
| C | 5583 | 4288 | 0 | 0 | 0.00% | 0.00% | 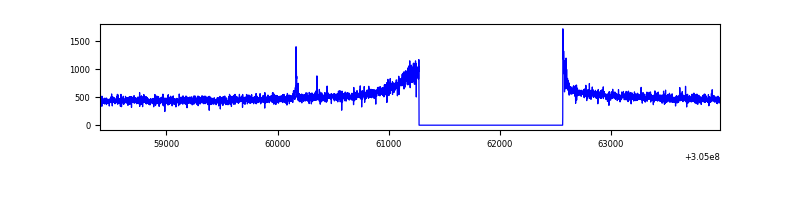 |
| D | 5583 | 4288 | 116 | 116 | 2.08% | 2.71% | 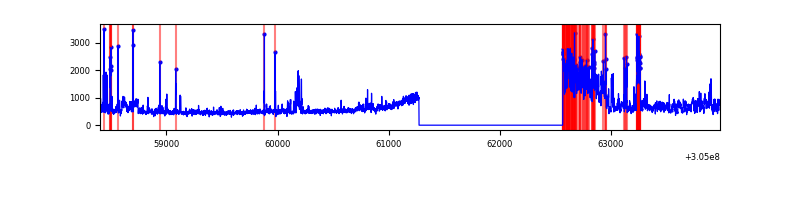 |
Top three noisy pixels from each quadrant. If the there are fewer than three noisy pixels in the level2.evt file, extra rows are filled as -1
| Pixel properties | Quadrant properties | ||||||
|---|---|---|---|---|---|---|---|
| Quadrant | DetID | PixID | Counts | Sigma | Mean | Median | Sigma |
| A | 5 | 16 | 41070 | 349.62 | 564 | 553 | 115.9 |
| A | 11 | 47 | 26701 | 225.63 | 564 | 553 | 115.9 |
| A | 12 | 96 | 22303 | 187.68 | 564 | 553 | 115.9 |
| B | 0 | 189 | 105639 | 970.98 | 559 | 546 | 108.2 |
| B | 3 | 64 | 31065 | 281.97 | 559 | 546 | 108.2 |
| B | 0 | 190 | 16810 | 150.27 | 559 | 546 | 108.2 |
| C | 14 | 238 | 84515 | 666.35 | 537 | 540 | 126.0 |
| C | 0 | 10 | 10987 | 82.9 | 537 | 540 | 126.0 |
| C | 7 | 247 | 10781 | 81.26 | 537 | 540 | 126.0 |
| D | 13 | 174 | 401594 | 3032.98 | 537 | 521 | 132.2 |
| D | 1 | 239 | 290239 | 2190.89 | 537 | 521 | 132.2 |
| D | 13 | 153 | 159008 | 1198.5 | 537 | 521 | 132.2 |
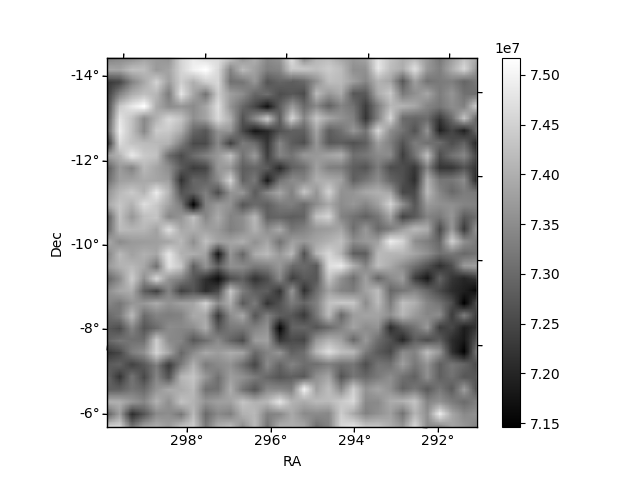
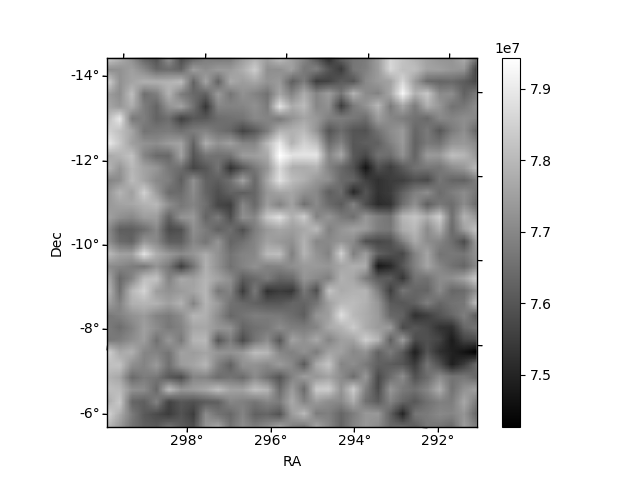
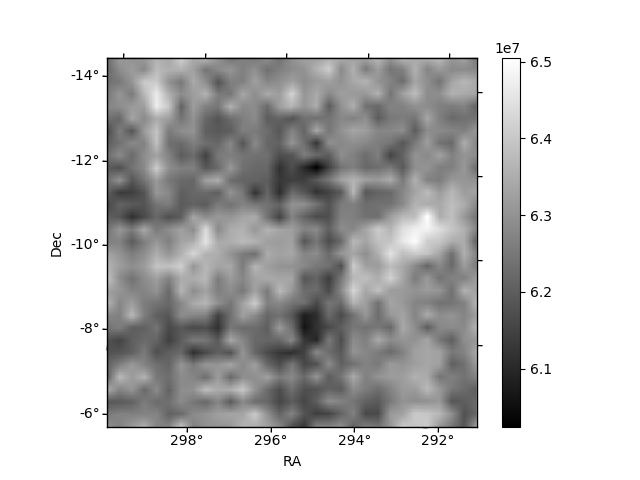
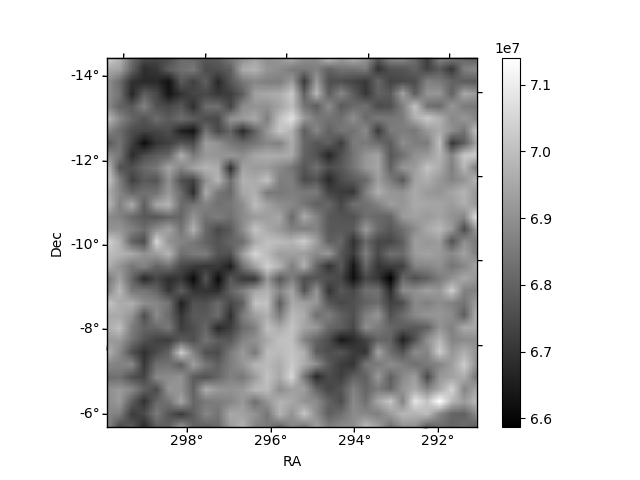
Histogram calculated using DETX and DETY for each event in the final _common_clean file
| Quadrant A | 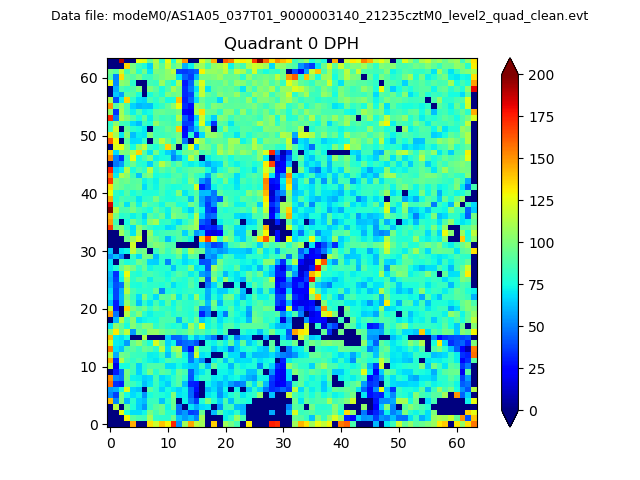 |
 |
Quadrant B |
|---|---|---|---|
| Quadrant D | 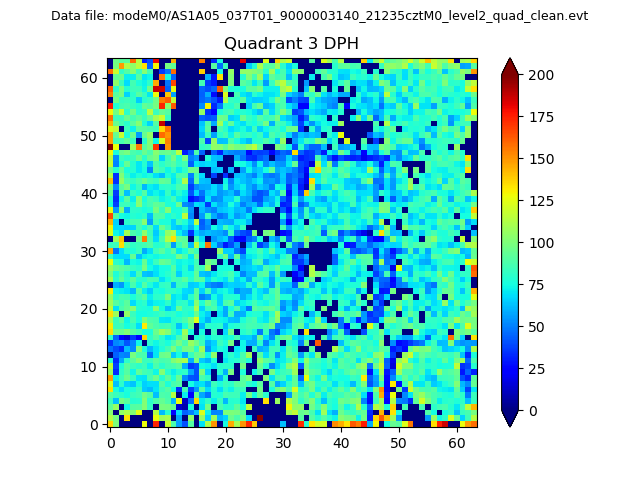 |
 |
Quadrant C |
| Plot type | Count rate plots | Images |
|---|---|---|
| Comparison with Poisson distribution Blue bars denote a histogram of data divided into 1 sec bins. Red curve is a Poisson curve with rate = median count rate of data. |
 |
 |
| Quadrant-wise count rates Data is divided into 100 sec bins |
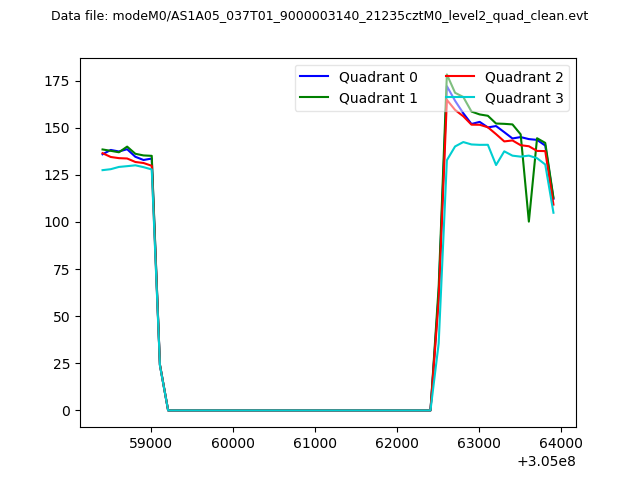 |
|
| Module-wise count rates for Quadrant A Data is divided into 100 sec bins |
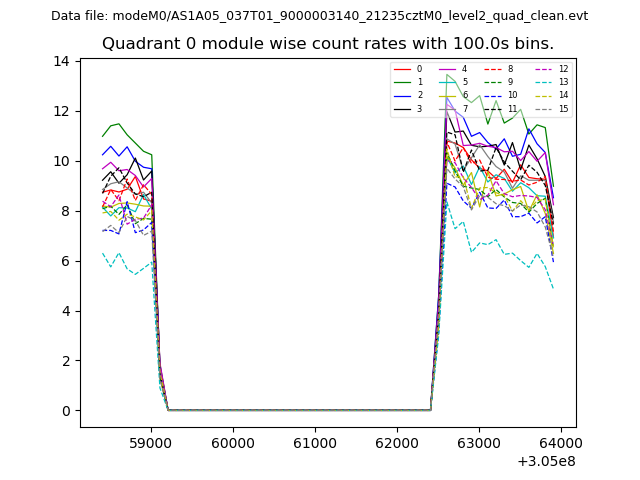 |
 |
| Module-wise count rates for Quadrant B Data is divided into 100 sec bins |
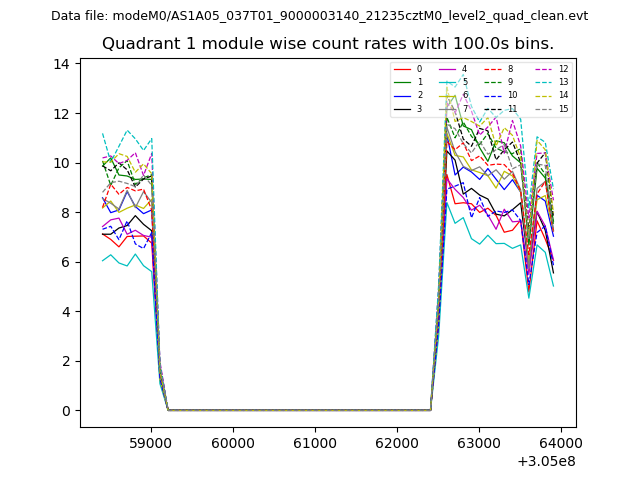 |
 |
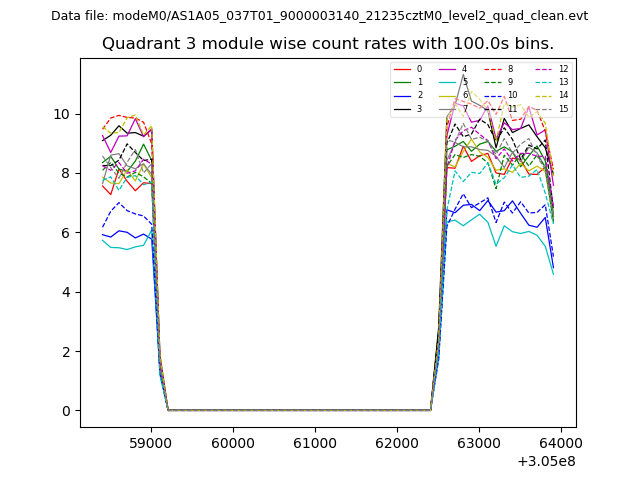
| Module-wise count rates for Quadrant C Data is divided into 100 sec bins |
 |
 |
| Module-wise count rates for Quadrant D Data is divided into 100 sec bins |
 |
 |
| Parameter | Plot |
|---|---|
| CZT HV Monitor |  |
| D_VDD | 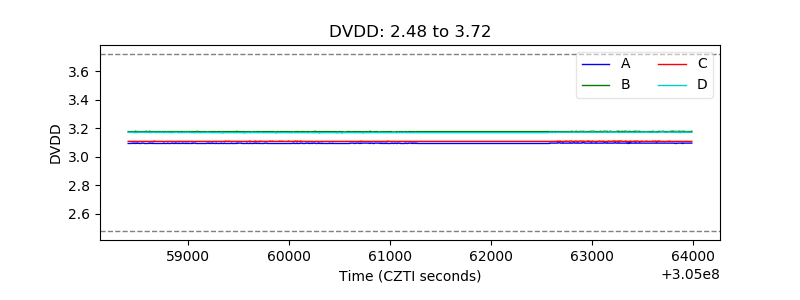 |
| Temperature 1 | 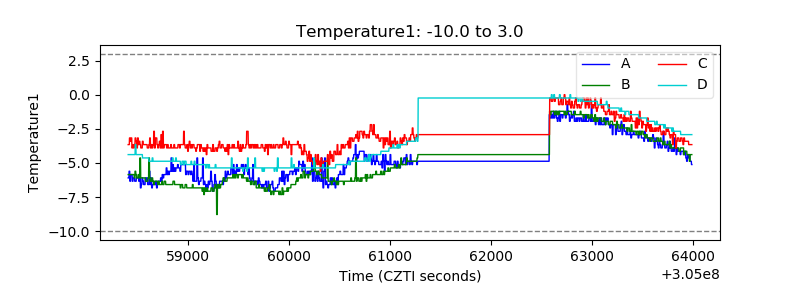 |
| Veto HV Monitor | 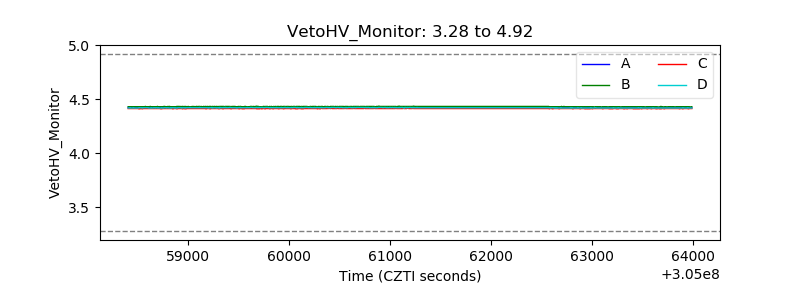 |
| Veto LLD | 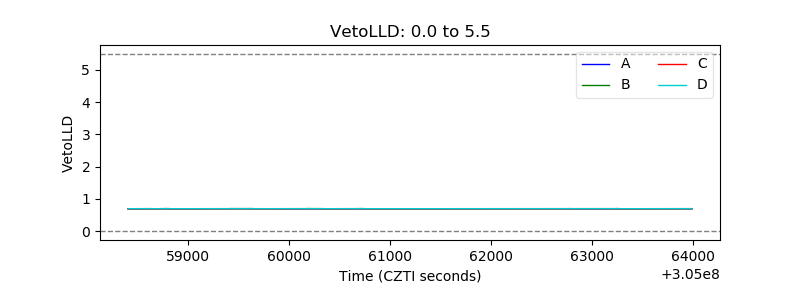 |
| Alpha Counter |  |
| _CPM_Rate | 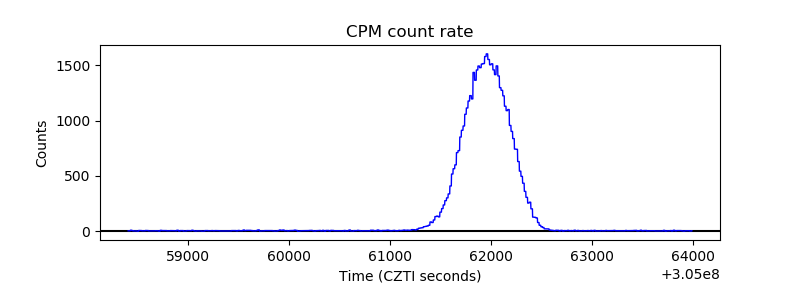 |
| CZT Counter | 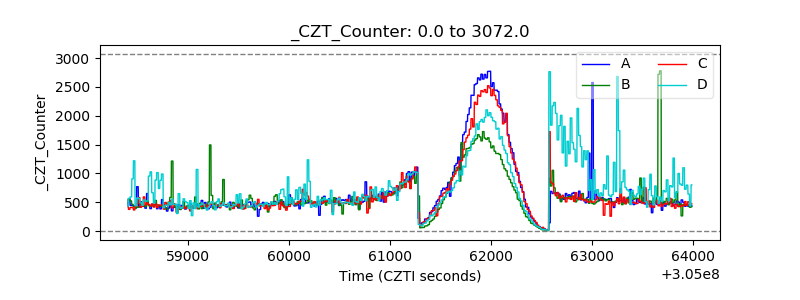 |
| +2.5 Volts monitor |  |
| +5 Volts monitor |  |
| _ROLL_ROT | 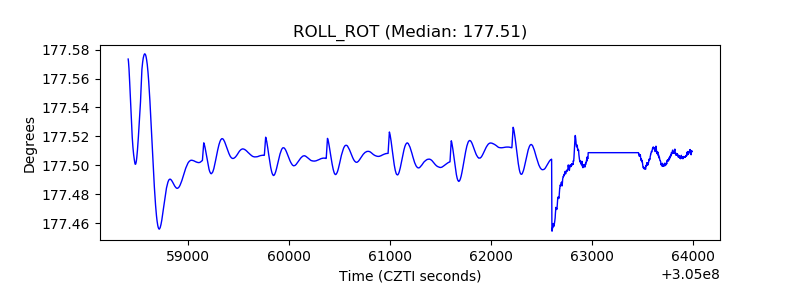 |
| _Roll_DEC | 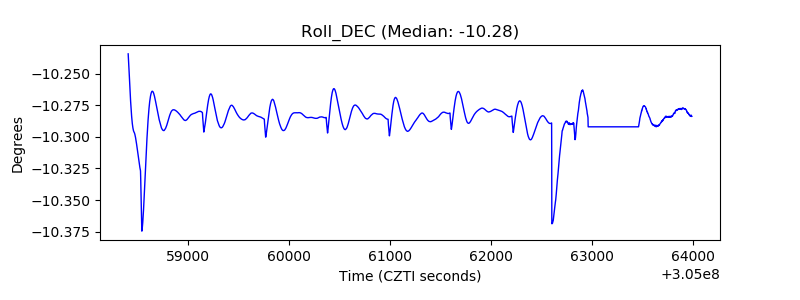 |
| _Roll_RA | 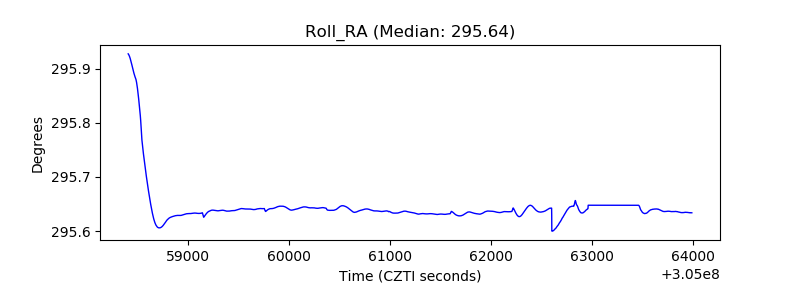 |
| Veto Counter | 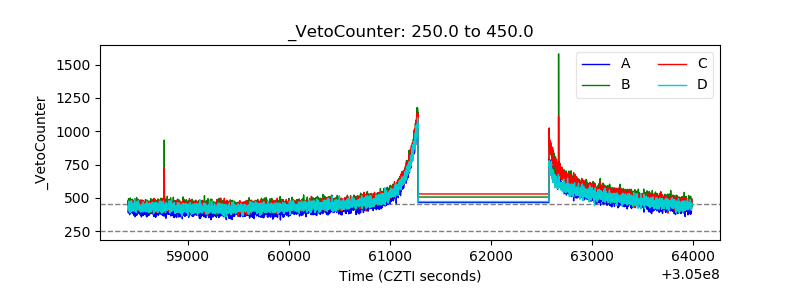 |