| Param | Original file | Final file |
|---|---|---|
| Filename | modeM0/AS1A05_037T01_9000003140_21237cztM0_level2.evt | modeM0/AS1A05_037T01_9000003140_21237cztM0_level2_quad_clean.evt |
| Size (bytes) | 743,984,640 | 89,841,600 |
| Size | 709.5 MB | 85.7 MB |
| Events in quadrant A | 3,320,230 | 616,433 |
| Events in quadrant B | 3,377,366 | 621,306 |
| Events in quadrant C | 3,244,060 | 606,149 |
| Events in quadrant D | 12,133,618 | 405,724 |
| Mode M9 | |||
|---|---|---|---|
| Quadrant | BADHDUFLAG | Total packets | Discarded packets |
| A | 0 | 13 | 0 |
| B | 0 | 14 | 0 |
| C | 0 | 14 | 0 |
| D | 0 | 14 | 0 |
| Mode M0 | |||
|---|---|---|---|
| Quadrant | BADHDUFLAG | Total packets | Discarded packets |
| A | 0 | 14233 | 2 |
| B | 0 | 14416 | 2 |
| C | 0 | 13978 | 2 |
| D | 0 | 40675 | 2 |
| Mode SS | |||
|---|---|---|---|
| Quadrant | BADHDUFLAG | Total packets | Discarded packets |
| A | 0 | 136 | 0 |
| B | 0 | 136 | 0 |
| C | 0 | 136 | 0 |
| D | 0 | 136 | 0 |
| Quadrant | Total seconds | Saturated seconds | Saturation percentage |
|---|---|---|---|
| A | 6752 | 31 | 0.459123% |
| B | 6752 | 55 | 0.814573% |
| C | 6752 | 69 | 1.021919% |
| D | 6752 | 3145 | 46.578791% |
Noise dominated data is calculated using 1-second bins in cleaned event files. If a bin has >2000 counts, and if more than 50% of those come from <1% of pixels, then it is considered to be noise-dominated and hence unusable.
| Quadrant | # 1 sec bins | Bins with >0 counts | Bins with >2000 counts | High rate bins dominated by noise | Noise dominated (total time) | Noise dominated (detector-on time) | Marked lightcurve |
|---|---|---|---|---|---|---|---|
| A | 7527 | 6753 | 6 | 6 | 0.08% | 0.09% | 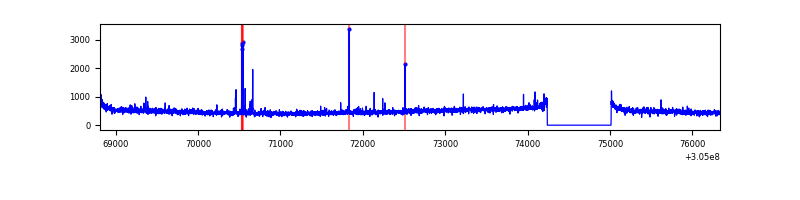 |
| B | 7527 | 6753 | 4 | 4 | 0.05% | 0.06% | 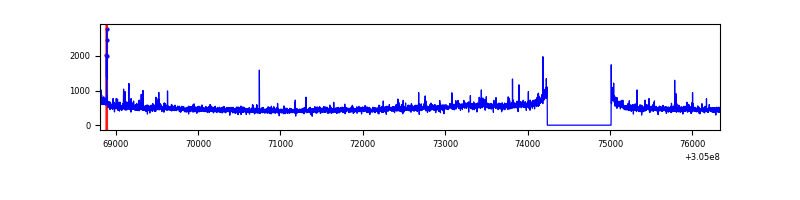 |
| C | 7527 | 6753 | 0 | 0 | 0.00% | 0.00% | 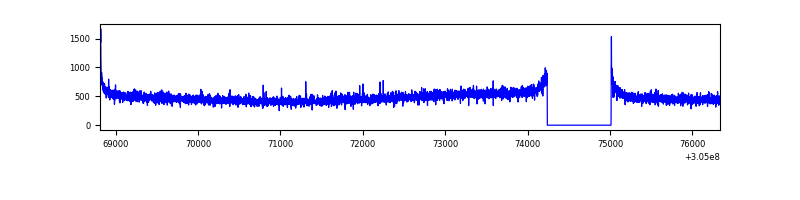 |
| D | 7527 | 6752 | 3143 | 3143 | 41.76% | 46.55% | 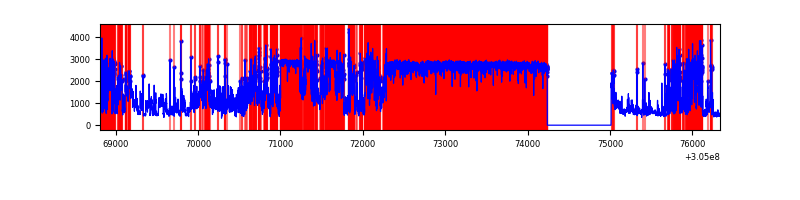 |
Top three noisy pixels from each quadrant. If the there are fewer than three noisy pixels in the level2.evt file, extra rows are filled as -1
| Pixel properties | Quadrant properties | ||||||
|---|---|---|---|---|---|---|---|
| Quadrant | DetID | PixID | Counts | Sigma | Mean | Median | Sigma |
| A | 5 | 16 | 43890 | 257.05 | 830 | 812 | 167.6 |
| A | 11 | 47 | 31788 | 184.84 | 830 | 812 | 167.6 |
| A | 3 | 1 | 21193 | 121.62 | 830 | 812 | 167.6 |
| B | 0 | 190 | 37220 | 230.23 | 828 | 809 | 158.2 |
| B | 0 | 197 | 26777 | 164.2 | 828 | 809 | 158.2 |
| B | 0 | 229 | 19172 | 116.11 | 828 | 809 | 158.2 |
| C | 14 | 238 | 124736 | 662.44 | 796 | 799 | 187.1 |
| C | 0 | 10 | 18053 | 92.22 | 796 | 799 | 187.1 |
| C | 13 | 61 | 5742 | 26.42 | 796 | 799 | 187.1 |
| D | 1 | 239 | 7734036 | 60812.67 | 526 | 513 | 127.2 |
| D | 13 | 174 | 1229637 | 9665.23 | 526 | 513 | 127.2 |
| D | 7 | 238 | 851219 | 6689.54 | 526 | 513 | 127.2 |
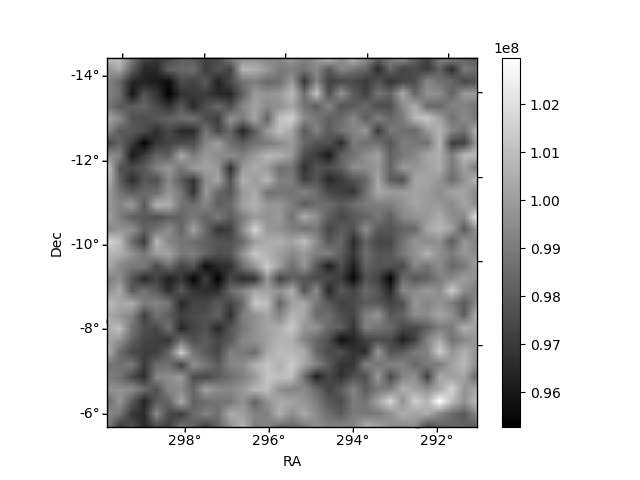
Histogram calculated using DETX and DETY for each event in the final _common_clean file
| Quadrant A |  |
 |
Quadrant B |
|---|---|---|---|
| Quadrant D |  |
 |
Quadrant C |
| Plot type | Count rate plots | Images |
|---|---|---|
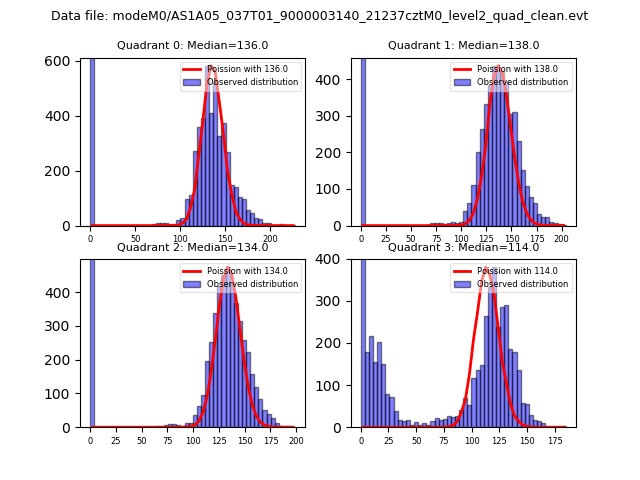
| Comparison with Poisson distribution Blue bars denote a histogram of data divided into 1 sec bins. Red curve is a Poisson curve with rate = median count rate of data. |
 |
 |
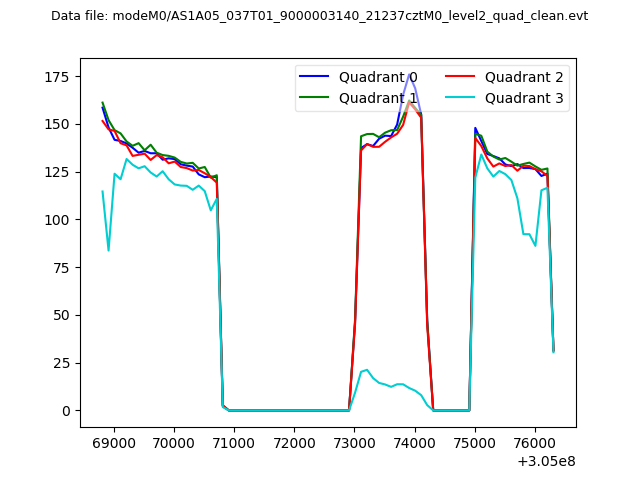
| Quadrant-wise count rates Data is divided into 100 sec bins |
 |
|
| Module-wise count rates for Quadrant A Data is divided into 100 sec bins |
 |
 |
| Module-wise count rates for Quadrant B Data is divided into 100 sec bins |
 |
 |
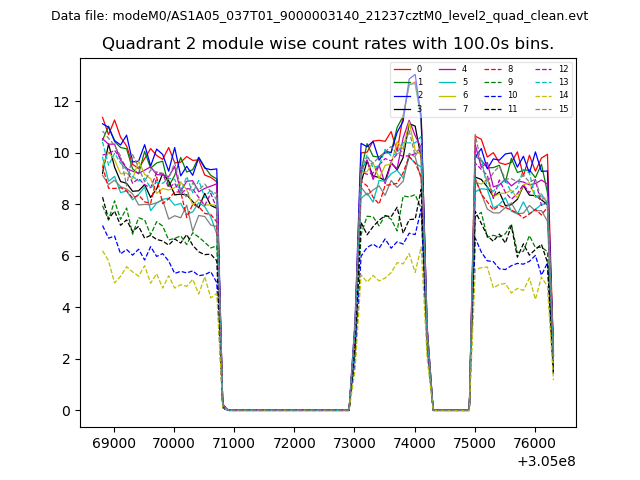
| Module-wise count rates for Quadrant C Data is divided into 100 sec bins |
 |
 |
| Module-wise count rates for Quadrant D Data is divided into 100 sec bins |
 |
 |
| Parameter | Plot |
|---|---|
| CZT HV Monitor | 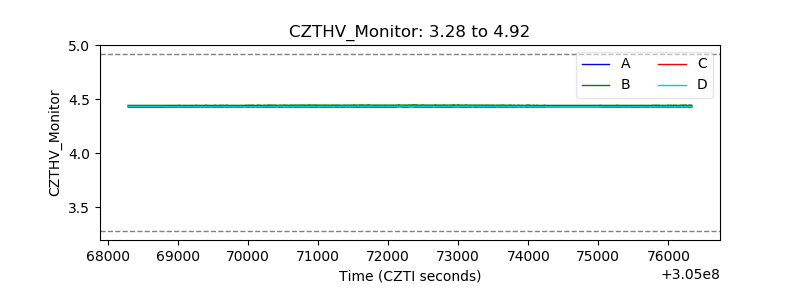 |
| D_VDD |  |
| Temperature 1 |  |
| Veto HV Monitor |  |
| Veto LLD |  |
| Alpha Counter | 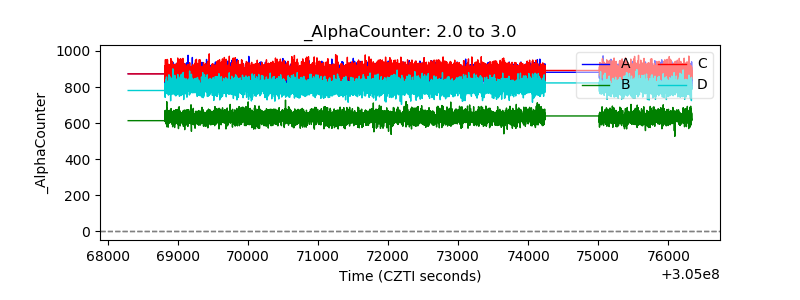 |
| _CPM_Rate | 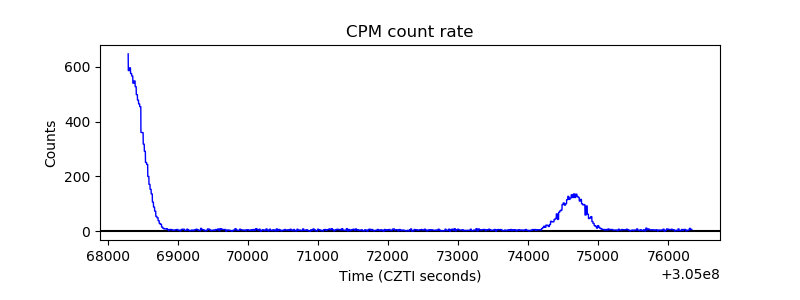 |
| CZT Counter |  |
| +2.5 Volts monitor |  |
| +5 Volts monitor |  |
| _ROLL_ROT |  |
| _Roll_DEC |  |
| _Roll_RA |  |
| Veto Counter |  |