| Param | Original file | Final file |
|---|---|---|
| Filename | modeM0/AS1A05_037T01_9000003140_21238cztM0_level2.evt | modeM0/AS1A05_037T01_9000003140_21238cztM0_level2_quad_clean.evt |
| Size (bytes) | 693,103,680 | 100,719,360 |
| Size | 661.0 MB | 96.1 MB |
| Events in quadrant A | 3,780,148 | 667,817 |
| Events in quadrant B | 3,767,259 | 678,175 |
| Events in quadrant C | 3,623,228 | 663,535 |
| Events in quadrant D | 9,303,866 | 509,731 |
| Mode M9 | |||
|---|---|---|---|
| Quadrant | BADHDUFLAG | Total packets | Discarded packets |
| A | 0 | 11 | 0 |
| B | 0 | 11 | 0 |
| C | 0 | 11 | 0 |
| D | 0 | 11 | 0 |
| Mode M0 | |||
|---|---|---|---|
| Quadrant | BADHDUFLAG | Total packets | Discarded packets |
| A | 0 | 16265 | 2 |
| B | 0 | 16138 | 2 |
| C | 0 | 15721 | 2 |
| D | 0 | 32907 | 2 |
| Mode SS | |||
|---|---|---|---|
| Quadrant | BADHDUFLAG | Total packets | Discarded packets |
| A | 0 | 158 | 0 |
| B | 0 | 158 | 0 |
| C | 0 | 158 | 0 |
| D | 0 | 158 | 0 |
| Quadrant | Total seconds | Saturated seconds | Saturation percentage |
|---|---|---|---|
| A | 7619 | 60 | 0.787505% |
| B | 7619 | 74 | 0.971256% |
| C | 7618 | 96 | 1.260173% |
| D | 7618 | 1843 | 24.192701% |
Noise dominated data is calculated using 1-second bins in cleaned event files. If a bin has >2000 counts, and if more than 50% of those come from <1% of pixels, then it is considered to be noise-dominated and hence unusable.
| Quadrant | # 1 sec bins | Bins with >0 counts | Bins with >2000 counts | High rate bins dominated by noise | Noise dominated (total time) | Noise dominated (detector-on time) | Marked lightcurve |
|---|---|---|---|---|---|---|---|
| A | 8720 | 7621 | 14 | 14 | 0.16% | 0.18% | 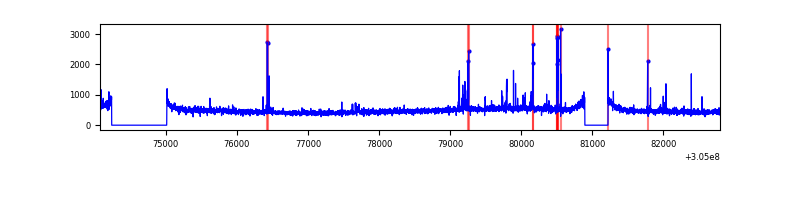 |
| B | 8720 | 7621 | 3 | 3 | 0.03% | 0.04% | 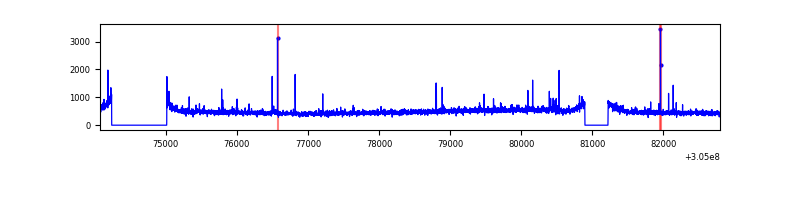 |
| C | 8719 | 7620 | 0 | 0 | 0.00% | 0.00% | 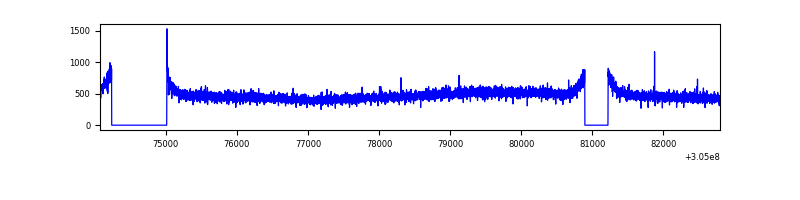 |
| D | 8719 | 7619 | 1741 | 1741 | 19.97% | 22.85% | 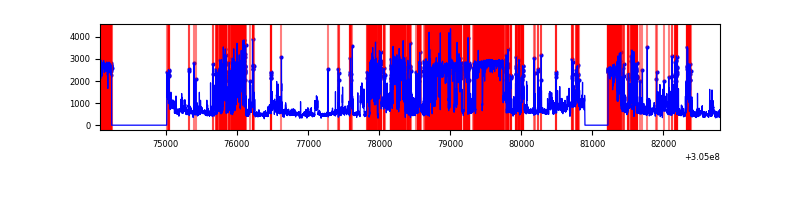 |
Top three noisy pixels from each quadrant. If the there are fewer than three noisy pixels in the level2.evt file, extra rows are filled as -1
| Pixel properties | Quadrant properties | ||||||
|---|---|---|---|---|---|---|---|
| Quadrant | DetID | PixID | Counts | Sigma | Mean | Median | Sigma |
| A | 12 | 96 | 79248 | 417.1 | 926 | 906 | 187.8 |
| A | 5 | 16 | 67435 | 354.21 | 926 | 906 | 187.8 |
| A | 11 | 47 | 43783 | 228.28 | 926 | 906 | 187.8 |
| B | 0 | 190 | 32536 | 175.98 | 930 | 908 | 179.7 |
| B | 3 | 64 | 26223 | 140.85 | 930 | 908 | 179.7 |
| B | 12 | 111 | 21499 | 114.57 | 930 | 908 | 179.7 |
| C | 14 | 238 | 139777 | 667.0 | 892 | 897 | 208.2 |
| C | 13 | 61 | 6227 | 25.6 | 892 | 897 | 208.2 |
| C | 0 | 10 | 5822 | 23.65 | 892 | 897 | 208.2 |
| D | 1 | 239 | 3879398 | 20966.54 | 759 | 738 | 185.0 |
| D | 7 | 238 | 1372321 | 7414.25 | 759 | 738 | 185.0 |
| D | 13 | 153 | 516851 | 2789.91 | 759 | 738 | 185.0 |
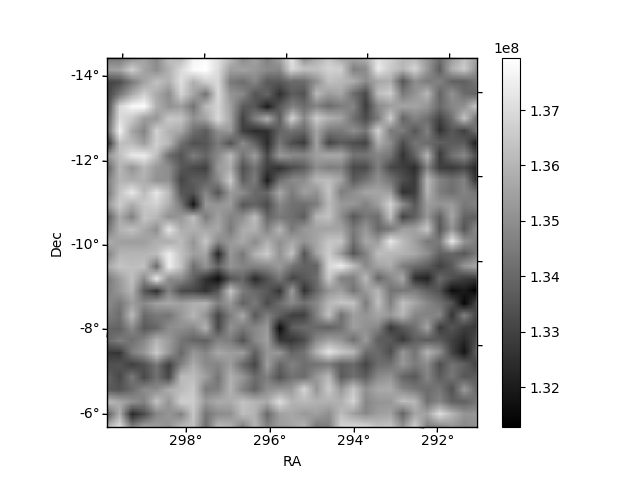
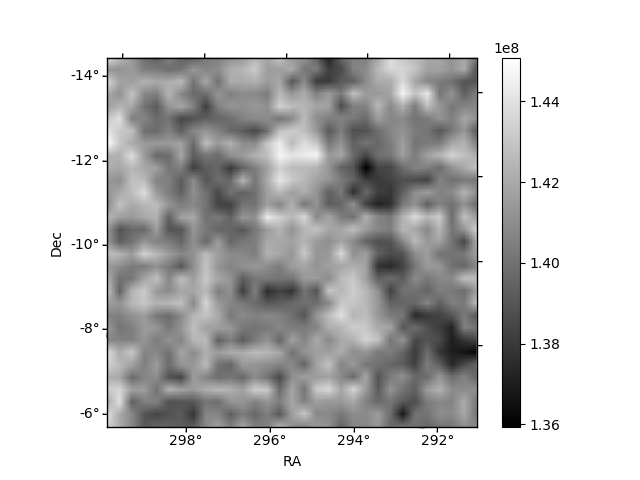
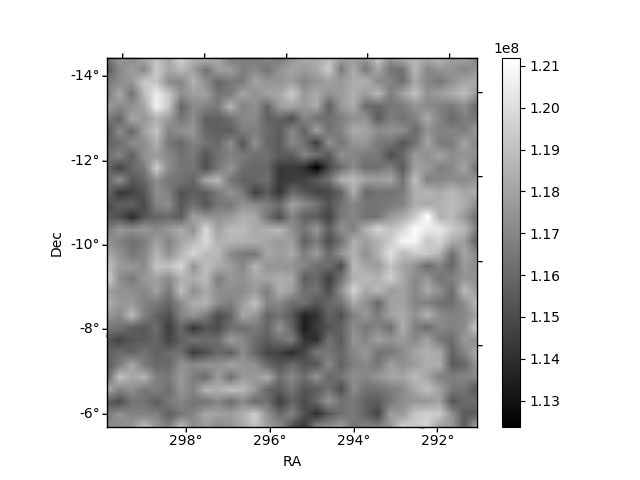
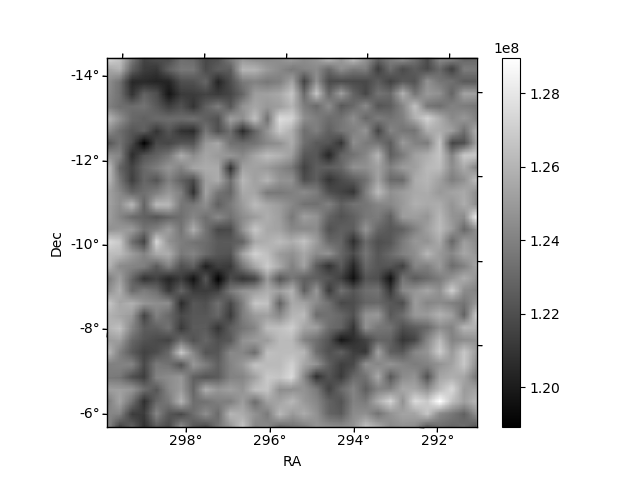
Histogram calculated using DETX and DETY for each event in the final _common_clean file
| Quadrant A | 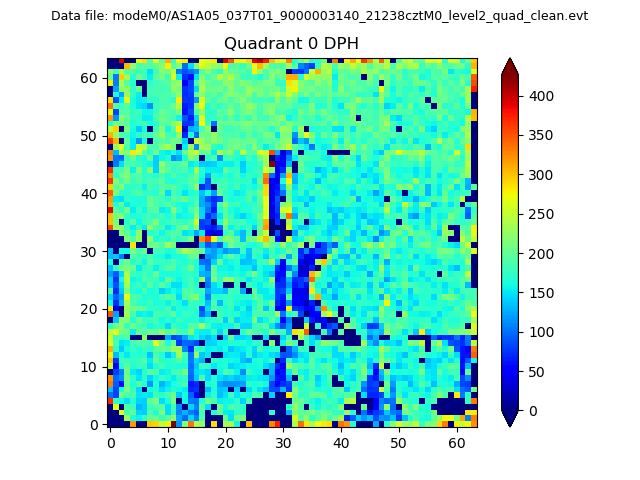 |
 |
Quadrant B |
|---|---|---|---|
| Quadrant D |  |
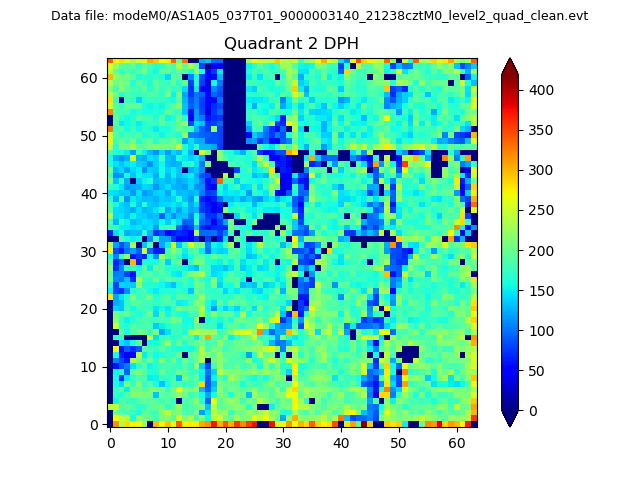 |
Quadrant C |
| Plot type | Count rate plots | Images |
|---|---|---|
| Comparison with Poisson distribution Blue bars denote a histogram of data divided into 1 sec bins. Red curve is a Poisson curve with rate = median count rate of data. |
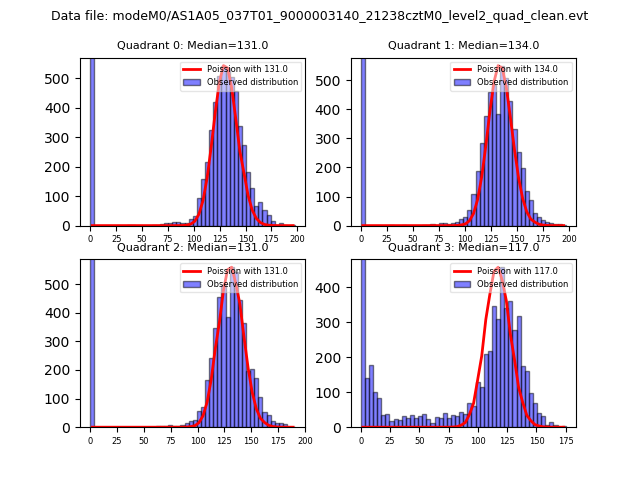 |
 |
| Quadrant-wise count rates Data is divided into 100 sec bins |
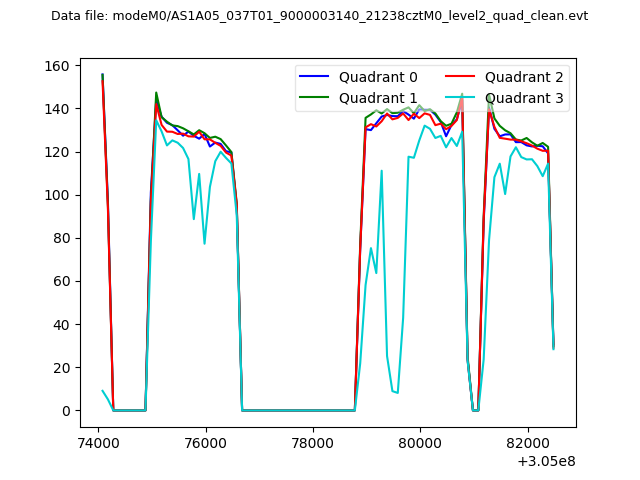 |
|
| Module-wise count rates for Quadrant A Data is divided into 100 sec bins |
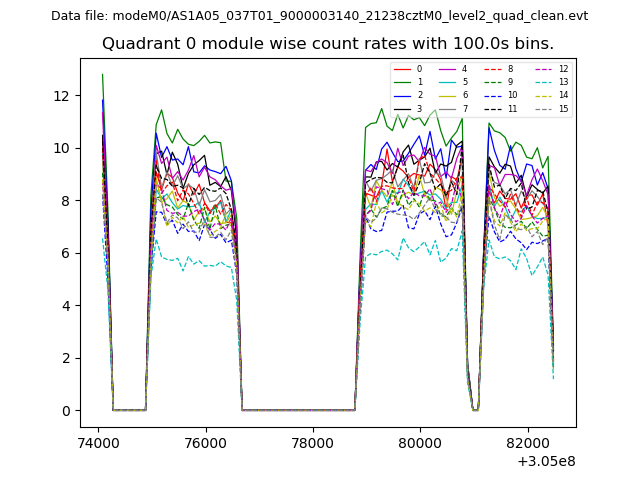 |
 |
| Module-wise count rates for Quadrant B Data is divided into 100 sec bins |
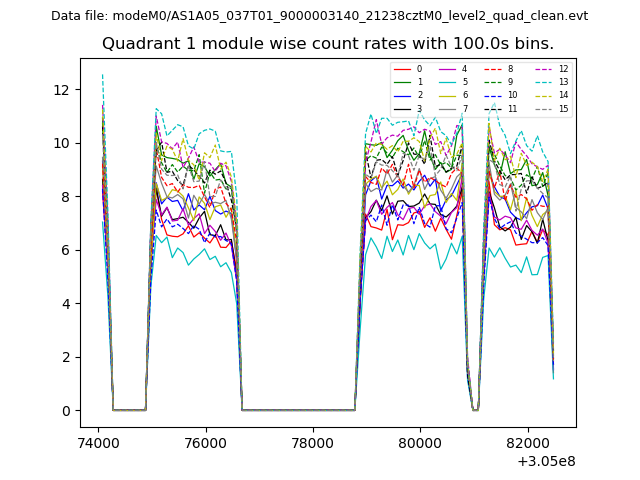 |
 |
| Module-wise count rates for Quadrant C Data is divided into 100 sec bins |
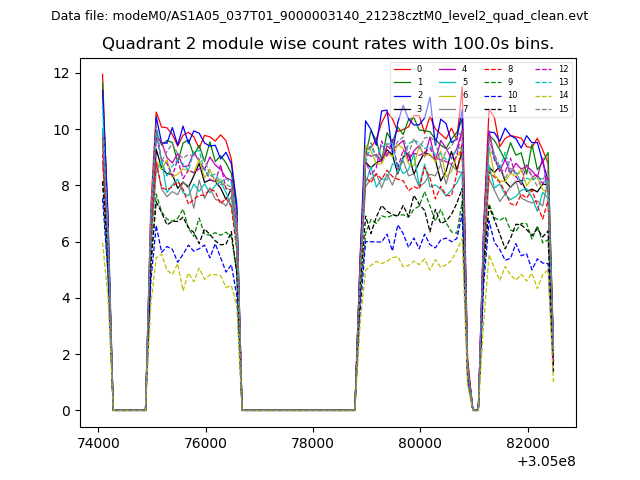 |
 |
| Module-wise count rates for Quadrant D Data is divided into 100 sec bins |
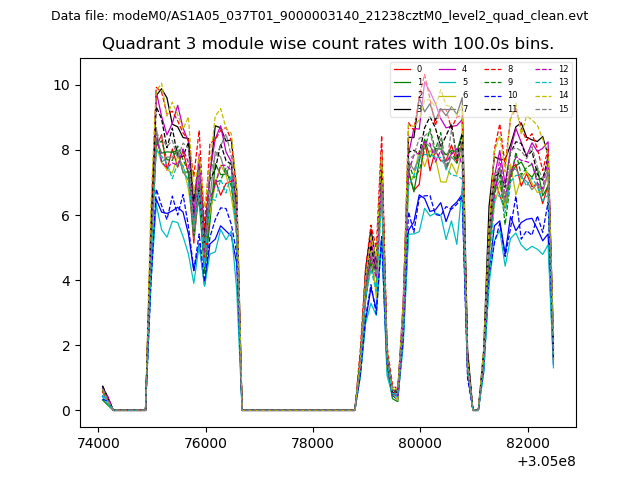 |
 |
| Parameter | Plot |
|---|---|
| CZT HV Monitor | 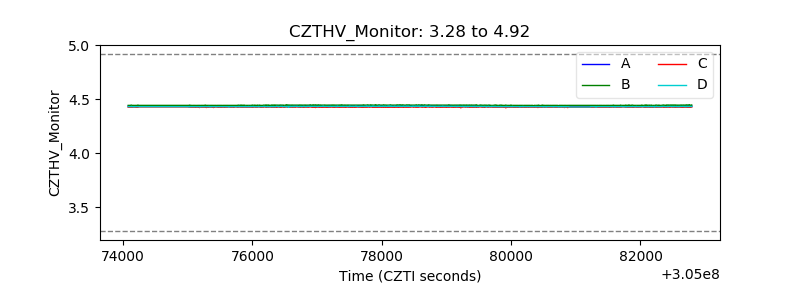 |
| D_VDD | 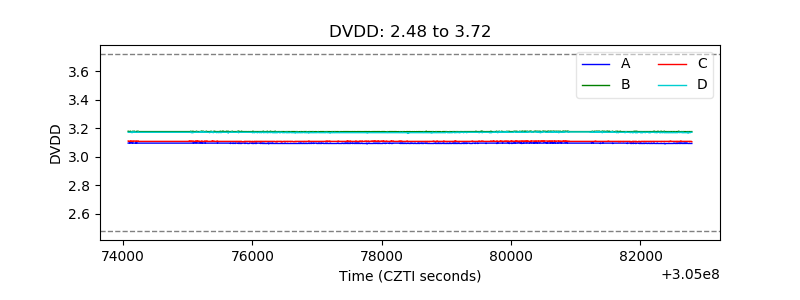 |
| Temperature 1 | 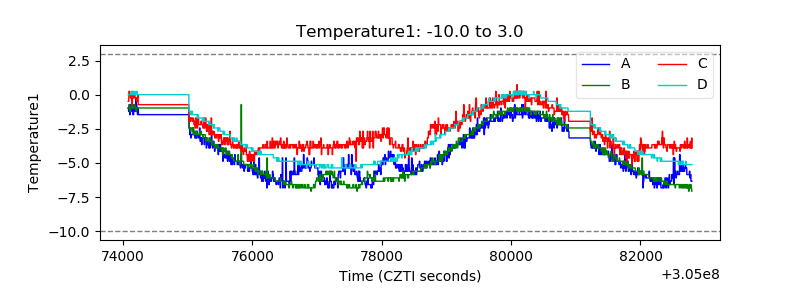 |
| Veto HV Monitor |  |
| Veto LLD | 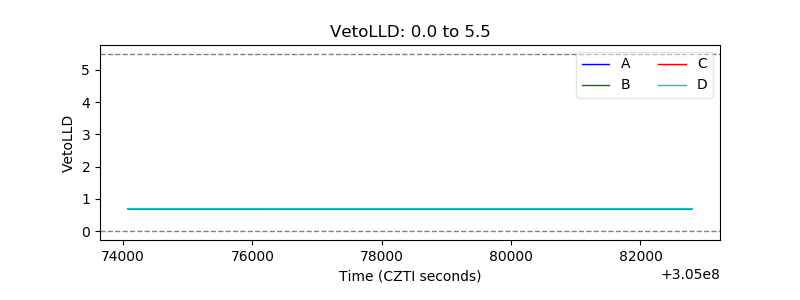 |
| Alpha Counter | 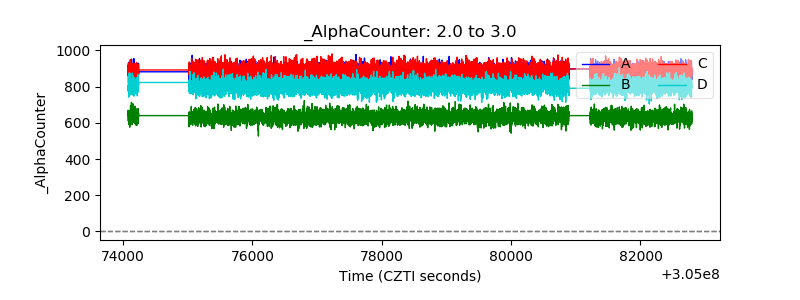 |
| _CPM_Rate | 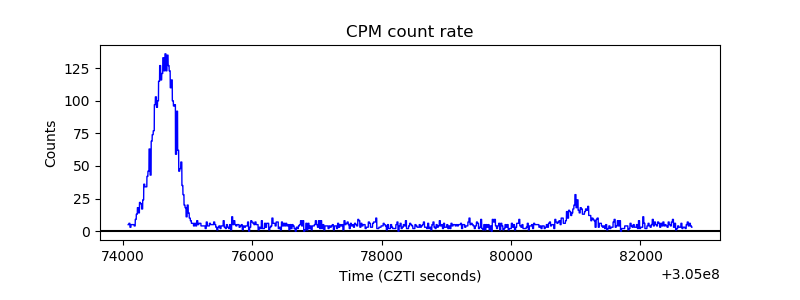 |
| CZT Counter | 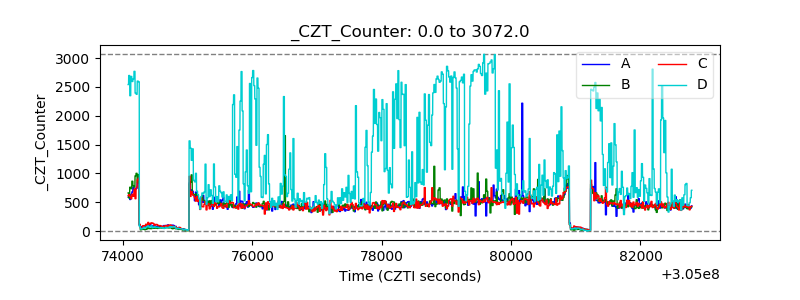 |
| +2.5 Volts monitor |  |
| +5 Volts monitor | 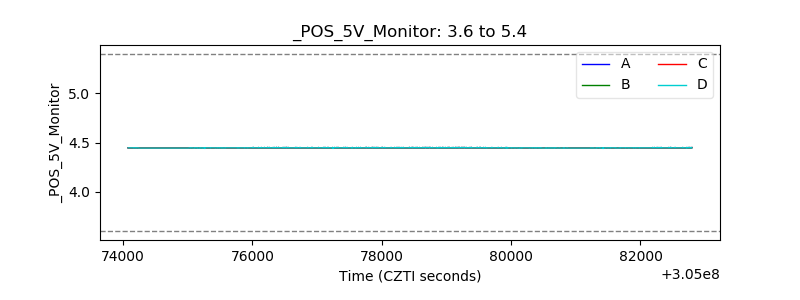 |
| _ROLL_ROT | 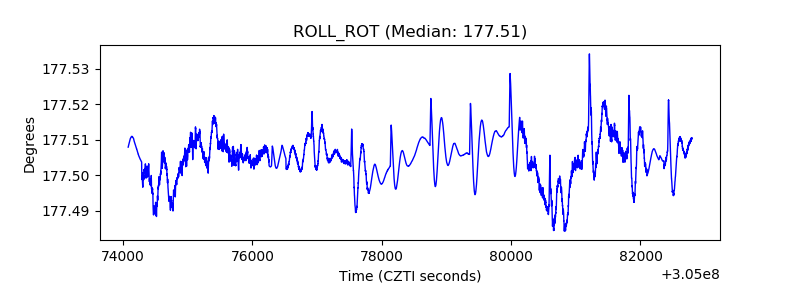 |
| _Roll_DEC | 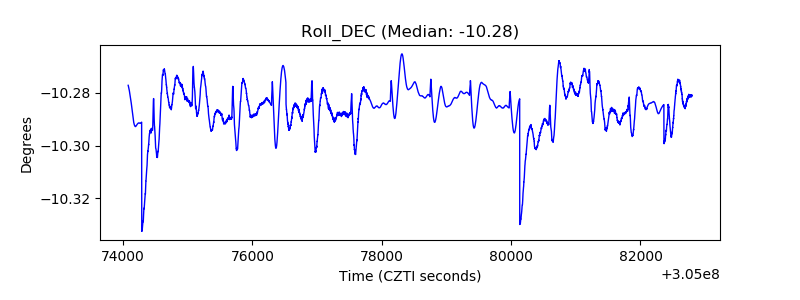 |
| _Roll_RA |  |
| Veto Counter | 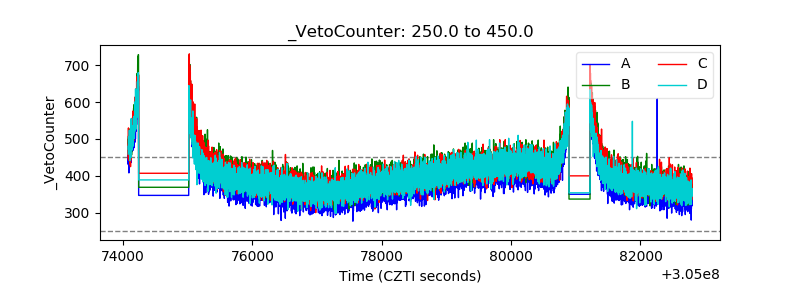 |