| Param | Original file | Final file |
|---|---|---|
| Filename | modeM0/AS1A05_037T01_9000003140_21239cztM0_level2.evt | modeM0/AS1A05_037T01_9000003140_21239cztM0_level2_quad_clean.evt |
| Size (bytes) | 706,222,080 | 98,216,640 |
| Size | 673.5 MB | 93.7 MB |
| Events in quadrant A | 3,937,165 | 639,389 |
| Events in quadrant B | 3,913,464 | 651,285 |
| Events in quadrant C | 3,787,341 | 634,167 |
| Events in quadrant D | 9,214,837 | 499,248 |
| Mode M9 | |||
|---|---|---|---|
| Quadrant | BADHDUFLAG | Total packets | Discarded packets |
| A | 0 | 4 | 0 |
| B | 0 | 4 | 0 |
| C | 0 | 4 | 0 |
| D | 0 | 4 | 0 |
| Mode M0 | |||
|---|---|---|---|
| Quadrant | BADHDUFLAG | Total packets | Discarded packets |
| A | 0 | 16851 | 2 |
| B | 0 | 16741 | 2 |
| C | 0 | 16437 | 2 |
| D | 0 | 32817 | 2 |
| Mode SS | |||
|---|---|---|---|
| Quadrant | BADHDUFLAG | Total packets | Discarded packets |
| A | 0 | 164 | 0 |
| B | 0 | 164 | 0 |
| C | 0 | 164 | 0 |
| D | 0 | 164 | 0 |
| Quadrant | Total seconds | Saturated seconds | Saturation percentage |
|---|---|---|---|
| A | 7895 | 154 | 1.950602% |
| B | 7896 | 151 | 1.912361% |
| C | 7896 | 157 | 1.988349% |
| D | 7895 | 1832 | 23.204560% |
Noise dominated data is calculated using 1-second bins in cleaned event files. If a bin has >2000 counts, and if more than 50% of those come from <1% of pixels, then it is considered to be noise-dominated and hence unusable.
| Quadrant | # 1 sec bins | Bins with >0 counts | Bins with >2000 counts | High rate bins dominated by noise | Noise dominated (total time) | Noise dominated (detector-on time) | Marked lightcurve |
|---|---|---|---|---|---|---|---|
| A | 8376 | 7896 | 14 | 14 | 0.17% | 0.18% | 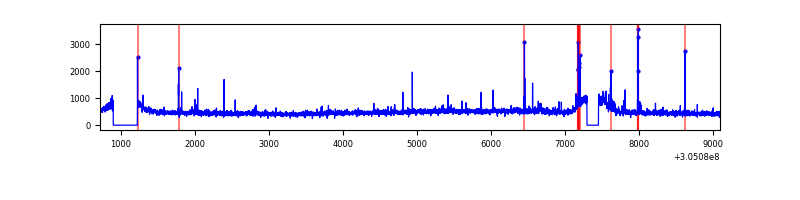 |
| B | 8377 | 7898 | 10 | 10 | 0.12% | 0.13% | 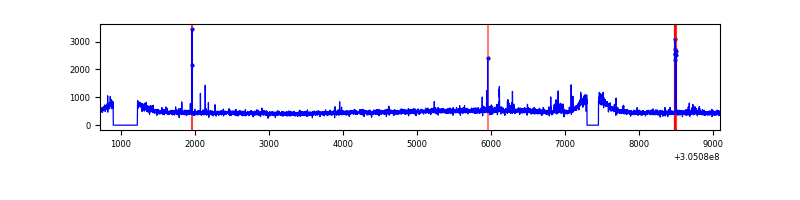 |
| C | 8377 | 7897 | 0 | 0 | 0.00% | 0.00% | 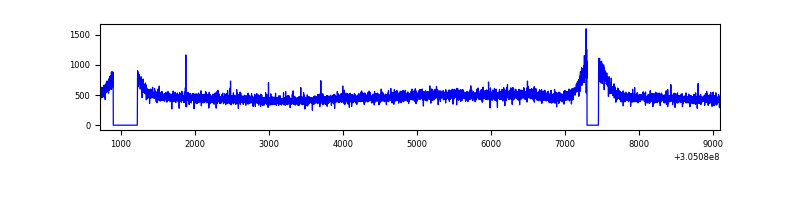 |
| D | 8376 | 7897 | 1628 | 1628 | 19.44% | 20.62% | 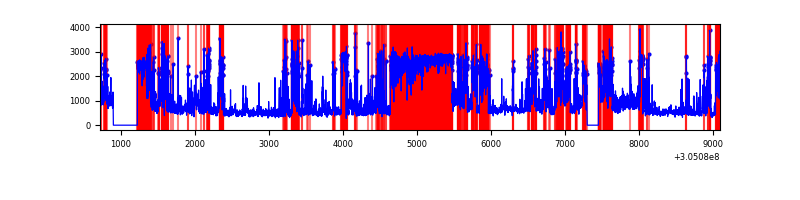 |
Top three noisy pixels from each quadrant. If the there are fewer than three noisy pixels in the level2.evt file, extra rows are filled as -1
| Pixel properties | Quadrant properties | ||||||
|---|---|---|---|---|---|---|---|
| Quadrant | DetID | PixID | Counts | Sigma | Mean | Median | Sigma |
| A | 5 | 16 | 95577 | 478.23 | 969 | 949 | 197.9 |
| A | 12 | 96 | 46273 | 229.06 | 969 | 949 | 197.9 |
| A | 11 | 47 | 44745 | 221.34 | 969 | 949 | 197.9 |
| B | 0 | 190 | 42140 | 217.54 | 971 | 945 | 189.4 |
| B | 3 | 64 | 36681 | 188.72 | 971 | 945 | 189.4 |
| B | 12 | 111 | 22790 | 115.36 | 971 | 945 | 189.4 |
| C | 14 | 238 | 143525 | 647.32 | 932 | 936 | 220.3 |
| C | 13 | 61 | 6588 | 25.66 | 932 | 936 | 220.3 |
| C | 0 | 207 | 4829 | 17.67 | 932 | 936 | 220.3 |
| D | 1 | 239 | 3244722 | 16203.73 | 820 | 795 | 200.2 |
| D | 7 | 238 | 1429197 | 7135.0 | 820 | 795 | 200.2 |
| D | 13 | 153 | 680508 | 3395.23 | 820 | 795 | 200.2 |
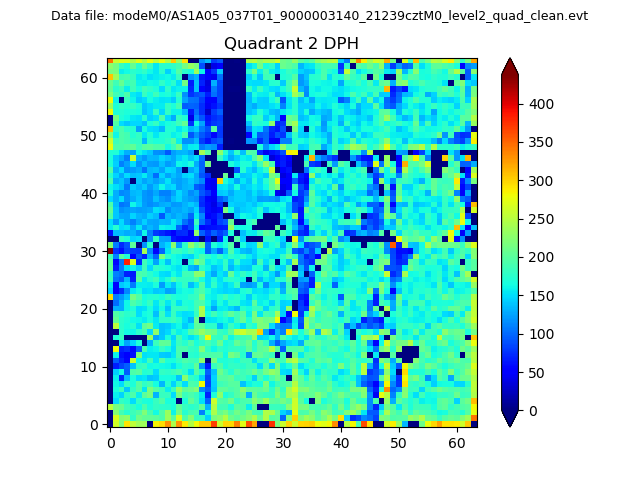
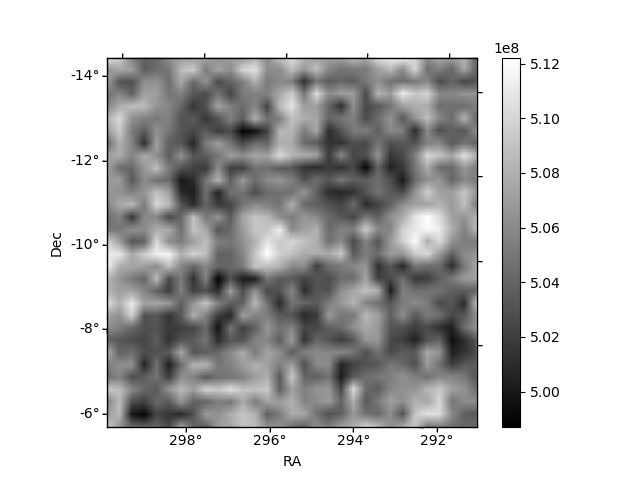
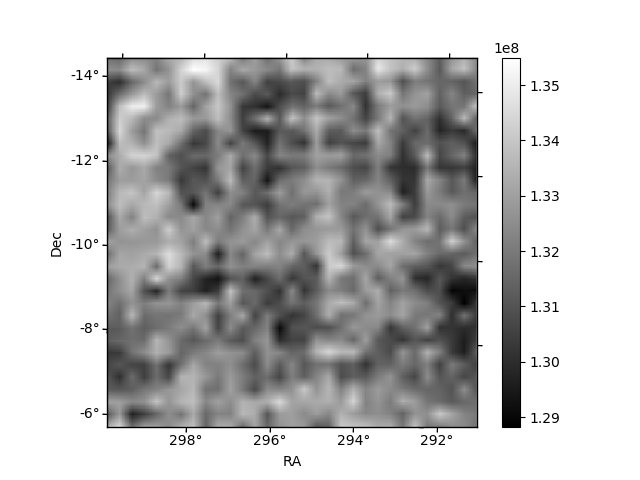
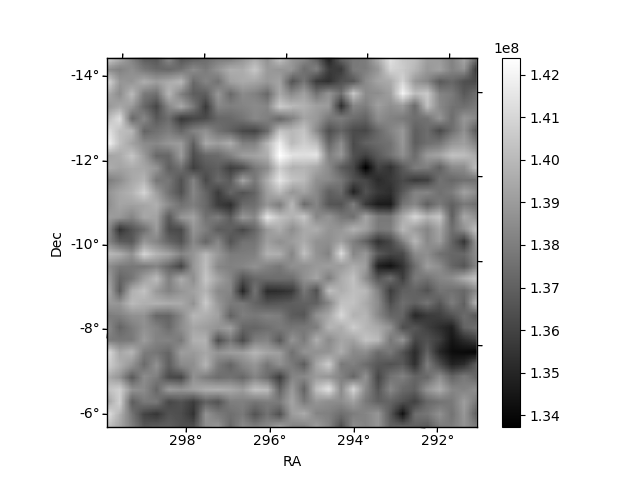
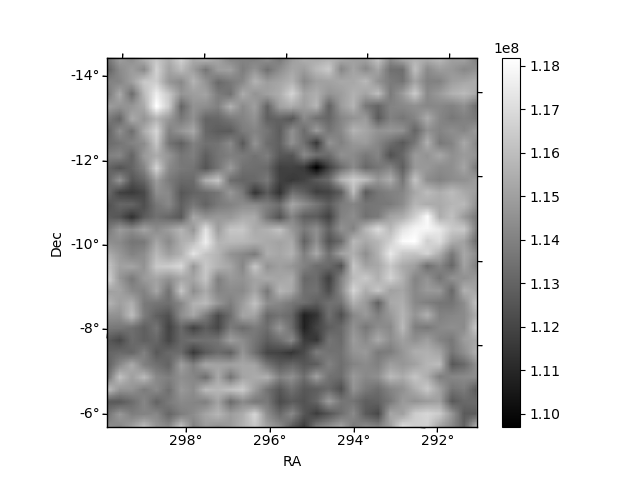
Histogram calculated using DETX and DETY for each event in the final _common_clean file
| Quadrant A | 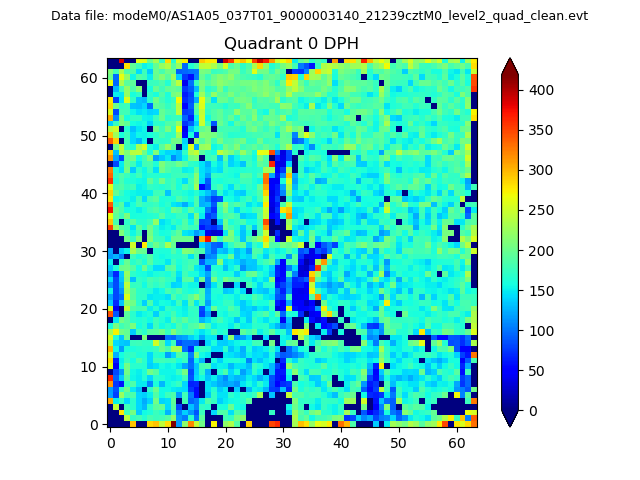 |
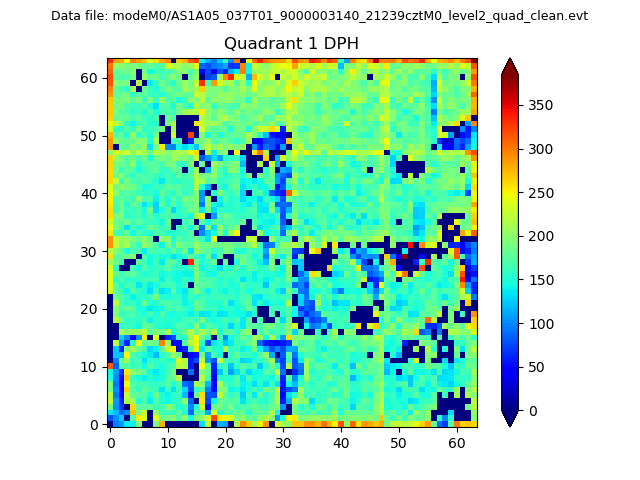 |
Quadrant B |
|---|---|---|---|
| Quadrant D | 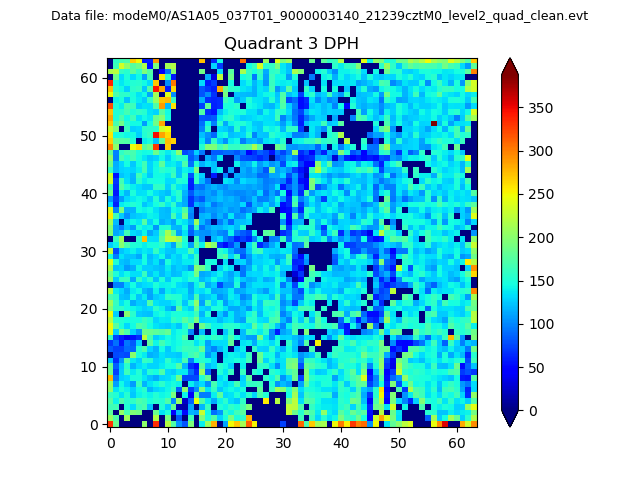 |
 |
Quadrant C |
| Plot type | Count rate plots | Images |
|---|---|---|
| Comparison with Poisson distribution Blue bars denote a histogram of data divided into 1 sec bins. Red curve is a Poisson curve with rate = median count rate of data. |
 |
 |
| Quadrant-wise count rates Data is divided into 100 sec bins |
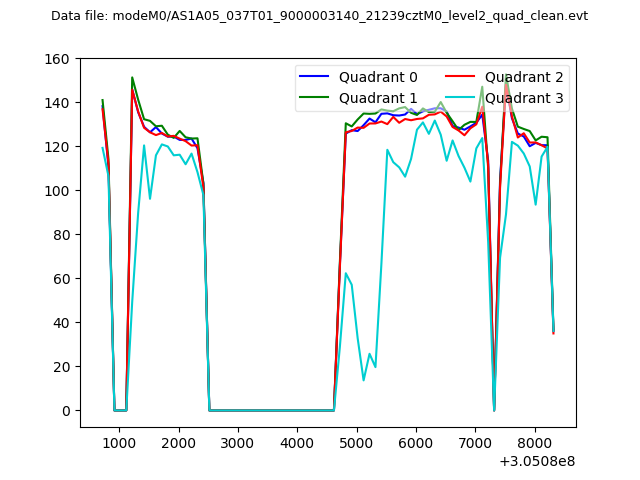 |
|
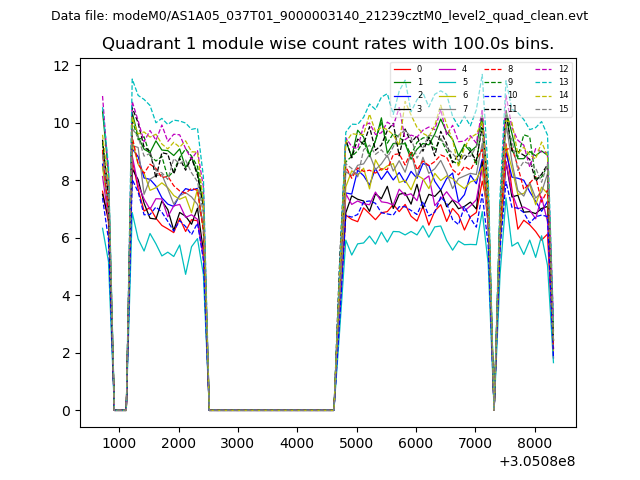
| Module-wise count rates for Quadrant A Data is divided into 100 sec bins |
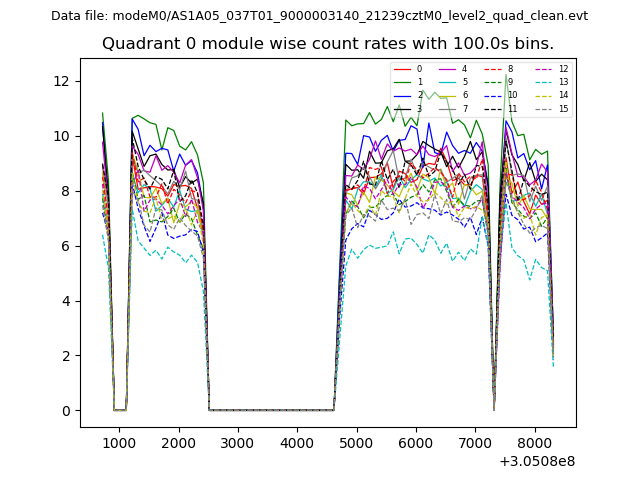 |
 |
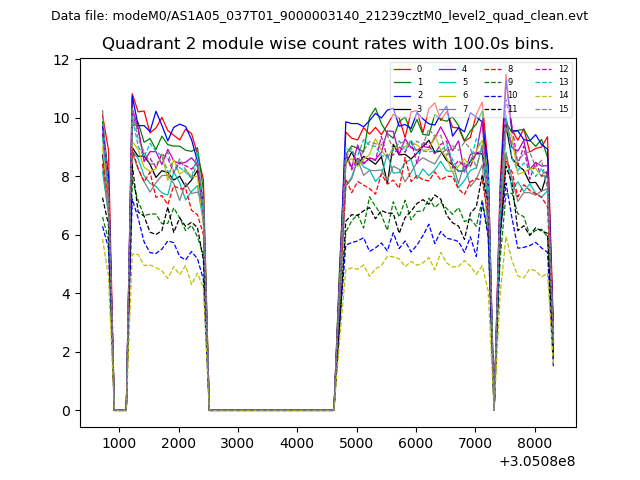
| Module-wise count rates for Quadrant B Data is divided into 100 sec bins |
 |
 |
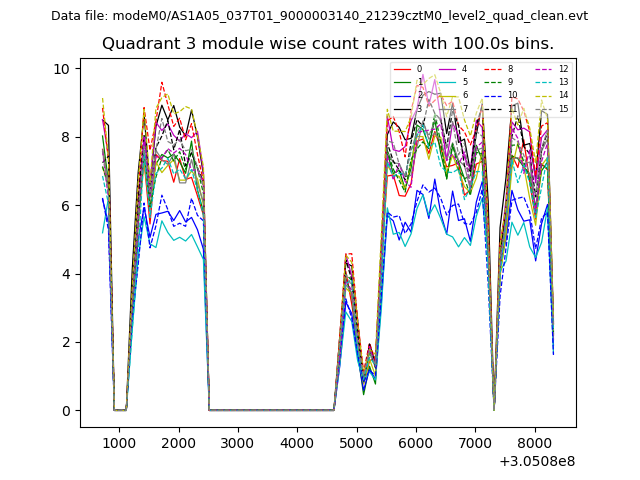
| Module-wise count rates for Quadrant C Data is divided into 100 sec bins |
 |
 |
| Module-wise count rates for Quadrant D Data is divided into 100 sec bins |
 |
 |
| Parameter | Plot |
|---|---|
| CZT HV Monitor | 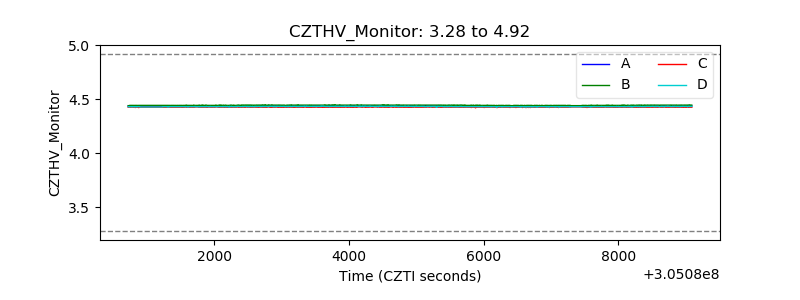 |
| D_VDD | 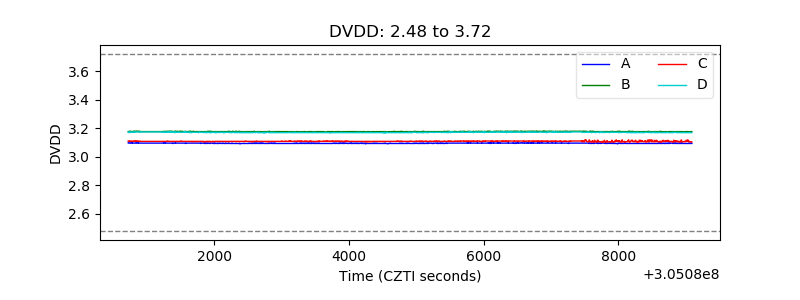 |
| Temperature 1 | 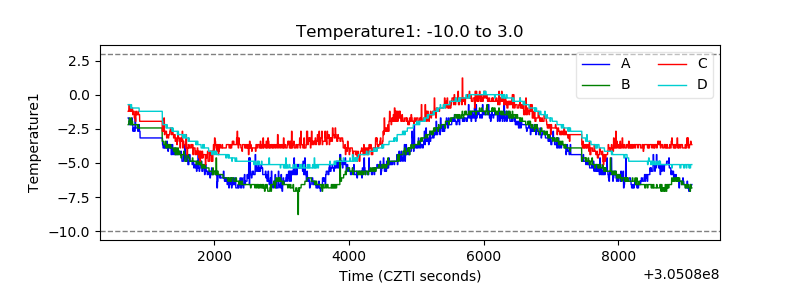 |
| Veto HV Monitor | 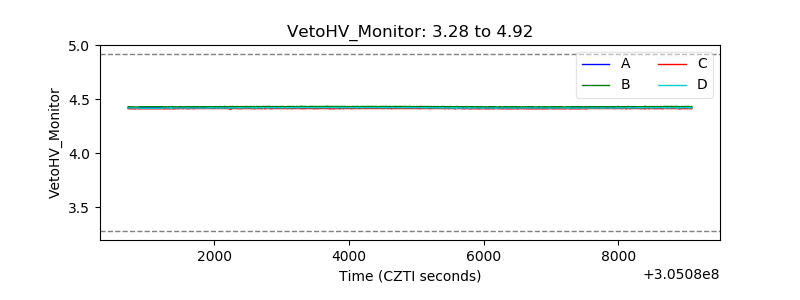 |
| Veto LLD | 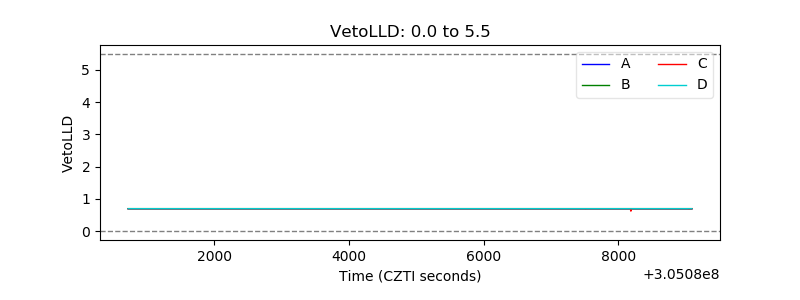 |
| Alpha Counter | 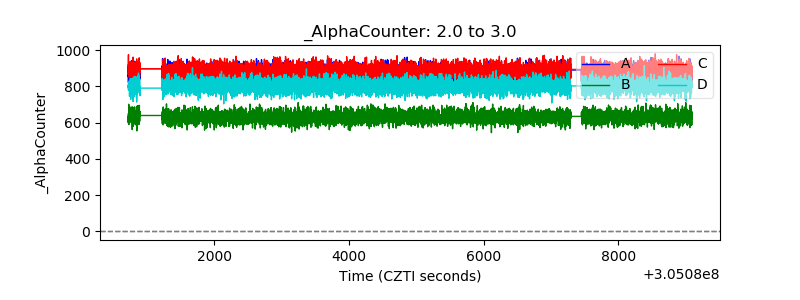 |
| _CPM_Rate | 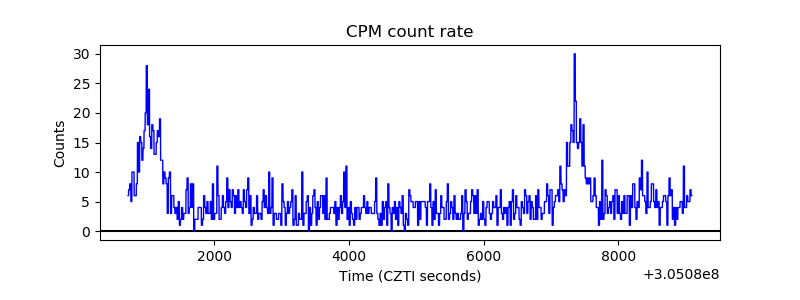 |
| CZT Counter | 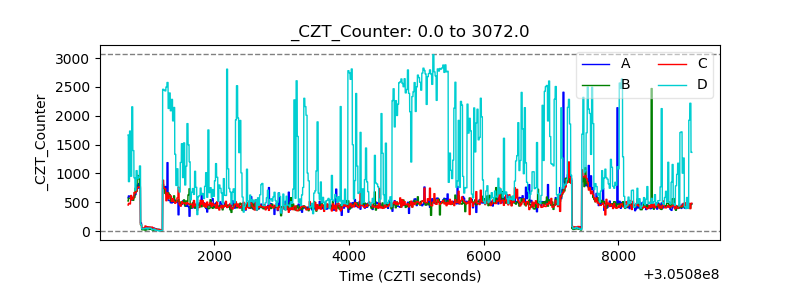 |
| +2.5 Volts monitor |  |
| +5 Volts monitor |  |
| _ROLL_ROT | 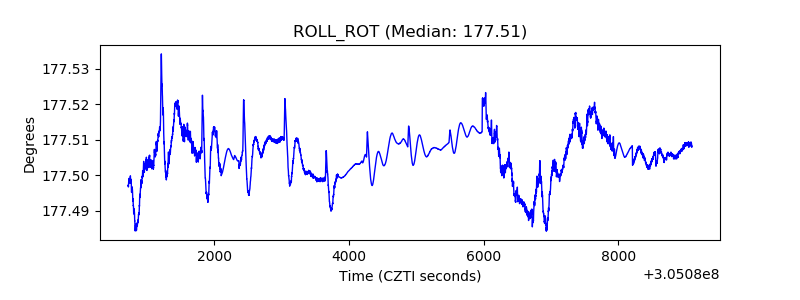 |
| _Roll_DEC | 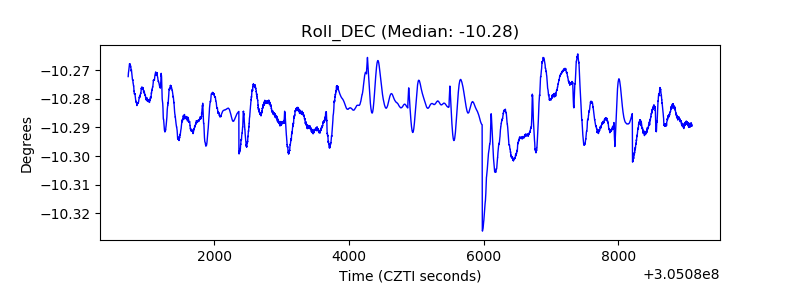 |
| _Roll_RA | 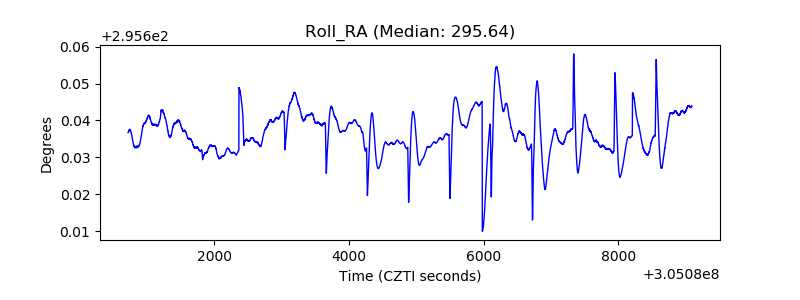 |
| Veto Counter | 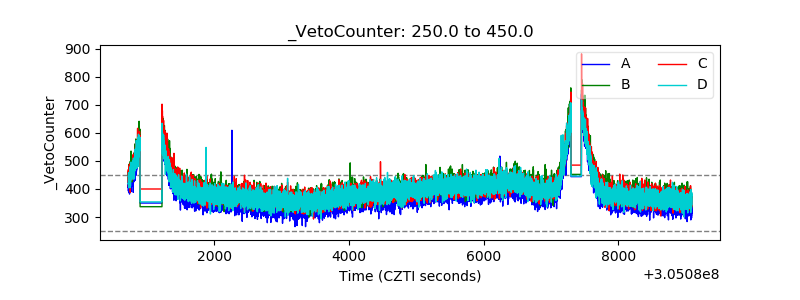 |