| Param | Original file | Final file |
|---|---|---|
| Filename | modeM0/AS1A05_037T01_9000003140_21240cztM0_level2.evt | modeM0/AS1A05_037T01_9000003140_21240cztM0_level2_quad_clean.evt |
| Size (bytes) | 754,614,720 | 90,518,400 |
| Size | 719.7 MB | 86.3 MB |
| Events in quadrant A | 4,072,131 | 579,723 |
| Events in quadrant B | 3,969,257 | 579,925 |
| Events in quadrant C | 3,838,158 | 570,805 |
| Events in quadrant D | 10,438,832 | 460,197 |
| Mode M9 | |||
|---|---|---|---|
| Quadrant | BADHDUFLAG | Total packets | Discarded packets |
| A | 0 | 5 | 0 |
| B | 0 | 5 | 0 |
| C | 0 | 5 | 0 |
| D | 0 | 5 | 0 |
| Mode M0 | |||
|---|---|---|---|
| Quadrant | BADHDUFLAG | Total packets | Discarded packets |
| A | 0 | 17362 | 2 |
| B | 0 | 16881 | 2 |
| C | 0 | 16570 | 2 |
| D | 0 | 36508 | 2 |
| Mode SS | |||
|---|---|---|---|
| Quadrant | BADHDUFLAG | Total packets | Discarded packets |
| A | 0 | 162 | 0 |
| B | 0 | 162 | 0 |
| C | 0 | 162 | 0 |
| D | 0 | 162 | 0 |
| Quadrant | Total seconds | Saturated seconds | Saturation percentage |
|---|---|---|---|
| A | 7906 | 197 | 2.491778% |
| B | 7907 | 194 | 2.453522% |
| C | 7907 | 175 | 2.213229% |
| D | 7907 | 2432 | 30.757557% |
Noise dominated data is calculated using 1-second bins in cleaned event files. If a bin has >2000 counts, and if more than 50% of those come from <1% of pixels, then it is considered to be noise-dominated and hence unusable.
| Quadrant | # 1 sec bins | Bins with >0 counts | Bins with >2000 counts | High rate bins dominated by noise | Noise dominated (total time) | Noise dominated (detector-on time) | Marked lightcurve |
|---|---|---|---|---|---|---|---|
| A | 8416 | 7907 | 34 | 34 | 0.40% | 0.43% | 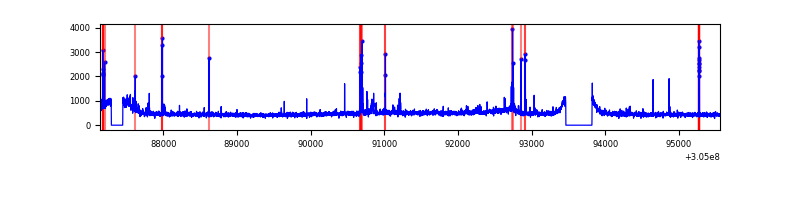 |
| B | 8417 | 7909 | 12 | 12 | 0.14% | 0.15% | 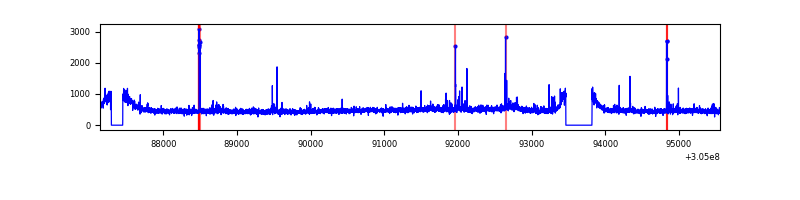 |
| C | 8417 | 7908 | 0 | 0 | 0.00% | 0.00% | 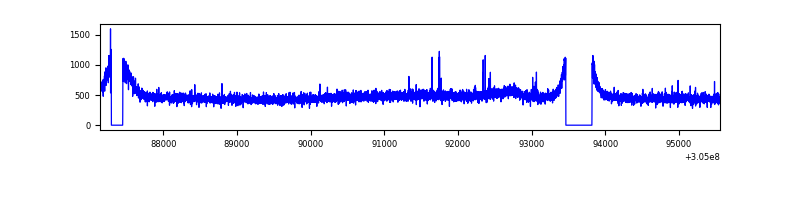 |
| D | 8417 | 7909 | 2129 | 2129 | 25.29% | 26.92% | 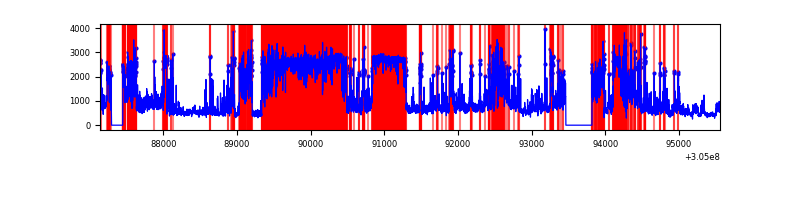 |
Top three noisy pixels from each quadrant. If the there are fewer than three noisy pixels in the level2.evt file, extra rows are filled as -1
| Pixel properties | Quadrant properties | ||||||
|---|---|---|---|---|---|---|---|
| Quadrant | DetID | PixID | Counts | Sigma | Mean | Median | Sigma |
| A | 5 | 16 | 181464 | 907.99 | 977 | 957 | 198.8 |
| A | 12 | 96 | 73684 | 365.83 | 977 | 957 | 198.8 |
| A | 11 | 47 | 33452 | 163.46 | 977 | 957 | 198.8 |
| B | 0 | 190 | 36519 | 188.13 | 975 | 953 | 189.1 |
| B | 3 | 64 | 34125 | 175.46 | 975 | 953 | 189.1 |
| B | 0 | 197 | 26986 | 137.7 | 975 | 953 | 189.1 |
| C | 14 | 238 | 142805 | 633.85 | 939 | 945 | 223.8 |
| C | 0 | 207 | 19310 | 82.06 | 939 | 945 | 223.8 |
| C | 8 | 128 | 11924 | 49.06 | 939 | 945 | 223.8 |
| D | 1 | 239 | 4978616 | 26207.69 | 772 | 751 | 189.9 |
| D | 7 | 238 | 2000016 | 10525.82 | 772 | 751 | 189.9 |
| D | 13 | 153 | 178812 | 937.46 | 772 | 751 | 189.9 |
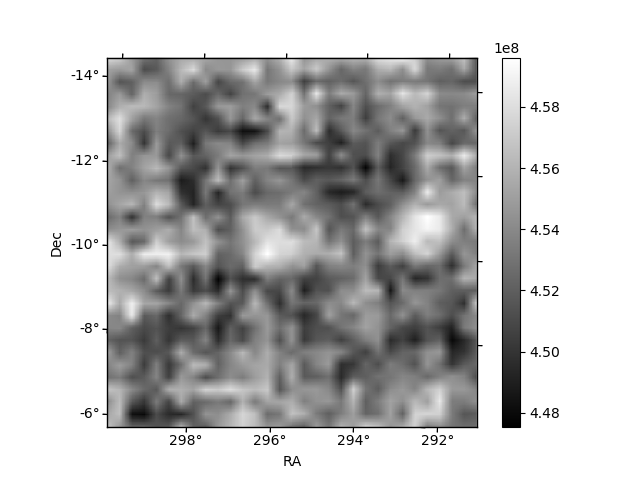
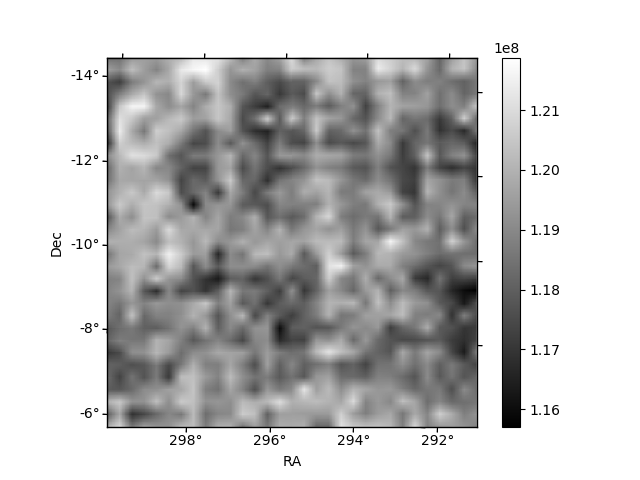
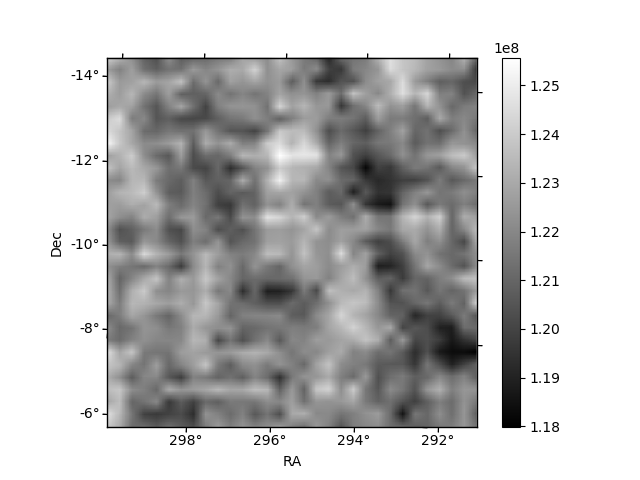
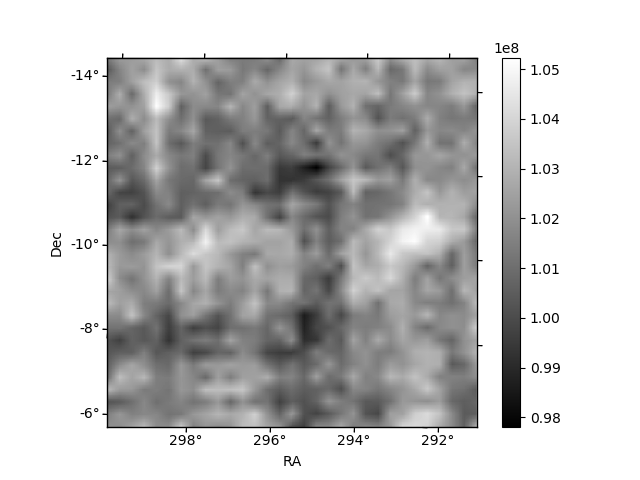
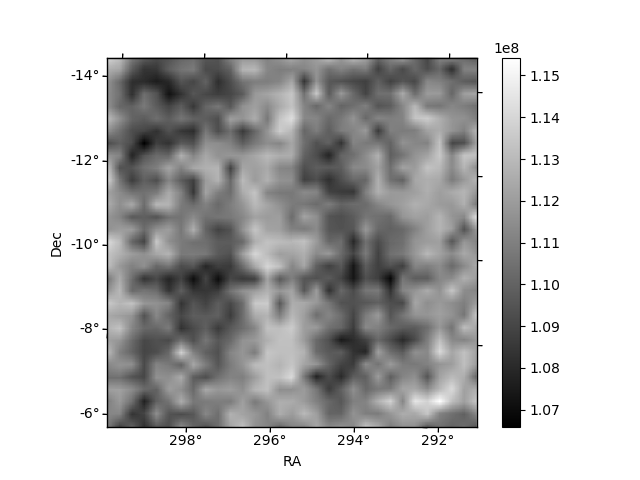
Histogram calculated using DETX and DETY for each event in the final _common_clean file
| Quadrant A | 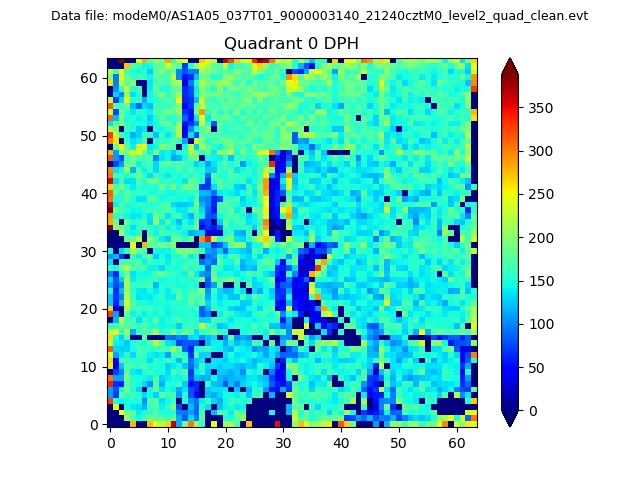 |
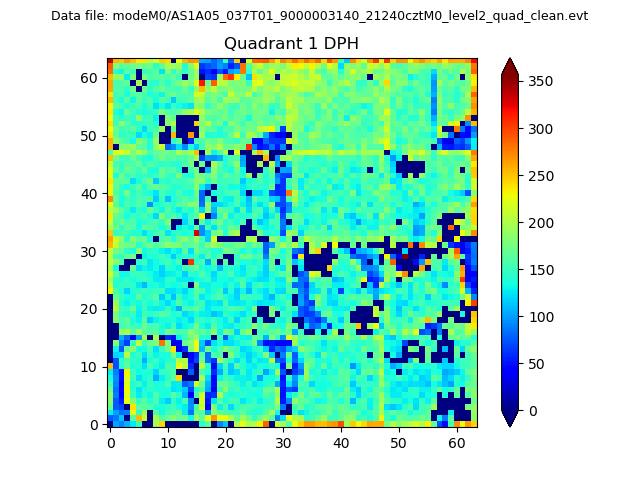 |
Quadrant B |
|---|---|---|---|
| Quadrant D | 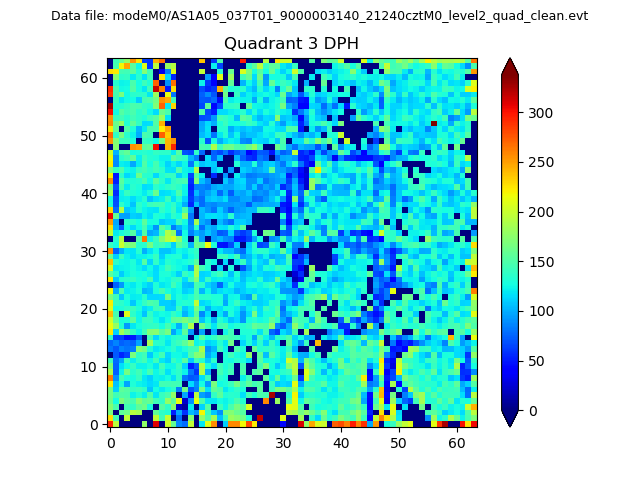 |
 |
Quadrant C |
| Plot type | Count rate plots | Images |
|---|---|---|
| Comparison with Poisson distribution Blue bars denote a histogram of data divided into 1 sec bins. Red curve is a Poisson curve with rate = median count rate of data. |
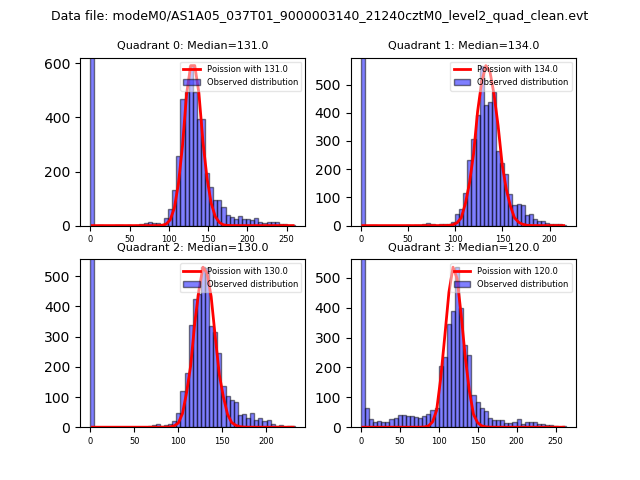 |
 |
| Quadrant-wise count rates Data is divided into 100 sec bins |
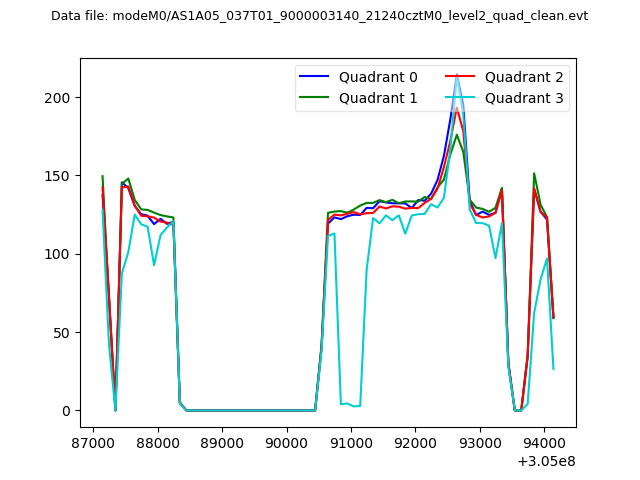 |
|
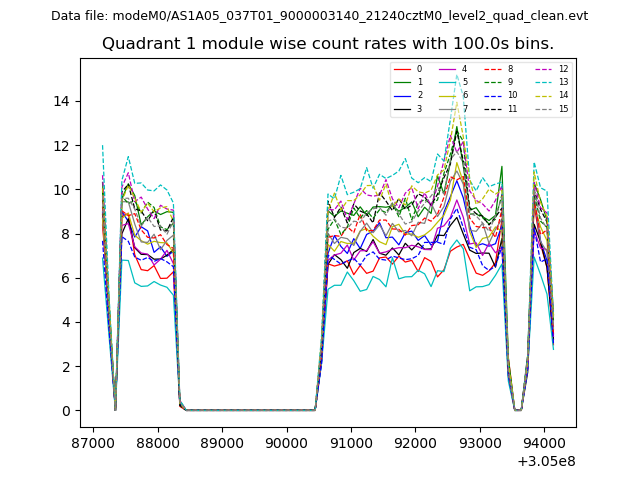
| Module-wise count rates for Quadrant A Data is divided into 100 sec bins |
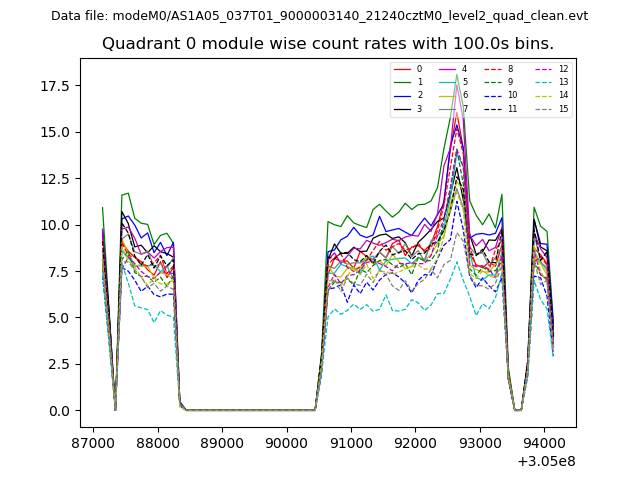 |
 |
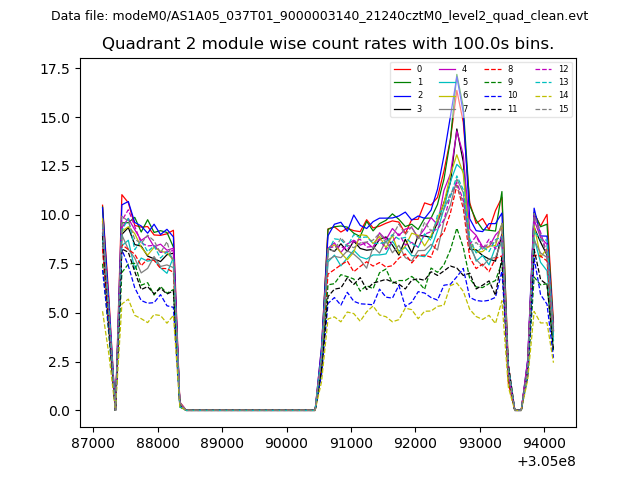
| Module-wise count rates for Quadrant B Data is divided into 100 sec bins |
 |
 |
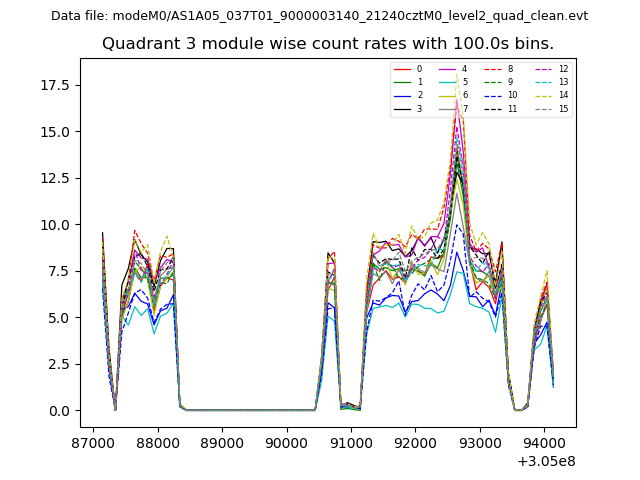
| Module-wise count rates for Quadrant C Data is divided into 100 sec bins |
 |
 |
| Module-wise count rates for Quadrant D Data is divided into 100 sec bins |
 |
 |
| Parameter | Plot |
|---|---|
| CZT HV Monitor | 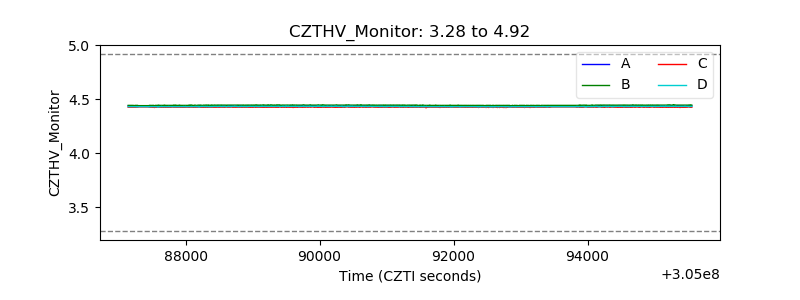 |
| D_VDD | 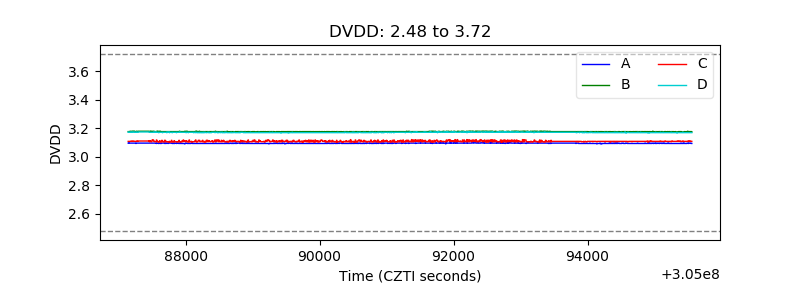 |
| Temperature 1 | 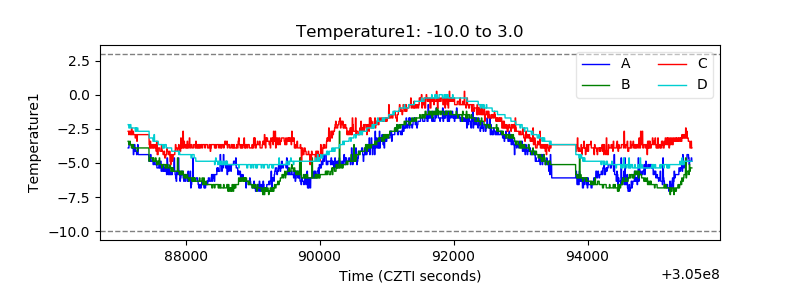 |
| Veto HV Monitor | 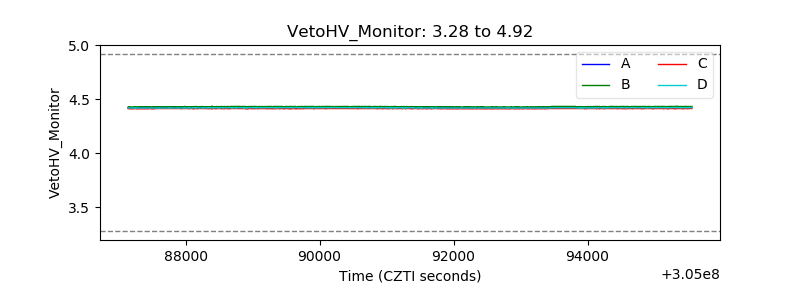 |
| Veto LLD | 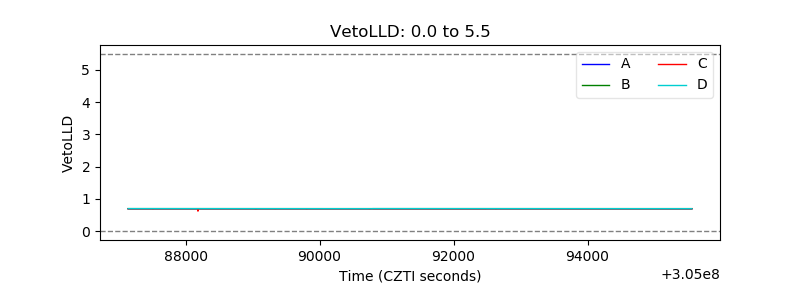 |
| Alpha Counter | 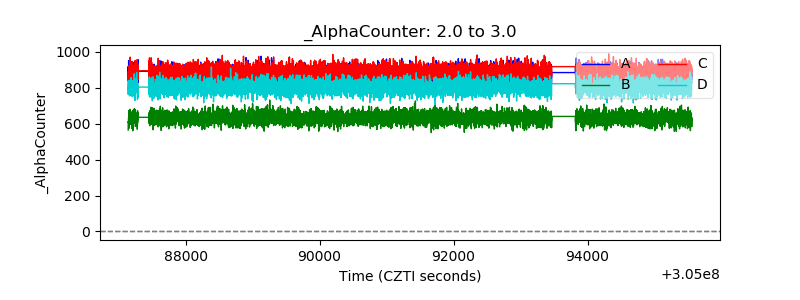 |
| _CPM_Rate | 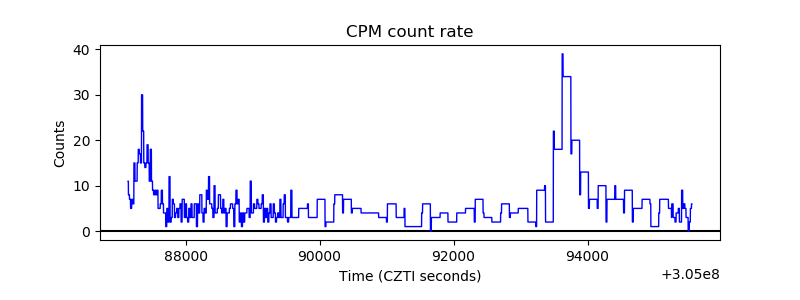 |
| CZT Counter |  |
| +2.5 Volts monitor |  |
| +5 Volts monitor | 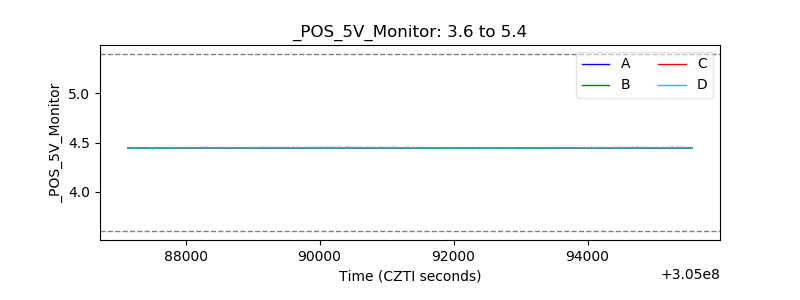 |
| _ROLL_ROT | 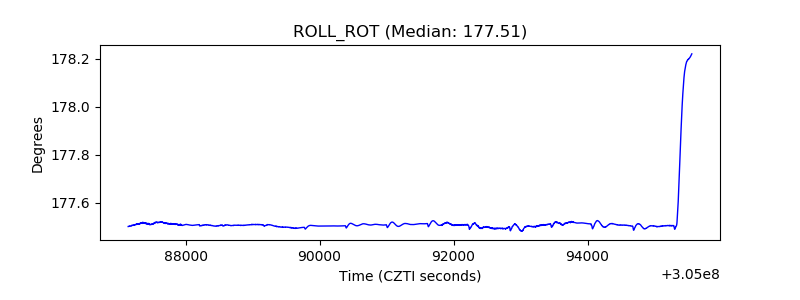 |
| _Roll_DEC | 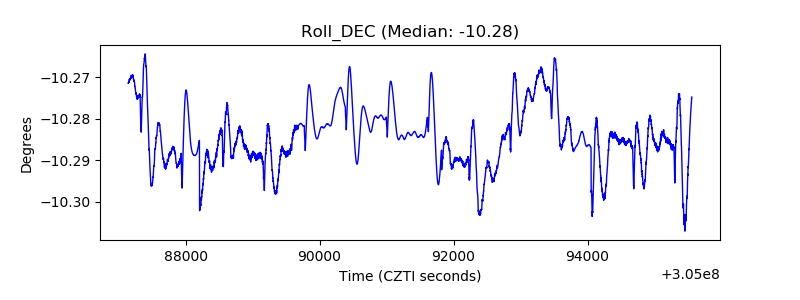 |
| _Roll_RA | 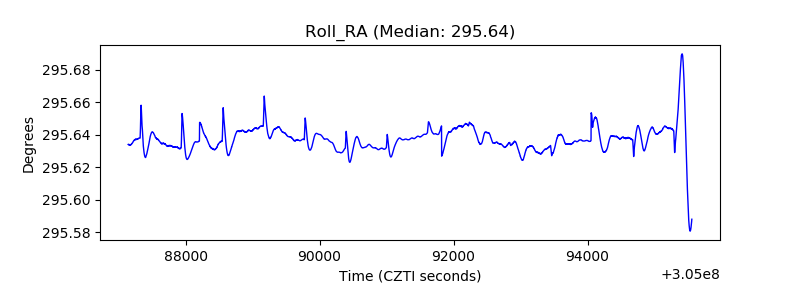 |
| Veto Counter | 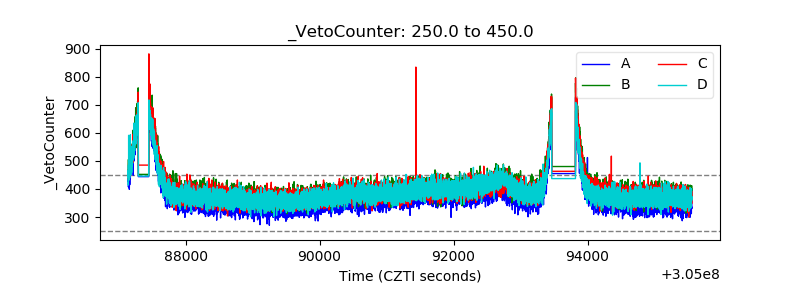 |